

Breath indeed carries significant information about a disease: Potential biomarkers of cerebral palsy
Funding information: Buhl-Strohmaier Foundation; Klaus Tschira Stiftung; Klaus Tschira Foundation; Würth Foundation
Abstract
Objective and reliable noninvasive medical diagnostics of a large variety of diseases is still a dream. As a step in the direction of realization, a spectroscopic breath study of cerebral palsy (CP) was performed. Principal component analysis revealed data clustering for a healthy group and CP individuals was observed, with a P-value below 10−5. Learning algorithms resulted in 91% accuracy in distinguishing the groups. With the help of manual analysis of absorption spectral features of breath samples, two volatile organic compounds were identified that demonstrate significant deviations in the groups. These represent two esters of propionic acid (PPAE). A transportation scheme was hypothesized that links the gut where propionic acid (PPA) and PPAE are produced, the brain of CP patients, through which PPA and PPAE transmit, and the lungs where PPAE releases. The results show a possibility to detect one more brain-related disorder via breath, in this case CP.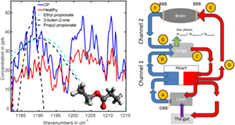
1 INTRODUCTION
The European history of considering breath a carrier of information about a human body state originates from the ancient Greeks. Now, at the end of the second decade of the 21st century, in spite of the support of a powerful family of the measurement techniques like gas chromatography mass spectrometry [1-3], electronic nose [4] and emerging optical spectroscopy [5-9], it is still unclear whether breath analysis can be used for an unambiguous detection of diseases or, for the general detection of different body states [10-12]. Possible reasons for this in regard to the first two techniques were discussed in refs. [13, 14]. Recently, we found that the breath content can be measured in a reliable manner by means of mid-infrared spectroscopy [13]. It can also be used for the identification of a healthy person, representing his/her unique island of stability in terms of a broad variety of volatile organic compounds (VOCs) in particular [14], and physiological parameters in general (the homeostasis, and allostasis paradigms [15] at different time scales). We also demonstrated how various life effects can affect escape from the island of stability, with the following return (the resilience paradigm). Here, we take one step further and show that breath can carry significant information about a disease, in this case cerebral palsy (CP).
There is a current difficulty for physicians of distinguishing progressive and nonprogressive damage to the developing brain in general, and distinguishing CP from a family of nonprogressive brain-related diseases at early ages in particular (for detail, see section 1 of the Supplementary Materials). As the first step in this direction, brain abnormality must be detected. In this paper, we suggest obtaining first evidence of abnormality via breath, due to the ease of sampling and measurement steps, accompanied by its high total accuracy [13, 14]. Breath provides physiological analysis based on metabolites and could be added to the morphological and behavioral diagnostics, in order to make the analysis of the state of the patient with CP more complete. Physiological analysis could therefore help in revealing the existence of the damaged brain parts at a very early age, which could only later result in impairments of the motor function, learning disability, speech disorders and behavioral problems. The argument against physiological analysis is also obvious: the blood–brain barrier blocks most of the metabolites circulating in the bloodstream. However, these pro and contra arguments need experimental verification.
The diseases recently studied via biofluids in gas phase breath include lung [16] and breast [17] cancers (breath) as well as bladder cancer (urine headspace [18]). So far, a limited amount of studies evidences that biofluids of a neurological patient carry specific information [19-23]. The studies included Parkinson's [19, 20], Alzheimer's [21, 22] diseases and multiple sclerosis [23]. The demonstrated accuracy in discrimination of diseased and control groups approached 90%.
Based on the results shown in the next section, we explain in the Discussion section why spectroscopy was chosen for this study in spite of the situation when mass spectrometry is used in 99% of relevant studies. A detailed discussion in this regard can be found in our paper [14]. In case of optical (mid-infrared) absorption spectroscopy, an advantage of a biofluid study in gas phase consists in its low density, leading to narrow spectral signatures. These signatures can then be uniquely identified as VOCs. The details of the identification procedure that we developed can be found in the Methods section. Usually, VOCs are considered small molecules, with less than 100 atomic units. It is worth noting that for the liquid phase, molecular identification is still not possible due to significant spectral broadening, resulting in the overlapped spectral structures. The mid-infrared range is chosen because all VOCs have high absorption due to the fundamental bands, leading to high detection sensitivity (for illustration, see [6]). A disadvantage of the low density of the gas phase related to weak absorption makes detection technically difficult at the necessary sub-ppm (part per million by volume) level.
The current state of mid-infrared laser spectroscopy allows for the measurement of approximately 20 VOCs down to the sub-ppb concentration level, although not all of them are in a real breath sample [5, 8]. Two main parameters are usually used for characterization of any type of spectroscopy: the spectral coverage and the signal-to-noise ratio, linked to the detection sensitivity. The breath sample contains a significant amount of water vapor that has strong and broadband absorption bands, which bury other VOCs of lower absorptions. This obstacle contributes to the noise associated with a certain type of spectroscopy. Therefore, the steps of increasing the detection sensitivity toward hundreds of VOCs must be accompanied by the water suppression of up to five orders of magnitude. Our approach and its realization for water suppression by three orders of magnitude [13] is explained in the Methods section. In fact, the result represents the best suppression factor for water achieved so far, accompanied by efficient ice removal. The latter is essential for providing measurements of many samples under controlled conditions. The way to increase the signal is reasonably associated with the laser spectroscopy, although it currently does not provide enough spectral covering from 5 to 20 μm (2000–500 cm−1) [7, 9, 10, 24]. In this study, we were interested in exploiting that entire spectral interval, in order to catch the maximum amount of VOCs and we therefore used Fourier spectroscopy based on an extremely broadband and stable thermal source, in spite of moderate sensitivity demonstrated so far. By using this type of spectroscopy combined with efficient water suppression, we show in this paper how breath can be used for objective analysis of patients with movement disorders (with focus on CP), in addition to conventional (behavioral) clinical examination.
2 THE EXPERIMENTAL STEPS AND RESULTS
At the first step, the collected and averaged breath absorption spectra of the two groups under study were analyzed in the entire spectral range 500–4000 cm−1. At the second step, we focused on the most striking spectral features that differentiate the groups. The resulting spectral range of our main attention is shown in Figure 1A. The two average spectra for healthy and diseased groups show distinct difference in absorbance (or later, in concentration of the identified VOCs) for structures centered at 1189 and 1203 cm−1 proven by plot boxes in Figure 1B. For the latter, the absorption spectra were analyzed manually by visual inspection of the spectral features. At the third step, a conventional statistical analysis was then performed on the spectral data in the range 1185–1215 cm−1 using the following different techniques: unsupervised principal component analysis (PCA, also PC analysis) and supervised Support Vector Machine (SVM) and Random Forest (RF), with the corresponding results presented in Figures 2 and 3. For supervised analysis, we used the leave-one-out cross validation (LOOCV) model allowing to monitor each participant of the study. This approach is optimal for small groups that we had at our disposal (see section 5.5 of Methods). The combined PCA and ANOVA approach demonstrated pronounced data clustering with a P-value below 10−5. The results of the SVM analysis are shown in Figure 3. The corresponding confusion matrix contains two nondiagonal elements: one for a non-CP patient marked MD that has muscular dystrophy, and another for a healthy individual depicted at the border between two ovals in Figure 2A. We note that a patient marked ES with movement disorder, fell into the oval area representing patients with CP. The area under the receiver operating characteristic curve (ROC AUC) of the SVM analysis is 0.93 whereas for RF is 0.90. The achieved accuracy in distinguishing the healthy and diseased groups for supervised algorithms exceeds 91%.


As spectroscopy of biofluids in gas phase allows the researcher to reveal molecules contributing to the absorption features, we performed such a study (the fourth step) based on spectral features shown in Figure 1A and the algorithm described in the Methods section. As candidates having absorption features in the selected range, we chose propionic acid ethyl and propyl esters, 3-buten-2-one, methyl butyrate, dimethyl ester of carbonic acid and butyl ester of butanoic acid. The best three candidates of them fitting the low-wavenumber spectral features centered around 1189 cm−1 are depicted in Figure 1. Propyl and ethyl propionates have absorption maxima at 1188 and 1189 cm−1, correspondingly. The fit between the experimental-breath-sample maximum at 1189 cm−1 and the measured maxima of the two PPAEs was within 2 cm−1. Therefore, we concluded that the two PPAEs are the best candidates for the low-wavenumber spectral feature shown in Figure 1. According to the Human Metabolome Database (HMDB), both PPAEs have relation to physiological processes in the body [26].
Another candidate shown in the Figure 1A but not yet discussed is butenone. This molecule was reported in [27] as a breath VOC. It matches the maximum of the low-wavenumber spectral structure but not its width. Moreover, we were unable to link it to any endogenous process in the body. In HMDB, butenone was reported as a metabolite found in saliva [26]. Another structure in the Figure centered at 1203 cm−1 is still not identified, this work is in progress. In the following discussion, we will concentrate on the propionic acid esters because of two reasons: (a) their absorption maxima and spectral widths fit better the observed spectral structures and (b) they are produced endogenously in the body, thus allowing to propose a transportation model (described in detail in section 3 of Supplementary Materials).
The fifth step included the identification of the vibration mode of PPAE. A broad view of the PPAE absorption spectrum is shown in Figure S1. One can see a good agreement between the calculated and measured spectra (for details, see section 5.2 of Methods). A very strong absorption peak around 1190 cm−1 measured in the experiment and confirmed then by the calculation (Figure S1) allowed us to identify the corresponding vibrational mode of the molecule. The mode was identified as a combination of the backbone C─O stretching mode and the C─H bending mode in the ethyl group. The corresponding vibrational motion is shown as an animated movie (Animation S1).
The results can be summarized as follows. By comparing the breath data of diseased (movement disorders) and healthy groups, several spectral structures were revealed. The low-wavenumber feature around 1189 cm−1 was then ascribed to a product of overlapping ethyl and propyl propionic acid esters (PPAE). Conventional statistical unsupervised analysis (the combination of ANOVA and PCA) based on the entire spectral range 1185–1215 cm−1 resulted in clustering individuals into two distinct groups, with the corresponding P-value below 10−5. Supervised (learning) algorithms demonstrated 91% accuracy in distinguishing the groups.
3 DISCUSSION
The accuracy of the molecular identification procedure described in the Methods is definitely worse than that achieved for gas chromatography mass spectrometry. On the other hand, infrared spectroscopy allowed us, unlike mass spectrometry, to unambiguously discriminate esters relevant to this study: methyl butyrate, ethyl propionate, isopropyl acetate. The esters have the same chemical formula C5H10O2 but different 3D structures. These molecules were among the candidates in our attempts to fit spectra shown in Figure 1. In future, a combination of sub-ppb-level laser spectrometer that we are developing [24] with further water suppression of up to five orders of magnitude, as well as significant suppression of carbon dioxide and methane (physically or digitally or both), should reveal more than the just mentioned spectral features. This work is in progress.
An identification of the PPAE vibration linked to the spectra shown in Figures 1A and S1, gives us an important hint. This complex vibration, unlike low-specific single C─H, C─O or C═O modes used in analyses of liquid phase of biofluid, characterizes the molecule in a unique way because all the molecular skeleton is involved (Animation S1). This is another evidence of the power of gas phase spectroscopy.
Should the performed molecular identification be correct, another intriguing question can be posed: why PPAEs endogenously generated in the gastrointestinal system, differ in concentration in breath for the two groups under study? A simple transportation scheme of elevation of PPA and its derivatives in the patients' bloodstream with their further release via breath is proposed and described in Supplementary Materials (Figure S2).
The scheme starts functioning after PPA and PPAE (generated by bacteria in the gut) penetrate the gut-blood barrier (GBB). The scheme connects then the gut, the brain that has enhanced permeability of the blood–brain barrier (BBB) for the CP case, and the lungs where PPAEs become extracted from the bloodstream. The disease case implies the second open channel for PPA/PPAE through the brain that increases its total amount in the exhaled air. It has previously been demonstrated that the PPA metabolism is linked to inflammatory bowel diseases [28] and could relate to neurological diseases [29]. The former is not surprising, as PPA is generated in the gut, but the latter should be clarified. PPA generated in the gut and stored in areas of damage within the brain's white matter [30] can proof two realistic scenarios. The first scenario implies high PPA and PPAE production in the gut, with the background of normal permeability of BBB and GBB in the case of CP. Crohn's disease is an example of a bowel disease and is hence attributed to the first scenario. Data collected for the diseased group in frame of our study, do not support this scenario. The second scenario implies the opposite situation: high permeability of BBB and GBB in the case of CP in the background of normal PPA production. This scenario needs a more sophisticated proof that also includes the step necessary for proving the first scenario.
An alternative transportation model that directly connects gastrointestinal system and mouth through the esophagus for further exhalation of gaseous bacteria products, looks unrealistic. Two arguments do not support this model: (a) the upper esophageal sphincter does not allow gaseous products of the gut to use this way and (b) it supports only the first scenario that, based on our preliminary data, is not correct for patients with CP.
Let us now review the results of another research group conducted morphological analysis in the CP case. In a recent study [30], a postmortem brain biopsy was analyzed by using mass spectrometry and nuclear magnetic resonance spectroscopy. A set of metabolites revealed by both techniques, contains PPA as the second most frequent specific metabolite on the list. The total accuracy approached 90% and, in comparison to our study, it is worth noting that a biopsy remains the gold standard for most of the diseases.
In this study, we demonstrate an almost closed loop of a diagnostic research. By a closed loop we mean three achievements that have been obtained here: (a) the high-score differentiation of the diseased (mostly CP) and healthy groups; (b) the identification of high-probable molecular candidates as potential biomarkers of the disease; (c) the transportation scheme that has been proposed for an explanation of elevated concentration of PPAE in breath of CP patients. The closed loop will include tests on a larger data set (the fourth achievement) and the analysis of a blind set of data containing healthy and CP cases, in order to divide it into two classes (the ultimate fifth achievement).
4 CONCLUSION AND NEXT STEPS
It has been shown that breath carries significant quantitative information about cerebral palsy. Supervised statistical analyses performed in the spectral range of two PPAEs revealed in breath, resulted in 91% accuracy in distinguishing healthy from diseased groups. This finding is consistent with a recent result of the postmortem brain study. The scheme, based on the generation and transportation of PPA and PPAE molecules was proposed, showing a link between the brain status and exhaled air.
The results presented here call for additional studies, mostly focused on (a) new specific VOCS, (b) larger statistics and, in case of success, (c) infants with CP. Should the results be successful in terms of accuracy, several practical steps could be considered. For example, the breath collection could be recommended for underweight newborns having high risk of CP. In this case, the elevated PPAE content in the collected sample would be able to give the first hint about any abnormal neurological state of a newborn.
5 METHODS
5.1 The spectroscopic and breath collection techniques
The instrument and its performance for real breath samples are described in refs. [13, 14], and we therefore only present its key parameters here. We used a Fourier spectrometer Bruker Vertex 70 operating in a spectral range of 500-4000 cm−1 in conjunction with a 4 meter 2 liter “White cell” (Bruker) that collects breath for the measurement, and a liquid nitrogen cooled MCT detector. The cell allows for variable total path length at the same volume and large separation of the input and output beams. The latter is critical for the spectrometer that we used. At the highest achievable sensitivity of the detector necessary for detecting PPAE, the baseline demonstrated nonlinear distortion corrected by home-made software. For all measurements, 0.5 cm−1 spectral resolution was used. The sensitivity of the spectrometer achieved 10 ppb for VOCs lying in the range of moderate water absorption, including the range of our main interest 1185-1215 cm−1 [13]. For that, PPAE was measured for different concentrations in the presence of dry nitrogen. A breath sample comes from a Tedlar bag into the cell via a gas system containing a water condenser that suppresses the amount of water by a factor of 2500. The accuracy of the measurement system is ±2.5%. All measurements were taken in one clean room at the temperature of +20°C and humidity between 40% and 60%. Single-use Tedlar bags were used for both groups of individuals under study. Sample collections had been made in two clean rooms, one for the healthy group and another for patients with CP. In order to check the influence of conditions in the rooms on the resulting absorption spectra, we collected breath of a healthy person in both rooms. In the spectral range of our main interest, we did not find any noticeable difference.
5.2 The molecular identification
First, it should be stated that the molecular identification is a high probability guess based on the fitting procedure, and there is no a standard operating procedure for that. During the initial step of the fitting procedure, we checked a coincidence of the maxima in the experimental spectral features shown in Figure 1, with those of breath VOC candidates taken from a compendium [27] by using free NIST Chemistry WebBook [31]. The degree of fitting was checked qualitatively via visual inspection and quantitatively by using the least mean square algorithm. The compendium contains more than 800 VOCs detected by mass spectrometry, whereas the NIST database contains at least hundreds of mid-infrared spectra of organic molecules. Unfortunately, the NIST spectra are not available in a digital form, preventing the comparison with an accuracy better than 5 cm−1. The next step of the identification contained two comparisons. For the first comparison, six best candidates chosen from the initial step were purchased (Aldrich) and measured by using our spectrometer with the same resolution and other conditions that we used for detecting breath samples. In terms of the spectral positions of the absorption maxima, three of them demonstrated the deviation from the breath data within 0.2%, helping thus to make the choice. For the second comparison, another free spectral database [32] was used, where in addition to the printed spectra (in analog form), the positions of the main absorption maxima were presented in digital form.
For the identification of the PPAE vibration linked to the peak at 1190 cm−1, numerical simulation for the equilibrium structure of the molecule has been performed, based on the density functional theory with the Perdew-Burke-Ernzerho functional using Gaussian 09 computational chemistry software [33-35].
5.3 Data analysis
For a visual inspection of the absorption spectra, we used Matlab that allows for the manual correction of the baseline distortions caused by the liquid-nitrogen detector at high amplification. The visual inspection identified the spectral range of the most significant variations between the groups, namely 1180-1215 cm−1. The range was used for all statistical data analyses.
For statistical data analysis we used two techniques. One included PCA in combination with ANOVA allowing for quantitative conclusions about the data clustering. This technique did not allow to reveal either spectral features of the main interest, or the corresponding molecules. The analysis used a code written in Mathematica (version 12). Another technique included Plot box available in Matlab (R2017b) allowed for quantitative conclusions about the data from visual inspections of the spectra. The statistical data were then presented as a function of the concentrations of the corresponding spectral features (after their identification), with the error bars and median values. We found that two learning algorithms, namely Random Forest and Support Vector Machine provide reliable results for the case of input data taken from the visual inspection. They were used for calculating receiver operating characteristic curves (ROC) and area under them (AUC). The performance was assessed via the LOOCV that, in addition, preserves the information about individuals (anonymously) and shows the separation probability of the two groups. The latter procedure allowed us to generate the confusion matrix that provides information about the sensitivity, specificity and accuracy.
5.4 Ethical documents
For the participants with CP, all the experimental procedures were approved by the ethics committee of the Faculty of Medicine at the Technical University of Munich (TUM), with the corresponding number 177/18S. Measurements of healthy participants and publication of the related results were allowed by the ethics committee of the Ludwig Maximilian University (LMU). The samples and data from the patients were received from MRI.
5.5 A description of the patients and the reference group
Table 1 represents the information about two groups under study. The diseased group of 14 volunteers contained patients with movement disorder, 12 of them with CP. A patient marked with MD in the Table and in Figure 2 has muscular dystrophy and a patient marked with ES has extrapyramidal movement disorder.
| Participant | Total number | Mean age | SD | GMFCS level | Diet | Smokers | |||||
|---|---|---|---|---|---|---|---|---|---|---|---|
| Male | Female | ||||||||||
| II | III | IV | II | III | IV | ||||||
| Patients (CP and other movement disorders) | 14 (12 CP, 1 MD, 1 ES) | 37 | 11.1 | 1 | 2 | 5 (1 MD) | 1 | 1 | 4 (1 ES) | Same | 1 (MD) |
| Healthy | 14 | 43 | 14.3 | 8 | 6 | Normal | 2 | ||||
- Note: Gross Motor Function Classification System distinguishes a patient's degree of self-initiated movement abilities, and varies from level I (easy) to level IV (difficult).
- Abbreviations: ES, extrapyramidal disorder symptoms; GMFCS, gross motor function classification system; MD, muscular dystrophy; SD, standard deviation of age.
Details about the data collection from the diseased group: participation in the study was voluntary. All the participants were informed about the test aim and technical details of sampling through normal breathing. They directly or via their legal protectors gave their written informed consent before the sample collection. The patients were living and working in a center for handicapped persons and all have the same daily routine. The sample collection was done in a clean room, known to patients, which has access to fresh air. The former fact and the patients' supervision of the clinicians working with them for years, provided a stress-free sample collection procedure. The sample collection was conducted in the 2 hours following breakfast. The sample measurements were started 1 hour thereafter, after the samples were transported to the measurement laboratory.
Healthy participants prior to the study were informed about the aim of the test and instructed about the details of normal breathing. All of them gave their written informed consent before the sample collection. The participants were chosen based on our previous results [14], in order to properly match the diseased group. We found that a smoking habit as well as high methane emission in breath of all the volunteers [14] do not affect the data in the spectral range shown in Figure 1.
ACKNOWLEDGMENTS
We are thankful to E. Fill for his valuable help with statistical data analysis. We would also like to thank the volunteers at MFZ for their time and support of this study. RL and SR would like to thank Buhl-Strohmaier Foundation, Würth Foundation and Klaus Tschira Foundation for financial support.
CONFLICT OF INTEREST
The authors declare that there is no conflict of interest regarding the publication of this article.
Open Research
DATA AVAILABILITY STATEMENT
The data that support the findings of this study are available from the corresponding author upon reasonable request.
