
Hyperspectral characterization of re-epithelialization in an in vitro wound model
Abstract
In vitro wound models are useful for research on wound re-epithelialization. Hyperspectral imaging represents a non-destructive alternative to histology analysis for detection of re-epithelialization. This study aims to characterize the main optical behavior of a wound model in order to enable development of detection algorithms. K-Means clustering and agglomerative analysis were used to group spatial regions based on the spectral behavior, and an inverse photon transport model was used to explain differences in optical properties. Six samples of the wound model were prepared from human tissue and followed over 22 days. Re-epithelialization occurred at a mean rate of 0.24 mm2/day after day 8 to 10. Suppression of wound spectral features was the main feature characterizing re-epithelialized and intact tissue. Modeling the photon transport through a diffuse layer placed on top of wound tissue properties reproduced the spectral behavior. The missing top layer represented by wounds is thus optically detectable using hyperspectral imaging.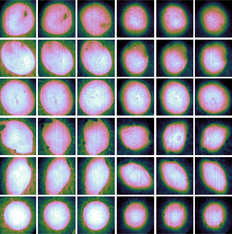
1 INTRODUCTION
Standardized in vitro wound models are useful for controlled investigation of re-epithelialization [1, 2], as systematic research on in vivo wounds is otherwise ethically challenging to carry out. Samples are typically subjected to destructive histology analysis in order to evaluate re-epithelialization, which makes it difficult to follow the same sample over time. Optical techniques like hyperspectral imaging could provide a non-destructive and non-contact alternative.
A spectral dimension that enables spectroscopy, combined with a high spatial resolution suitable for imaging of heterogeneous structures makes hyperspectral imaging relevant for a wide range of biomedical applications [3]. Examples include wound imaging [3-11], burn wound imaging [9, 12], skin bruises [13], cancer diagnostics and surgical guidance [3, 14]. The large amounts of data generated by the technique require methods for extracting relevant information. These methods should avoid subjective evaluation and be automatic in order to alleviate the effort in handling the data. The overall aim of this study is thus the development of automated analysis methods to enable use of hyperspectral imaging for in vitro wound applications. Histologies were not available for the current study, which somewhat limits the conclusions that may be drawn. The focus of the current paper is therefore on observations of the optical behavior in the available hyperspectral dataset.
Wound healing is a complex multistep process, which involves triggers and biological mechanisms that are fully outlined in Singer et al. [15] and Arnoux et al. [16]. Keratinocytes migrate into the wound from the surrounding tissue a few hours after the injury [15, 16]. The keratinocytes start generating new epidermal cells after 1 to 2 days [15]. The re-epithelialization happens simultaneously with a remodeling of the collagen matrix due to the migration of fibroblasts into the wound [15, 16].
The wound model used in this study is based on an in vitro model setup developed by Jansson et al. [17] and Kratz [2]. Their standardized model consists of circular 6 mm diameter samples of human breast tissue or abdominal tissue that are prepared with 3 mm diameter wounds using punch biopsy. These consistently re-epithelialize by day 7 when embedded in Dulbecco's Modified Eagle Medium (DMEM) containing 10% fetal calf serum (FCS) with streptomycin (50 U/mL) and penicillin (50 μg/mL) added [2, 17-22]. Both partial thickness wounds (epidermis + superficial dermis) [17, 18] and full thickness wounds (1-mm depth) [2, 19] re-epithelialize by day 7 under these conditions. Samples completely submerged in medium were found to be covered by a single cell layer of keratinocytes over the 7 days, which then started to stratify into a thicker epidermis [2]. Jansson et al. [17] showed that submerged wounds and samples with the wounds exposed to air had similar time-course of the re-epithelialization. Exposed wounds had migration of more than one cell layer and a neoepidermis more resembling a normal human epidermis by day 7 [17]. Samples of a submerged model are shown in Figure 1 for illustrational purposes. Here, the healing wounds are covered by keratinocytes after 7 days. Variations over this wound model in similar media have been studied, for example, 4 mm wounds in 12 mm skin samples (48% closure by day 4, 66% closure by day 16) [23] and 4 mm wounds in 6 mm skin samples (52% closure by day 7, above 80% closure by day 12) [24].

Some prior work on optical characterization of in vitro wound models exist. A similar wound model was characterized using fluorescence imaging by Wang et al. [23, 25] This study considered intrinsic fluorescence emission at excitation/emission wavelengths 335/390 nm (collagen) and 295/340 nm (tryptophan). This was done in order to investigate re-epithelialization by epidermal extinction of fluorescent collagen emission from dermis, and proliferation activity in the newly formed epidermis by tryptophan emission. The current study does not consider fluorescence, but reflectance from a normal light source in the visible range. However, mechanisms influencing the reflectance would be similar to the mechanisms influencing the lack of collagen fluorescence emission in the re-epithelialized regions. Randeberg et al. [26] did initial characterization of hyperspectral images of a previous iteration of the wound model used in this study. This initial analysis was limited to considerations using the cosine distance and sample spectra. The current study seeks to do more in-depth analysis using other statistical techniques and extend the analysis by inverse photon transport modeling. Finally, a 3D wound model constructed using collagen and keratinocytes was characterized using hyperspectral imaging by Wahabzada et al. [27]. This represents a different type of wound model, and mainly the fibroblast migration activity rather than re-epithelialization was correlated with the hyperspectral data. The current study uses similar cluster analysis to analyze the data.
A hyperspectral imaging setup typically acquires reflectance spectra, that is, the amount of light reflected and back-scattered off the imaged samples at different wavelengths. The ability of the hyperspectral system to sense changes in the wounds is dependent on the ability of these changes to influence the reflectance. The reflectance is determined by the optical properties of the tissue, which is typically modeled as a multilayer structure with absorption and scattering coefficients μa(λ) and μs(λ) in each layer [28-31].
The high spatial and spectral resolution of hyperspectral datasets requires special techniques to handle the large amounts of information. Common processing techniques for biomedical hyperspectral imaging in the literature include clustering analysis [5, 12, 27, 32-34], use of decomposition or dimensionality reduction methods [9, 32, 33] and supervised classification [10, 35-37]. Unsupervised cluster analysis is a first choice to group similar reflectance spectra. Such analysis serves to break apart the dataset and infer properties about wound, re-epithelialized and intact tissue over time, and discern the measurable optical differences of these tissues. Decomposition methods like Principal component analysis (PCA) can be used to investigate the spectral properties in a low-dimensional space. Supervised classification techniques are useful for building classification models to identify samples as wound or intact tissue based on training samples. Such methods yield classification rules that can be investigated and compared against the similarity-based unsupervised analysis results.
In this paper, all these techniques are in combination used to infer the properties of the different types of tissue over time. This is valuable as a part of exploratory data analysis. However, understanding the clustering or classification is important for understanding their general applicability. Explanations are not readily offered up by these statistical methods alone. Photon transport modeling serves as a tool to understand the physics and relate the statistical results and measurable responses in reflectance back to changes in scattering and absorption, and finally changes in skin constitution. The main feature separating wound from re-epithelialized or intact tissue is missing upper layers. These layers are therefore of special interest for characterization of re-epithelialization.
For a semi-infinite, one-layered model, it can be argued that the reflectance can be written as a function of μa/μs [38]. The same is valid for the semi-infinite layer of an N-layer model. This means that such a model is uniquely defined only down to ratios between the absorption and scattering coefficients of the semi-infinite layer. It is desired to see whether re-epithelialized tissue can be explained by some absorbing and scattering layer added on top of a model representing the optical properties of wound. This can be done without having to completely inverse-model the wound, by exploiting the scale-invariance of the reflectance model.
The combination of statistical methods and photon transport modeling serves to make hyperspectral imaging a promising non-destructive technique for characterization of in vitro wound models. In Section 2, sample preparation and the image acquisition procedure are outlined. The PCA method, proposed clustering method and supervised classification methods used for exploration of the dataset, and the inverse modeling method, are given in Section 3. Results of the clustering and the investigation using PCA and inverse photon transport modeling are then given in Section 4.
2 MODEL PREPARATION AND DATA ACQUISITION
Reflectance data were acquired using a push-broom Hyspex VNIR-1600 hyperspectral camera (Norsk Elektro Optikk, Lillestrom, Norway). The images were acquired over the wavelength range 400 to 1000 nm, with a spectral resolution of 3.7 nm. The pixel size on the sample surface was approximately 24 × 24 μm. The camera system acquires one line of the image at a time with an acquisition time of 7.5 ms per line. A full image was acquired by moving the samples under the camera on a translation stage. Raw images containing three wells and a reflectance standard consisted of 6300 image lines, resulting in a total acquisition time of approximately 47 seconds. A tissue sample with diameter 8 mm would have an individual acquisition time of 2.5 seconds.
The reflectance data were acquired with illumination from two linear light sources (Model 2900 Tungsten Halogen, Illumination Technologies, New York). Polarizers (VLR-100 NIR, 450-1100 nm, Meadowlark Optics, Frederick, Colorado) were mounted on the camera lens and the light sources in order to avoid specular reflection. A Spectralon reflectance target (WS-1-SL, Ocean Optics, Duiven, Netherlands) was included within each image.
The samples were prepared from human abdominal skin collected from a single donor during plastic surgery. The project was approved by the regional ethical committee (REK-Midt-Norge), and informed consent was obtained from the donor.
Six samples of the wound model and two tissue samples without wounds were prepared, all with total sample diameter of 8 mm. Wounds were cut into the tissue using 3 mm punch biopsy on three of the samples, and 4 mm punch biopsy on the other three samples. Wounded tissue was lifted using suction for the former three samples, and a cannula for the latter three samples, and cut using scissors. Final samples were cut out from the donor tissue using 8 mm punch biopsy. Due to heterogeneity resulting from the sample preparation, the 3 mm wounds are not circular and do not strictly have 3 mm diameter. For simplicity, these are still referred to as 3 mm wounds.
The samples were placed in separate wells, on metallic grids in order to avoid submersion of the samples. The wells were filled with Dulbecco's Modified Eagle Medium (Gibco), with fetal calf serum (10%), penicillin (50 μg/mL), streptomycin (50 U/mL) and glutamine added. The medium was changed after each imaging session. For more details on the wound preparation, see Haneberg [39].
The samples were followed up over a period of 22 days. Images were acquired at day 1, 2 and then every other day, yielding a total of 12 measurements for every sample. RGB images over all samples are shown in Figure 2, along with labels used in this paper. RGB images are shown at the start, mid and end of the measurement period in order to give an overview over the available data. The samples were sorted in two trays (tray I and III) and inherited the same labeling as the trays for convenience. The samples with label III_* correspond to 4 mm biopsy wounds, while samples with label I_* correspond to 3 mm biopsy wounds. One each of the samples without wounds were sorted along with the 4 mm and 3 mm wounds, respectively. The intact samples were included in order to evaluate shrinking. These are not considered throughout the rest of this paper.

The raw spectra were converted to reflectance, and the images were subset to regions with size 600 × 600 pixels centered on each sample. The tissue samples were segmented from the background using a random forest classifier, which has been tested for this purpose in a previous study [40]. The classifier was trained on manually labeled regions from sample I_5 at days 1, 16 and 22. Manually selected regions containing both wound and intact tissue were labeled as 'tissue', and non-tissue regions as 'background'.
3 PROCESSING METHODS
3.1 Principal component analysis
PCA decomposes a dataset of size N observations × p features in terms of p orthonormal components (loadings), which transform each mean-subtracted observation into new variance-maximizing coordinates (scores) by a linear combination between the components and the original features [41].
This method is used for dimensionality reduction before clustering and for inference of important spectral features in the wound model. In total, three main PCA models will be constructed throughout this paper:
• As a pre-processing method in order to reduce the dataset before clustering, one PCA model for each trained clustering model.
• For investigation of spectral features of the samples and corroboration of the clustering results. This model was trained on wound and intact tissue at days 1, 2, 6, 12 and 22 across all samples.
• For summarizing the temporal-spatial developments within the wounds. This model was trained on wound spectra only, across all measurement times and samples.
3.2 Unsupervised clustering analysis
K-means clustering was used to cluster the pre-processed data using a high number of clusters (K = 25). The single linkage distance was found between each possible pair of clusters, that is, the distance between the two closest points of each pair. The distances between cluster i and all possible clusters j were organized in a 25 × 25 distance matrix and subjected to agglomerative analysis, in order to combine the 25 clusters down to two spectrally distinct clusters.
A clustering model was trained for each single sample across all measurement time points, as illustrated in Figure 3. The use of K-Means as the core method enables classification of unseen data. Each trained clustering model could therefore be used to classify all other samples according to its cluster definitions. This was done in order to reduce computational requirements, investigate the stability of the approach by varying the subjected dataset, and finally increase the robustness by combining the assigned clusters through a majority vote.

The images were found to have level variations in the obtained spectra due to changes in illumination. The clustering was found to yield clusters corresponding to different illumination conditions rather than spectral changes unless the level changes were properly suppressed. Spectral derivatives have earlier been used in spectroscopy [42] and hyperspectral imaging [43-47] as a preprocessing technique to better target interesting spectral features rather than level or illumination variations. The first order spectral derivative of a reflectance spectrum y(λ) is given as  . For simplicity, the derivatives throughout the paper are taken with respect to the band index rather than the wavelength λ.
Smooth numerical estimates of the derivatives can be obtained by Savitzky-Golay filtering [48]. The filter essentially fits polynomial functions to the data in a sliding-window fashion, which can be efficiently implemented as a convolution operation. Third degree polynomials and a window length of 21 were used in the filter. These parameters were by visual inspection found to yield smooth enough spectra (low variance) without smoothing over important spectral features (low bias). The derivative filter was followed by a PCA transform in order to reduce the dimensionality of the data, before clustering finally was applied.
3.3 Supervised classification
A random forest classifier [49, 50] is used as a standard classification method, as it is simple and sufficiently robust without needing special pre-processing treatments, parameter tuning or many assumptions on the data [49-53]. The classification method can in addition compute feature importances, and show which wavelengths are used the most during classification, which is valuable for further exploration of the data.
The classification model was trained on examples of wound and intact skin from a single wound model sample across all measurement times, and its wound boundaries were compared against the boundaries obtained from the clustering analysis. The method was trained and compared on the reflectance spectra and the first and second derivatives of the spectra.
3.4 Inverse photon transport modeling
It is desired to investigate whether the optical properties of apparently re-epithelialized tissue can be explained by the optical properties of wound with some extra layer on top that represents epithelium. This is done in order to strengthen the findings of the statistical analysis.
The scale-invariance of the one-layer model enables the wound to be represented by any μa and μs which obey the given ratio that reproduces the wound reflectance. Inserting these properties into the semi-infinite layer of a two-layer model lets the boundary conditions of the upper layer be the same as they would be against some arbitrary multilayer model representing wound. This then enables investigation of an upper layer without having knowledge of the constituent layers of the wound tissue.
- Pick a wound reflectance spectrum.
- Use a semi-infinite, one-layer model to estimate μa/μs.
- Assume some μs, reuse μa, μs in a two-layer model to reproduce the correct boundary conditions between the first and second layers of the two-layer model.
- Find the properties of the first layer by minimization of
 .
.
The properties of the first layer will not be unique. The approach is mainly used to show that some diffuse layer with the correct ratios can be added on top of the wound tissue properties to yield the reflectance from re-epithelialized tissue. The basic geometry of the approach is shown in Figure 4.

4 RESULTS AND DISCUSSION
The clustering model is first presented and established in Section 4.1 by use of RGB images, principal component analysis and supervised analysis. The apparent clustering rules are investigated in Section 4.2 using an inverse photon transport model to characterize optical properties. The temporal development in optical properties of the samples is characterized in Section 4.3. The main results are finally summarized and discussed in Sections 4.4 and 4.5.
4.1 Establishing a spectral clustering model
4.1.1 Comparison of clustering results and RGB images
In lieu of histologies and until a spectral behavior has been established, visual indicators of re-epithelialization must first be established. Close-ups of the RGB images for days 2 and 22 for sample III_5 are shown in Figure 5, with the original wound boundary indicated with arrows in both figures. The general behavior was visually similar for the other samples.

For day 2, the outline of the wound is indicated by a transition from a brown to a pink area. The same outline can be observed in day 22, but now as a darker brown line which divides two similarly brown areas. This brown area gradually transitions to a pink area. Clear pink areas are assumed to correspond to non-healed wound tissue, brown areas within the darker outline are assumed to be tissue which has undergone re-epithelialization, while skin outside the darker outline is intact tissue. This establishes: (1) the sample has likely partially re-epithelialized, with a new apparent wound boundary well within the original wound boundary, and (2) some basic markers for verifying, for example, a clustering model by visual inspection. It can be seen here that the old wound boundary at day 22 has similar extent as the original wound boundary, indicating that there has been no or minimal wound contraction.
Boundaries obtained from each clustering model as applied to sample III_5 are shown in Figure 6. Most of the clustering models agree on a given boundary across the various samples. The disagreement is somewhat larger at day 1. Mean distance between the majority vote boundary and the boundaries of the respective clusters is 3.94 pixels at day 1 (standard deviation (SD) 9.97 pixels), and 1.62 pixels at day 2 to 22 (SD 2.46 pixels) across all wound model samples. Corresponding statistics for the shown sample (III_5) are 2.34 pixels (SD 3.51 pixels) for day 1 and 1.22 pixels (SD 1.52 pixels) for day 2 to 22. Increases in both mean and SD at day 1 demonstrate a higher uncertainty in the boundary. There are indications of somewhat lower boundary deviations at day 8 to 14 (mean 1.36 pixels, SD 1.93 pixels) which increase back to day 2 to 6 levels towards day 22. This is visually consistent with the behavior illustrated for sample III_5 in Figure 6, where a single cluster model boundary encompasses a larger area than the rest of the boundaries at day 22 but stays consistent with the rest of the boundaries at day 6 and 12.

Across all samples, all models generally agree on a cluster boundary well within the marks indicating the original wound boundary, except for the first day, and most of the boundaries encompass regions that can be established by visual inspection to be the wound. The regions within boundaries represented by this cluster are therefore likely to correspond to non-reepithelialized wound tissue.
For the shown sample (III_5), the region encompassed by the boundary is smaller than the expected size of the wound at day 1. The region size increases towards day 8. This it at odds with the expected wound development. Inspection of the left-out regions reveals brown spots present only in the intact skin regions, and a separate clustering run on day 1 gave only minor differences to the cluster boundary. The left-out regions are probably thus an artifact from the wound preparation, where there has been removal of dermal tissue with some epidermal tissue remaining.
The majority vote cluster size as a function of day is shown in Figure 7 for all samples. All samples have an increase in the apparent wound region from day 1 to day 2. One sample (III_5) has a clear increase in wound size over the first 8 days, while two (I_3 and I_4) decrease in size from day 2 and on. The remaining samples (I_5, III_4 and III_2) have a stabilization or slight decrease in wound size until day 6 (I_5) or 8 (III_4 and III_2). Mean surface coverage among all samples, with respect to the maximum size of each combined wound cluster region, is 22% (SD 6%) at day 14, and 36% (SD 6%) at day 22. Mean surface coverage rate is 0.24 mm2/day (SD 0.06).

4.1.2 Spectral behavior over the cluster boundary at day 22
In Figure 8, reflectance spectra are plotted across the cluster boundary. The trends were found to be the same for all samples, and only sample III_2 is shown for brevity. The main trend which can be observed here is that the spectra are skewed as the pixels transition from wound into intact skin. The reflectance spectra at 600 nm and up have slopes that descend within the wound, while re-epithelialized and intact tissue spectra ascend. Similarly, the reflectance below 500 nm is higher for the wound and lowered for re-epithelialized and intact skin. The cluster boundary seems to set a threshold for when such suppression leads to a pixel being clustered with intact skin rather than wound tissue.

Mean increase at day 22 in the spectral derivative at 650 nm from within each wound cluster to a 25 pixel wide ring outside the wound cluster was found to be 0.0016 (SD 0.0002) across the various samples, and 0.0014 for the shown sample (III_2). Mean over spectral derivatives at the same wavelength inside all wound clusters at day 22 was 0.0001 (SD 0.0008), and 0.0018 (SD 0.0008) in the 25 pixel wide ring outside.
4.1.3 Comparison of clustering results and PCA
PCA was run in order to generalize the correspondence between clustered regions and the spectral features noted above.
The loading plots are shown in Figure 9, while scores of sample III_5 at days 1, 2, 6, 12 and 22 are shown in Figure 10. All samples showed similar temporal development. Scores for all samples at day 22 are shown in Figure 11. The derivative PCA model showed the best separation between the spatial features of its two components, and for brevity, scores from only this model are shown. The reflectance scores of component 1 showed a mixture of the behavior of component 1 and 2 of the derivatives, while the reflectance scores of component 2 mainly corresponded to component 2 of the derivative model.


The second component of the reflectance PCA model has an overall steep, negative sloping across the entire spectral range, some of which is correspondingly reflected in the second component of the derivative PCA model above 600 nm. Scores of the second component represent these spectral features. Derivative component 1 has a large amplitude from around 540 to 600 nm, with a zero-crossing at around 560 nm corresponding to the minimum at the reflectance loadings at the same wavelength. This component therefore summarizes mainly the behavior responsible for this minimum.
According to the spatial features of component 1, the clustering boundary does not match what could seem to be the real wound boundary at day 1 and 2 for the shown sample in Figure 10 (sample III_5). However, component 2 shows a tight fit around within-wound textures and characteristic values that are not present outside the cluster boundary. The cluster boundary would therefore seem to have separated two distinct spectral behaviors, where the inner region is represented by the right combination of component 1 and component 2. This was visually consistent for the other samples as demonstrated at day 22 in Figure 11.
Thus, the clustering represents a collection of the spectra that have steep, negative slopes, combined with a significant presence of an absorption maximum at 560 nm, in line with the spectra plotted over the boundary in the previous section. Single-pixel spectra (not shown) confirm the trend indicated by the PCA model.
The use of PCA as a data exploratory technique is usually subject to whether its maximization of the variance can reveal useful information. This seems to be the case for this dataset, though changes to illumination conditions or changes to the dataset selection could change the resulting PCA loadings and their order. The PCA decomposition will not represent a perfect decomposition of the data. There will be discrepancies due to the optical features not being linearly separable. However, the general spectral behavior can be inferred.
4.1.4 Comparison between clustering results and a supervised classification model
A random forest classifier was trained on the derivative spectra from manually labeled pixels well within and outside the wounds, as per a visual inspection of the RGB images. The wound boundary results are shown for sample III_5 in Figure 12. The mean accuracy of the classification results with respect to the clustering boundary was 98% (SD 1%) for sample III_5, and 97% (SD 2%) for all samples. The boundaries obtained here are similar to the boundaries obtained from the clustering. Thus, the unsupervised clustering results are reproduced when training a supervised model on examples of wound and intact skin, partially confirming the soundness of the unsupervised approach for these data.

The applied classification method, random forest, has the possibility to reveal what features are used for decision making by investigating the feature importances. These are shown in Figure 13. For raw reflectance, the behavior between 400 and 500 nm is used the most, while derivatives result in utilization of the slopes at 520 and 650 nm. For second derivatives, the turning points of the reflectance at 500, 560 and 600 nm are used.

4.2 Investigation of the re-epithelialization influence by inverse modeling
An intact epidermis has absorption and scattering spectra that can be described by exponentially decaying models. The properties of such an epidermal layer were fitted to a region representing re-epithelialized tissue after using a wound spectrum as a basis, in order to check whether it could fully explain the transition from wound to apparently re-epithelialized regions. The result is shown in Figure 14 for sample III_5 at day 22.

The simulated spectrum shows a remarkably good fit against the measured spectrum between 400 and 700 nm. Some discrepancies are evident above 700 nm, indicating that some minor changes to the scattering in dermis would be needed for a perfect fit across the entire spectral range. Due to coupling between the epidermal parameters, the fitted properties are not unique. Regardless, they demonstrate that the region between wound and intact tissue has a reflectance spectrum which can be explained by the addition of some diffuse layer on top of a dermal layer with properties obtained from the wound tissue.
This then shows that this region likely has re-epithelialized, and that there are no other chromophores involved in dermis other than those already seen in the wound. The apparent absorption minimum towards 400 nm for re-epithelialized tissue, for example, is only due to epidermal suppression. The dermal composition of chromophores seems to be the same. The absorption peak at 561 nm is just as strongly present in the wound spectrum as in the re-epithelialized spectrum, but suppressed by the added epidermis. Gradually altering the thickness of the layer or the absorption and scattering magnitudes would thus transition the spectrum representing wound into something more or less indistinguishable from intact skin. The increased positive sloping and suppression of spectral features observed earlier is then fully explained by the addition of this diffuse layer.
The strong, unsuppressed presence of the minimum at 561 nm thus serves as a wound marker favored by the random forest as applied to second derivative spectra. Slopes between 600 and 700 nm likely are more robust, however, due to the changes the tissues undergo during the first days below 600 nm, as will be shown during the next sections. This is reflected in the PCA components shown in Section 4.1.3. Component 1 corresponds to the unsuppressed minimum at 561 nm, but the sloping between 600 and 700 nm partially represented by component 2 decides the tightening of the cluster boundary. The latter is likely more sensitive to the epidermal presence than just the suppression of the minimum at 561 nm. A thin epidermis would suppress the minimum some, but has a larger influence on the slope between 600 and 700 nm. Likely due to illumination differences leading to level changes in reflectance, reflectance classification favors the level at 400 to 500 nm which is significantly suppressed by epidermis due to the high absorption and scattering here.
4.3 Characterization of the temporal development in optical properties
4.3.1 Mean wound spectra across all times
In Figure 15, mean reflectance spectra from the wounds are plotted. These have different overall heights, but the same spectral characteristics at a given day are clearly evident across samples.

The spectral shapes change systematically from day to day. On day 1, all spectra slope upwards from 400 to 500 nm. This slope changes gradually until day 4, where it stabilizes to a flat, slightly curved appearance. All samples seem to have the same absorption peak at 561 nm after the stabilization. Most of the samples have the same absorption peak at the first day, while others show a flatter spectrum at 500 to 600 nm.
Comparing against a reflectance spectrum obtained from the medium, see Figure 16, it can be seen that the absorption peak at 561 nm corresponds well with the main absorption peak in the medium spectrum. The medium spectrum also has slopes in the reflectance which seem to correspond with the slopes of the wound reflectance, except that they are wavelength-shifted with respect to each other. However, since these are slopes and not actual absorption peaks, they could easily be shifted by changes in absorption and scattering spectra. The wounds would seem to obtain the same spectral characteristics as the medium over time. The medium feeds the skin tissue, enabling re-epithelialization, which means that the medium necessarily infuses the tissue. It stands to reason that the skin should obtain similar spectral features as the medium. This is likely difficult to verify, however. Intact skin undergoes similar changes as wound, but not as strongly pronounced. An early theory was that the changes could be due to changes in cytochromes, but no specific evidence has been found for this.

4.3.2 Wound decomposition by PCA across all times
The wound spectra were decomposed using PCA in order to infer spatial variations that are averaged away by taking the mean. Taking PCA of the wound reflectance was found to mainly show spatial variations within the wound, while taking PCA of higher order derivatives yielded components apparently corresponding to the noted developments above. Only PCA of the second derivatives is shown. Loading vectors are shown in Figure 17, while scores of the two first components are shown in Figure 18.


The first loading vector has a large amplitude at 561 nm, corresponding to the high and positive curvature of the reflectance here. The first component therefore describes the influence of the minimum here. The mean second derivative spectrum already had contributions from the minimum, and negative PCA scores thus express suppression of this, while scores close to zero and above express presence. The corresponding component 1 scores in Figure 18 show an inhomogeneous distribution across the first day (two-peaked distribution with peaks at −0.0050 and −0.0023, mean PCA score −0.0034, SD 0.0014), which changes to a largely homogeneous distribution over the entire wound at day 2 (single-peaked distribution with peak at 0.0016, mean PCA score 0.0011, SD 0.0011). This partially explains the behavior seen in the mean spectra in Figure 15, where some samples (sample III_2, I_3, I_4 and I_5, mean PCA score −0.0030, SD 0.0013) apparently had more contributions from the minimum at 561 nm than others (sample III_4 and III_5, mean PCA score −0.0043, SD 0.0010) at the first day. This contribution homogenizes and becomes stronger from day 1 to day 2 (mean PCA score and SD 0.0011, 0.0011 for sample III_2, I_2, I_3, I_4 and I_5, 0.0010, 0.0009 for III_4 and III_5) in Figure 15.
Some of the wound spectra have demonstrated a “flatness” around 540 to 580 nm at day 1, illustrated in Figure 16. This behavior, and the further decrease in absorption close to 400 nm, likely correspond to component 2 of the PCA model. The positions of the maxima and minima and corresponding curvature in the day 1 wound reflectance spectrum in Figure 16 indicate this. PCA component 2 has a drop from day 2 (mean PCA score 0.0009, SD 0.0007) to day 4 (mean PCA score 0.0000, SD 0.0006). There are indications in the score images for component 2 in Figure 18 that the scores are further reduced for some samples until day 8.
Thus, there is a temporal development of the optical properties which continues until day 8 for some of the samples. With respect to this, day 1 is a spectral outlier.
4.4 Summary and discussion of the main clustering results
A clustering of the data helps in separating important spectrally distinct regions from each other and simplifies further analysis. Inspection of spectra from selected regions and a PCA decomposition demonstrates that the clustering is consistent in separating two main spectral behaviors from each other. The results were compared against wound boundaries obtained from supervised analysis and visual inspection of RGB images, which demonstrate that the two clusters correspond to wound and regions with some epidermis intact. Inverse photon transport modeling further confirms the found spectral trends.
A combination of K-Means and agglomerative clustering was used as the main technique. Cluster membership in K-Means is determined by closest distance to the cluster centers. The technique is therefore naturally extendable to classification of unseen data. This enables training on different samples and subsequent combination of the clustering results. However, the same property means that the clusters optimally should be spherical in the image space. Investigation in a lower-dimensional PCA space would reveal that the structures to be clustered are elongated and twist throughout the image space. K-Means is therefore unlikely to reflect the inherent structure of the data by a number of clusters corresponding to the actual, few clusters. Agglomerative clustering is more suitable for such cases, but difficult to apply to large datasets and does not readily extrapolate to new data. As the best of two worlds, agglomerative analysis was therefore successfully used as a technique to combine the too-high number of clusters obtained from the K-Means analysis.
Clustering methods are in general difficult to verify. They are highly subject to preprocessing treatments, choice of distance metrics and subjective evaluations [41]. It is still possible to check the stability of such approaches by varying the data subjected to clustering [41]. Separate clustering models were therefore trained on each wound model sample. Splitting across samples was found to be the most natural way to split the data. Training across all measurement times enables the method to generalize across changes in the reflectance of the samples during the first 4 to 8 days. Finally, application to a single sample avoids merging of characteristics of several wounds into the same cluster. Merging of wound clusters instead happens more robustly with the majority vote. The data variation yielded apparently stable and consistent clusters across all samples and days.
The K-Means clusters were merged down to two clusters that overall seem to represent wound and re-epithelialized/intact tissue. Including a third cluster was found to be challenging, as it was difficult to retain consistency across all samples and measurement times. This is to be expected in light of the inverse modeling results. Different locations of and stages along the wound re-epithelialization process yield different re-epithelialized layer thicknesses. The layer gradually transforms the reflectance from wound to intact tissue reflectance. The main bulk is therefore best summarized by two clusters with some implicit threshold in spectral behavior.
Spatial features in the RGB images were used for verification of the hyperspectral clustering results. This means that the RGB bands technically are sufficient to identify similar degrees of re-epithelialization as in the hyperspectral results. The study on fluorescence emission by Wang et al. [23] also seems to indicate, judging from the figures, that there is a similar correspondence between the RGB images of their study, and the re-epithelialization indicated by their collagen fluorescence emission. The hyperspectral system used in the current study acquires images within the visible range. Band redundancy is expected, which is the reason why techniques like PCA are successful in compressing the information down to a few component bands. The RGB bands sample information at spaced intervals throughout most of the imaged wavelength range. Redundancy will cause features in the various bands to be present to a stronger or lesser degree in the RGB bands. Further, the identified photon transport mechanisms affecting the re-epithelialized tissue reflectance will have impact on the RGB bands. The contrast offered by the RGB images alone is weak, however, and re-epithelialized tissue is identifiable mainly when coupled with the hyperspectral analysis results. The spectral dimension is needed when investigating whether visually similar tissue parts should be included or not. There is also a possibility for detection of subtler changes, though the implicit threshold in the cluster analysis mainly corresponded with the visually observable features.
The end goal, a tool for identifying healing in in vitro wound models, does not necessarily require the full spectral dimension offered by hyperspectral imaging. There are indications that a multispectral system with fewer bands is feasible. These might not necessarily be the RGB bands, but other bands that offer better contrast between wound and re-epithelialized tissue. Initial studies using hyperspectral imaging are necessary for understanding the mechanisms affecting such bands, and for establishing a baseline for comparing such reduced systems. Further, classification models can be built based on single pixel spectra. This significantly eases the analysis for larger bulks of data. Classification based on RGB or other bands would require incorporation of spatial information and less intuitive approaches like convolutional neural networks. Hyperspectral imaging is then suitable as an initial research tool to be replaced by less expensive and tailored multispectral systems in the long run.
4.5 Summary and discussion of the physical interpretation of the results
A challenge with any hyperspectral dataset is the high amounts of data, and automatized and objective methods are required to extract the relevant information. This data exploratory study has gained an overview of the optical properties of the investigated in vitro wound model and showed possible ways detection algorithms could be built for automatic classification of unhealed wound tissue. The missing top layer of unhealed wounds is an important component of this.
Apparent re-epithelialized tissue regions have optical behavior that through inverse photon transport modeling has been shown to be consistent with the addition of a diffuse layer on top of the optical properties represented by wound tissue regions. The influence from the epidermal layer can be characterized by a skewing of reflectance slopes and suppression of the spectral features of the wound. Derivative spectra can thus provide illumination-insensitive and possibly donor-invariant features for classification. Re-epithelialization seems to be the main optically detectable feature, and other changes like migration of fibroblasts or remodeling of the collagen matrix are more subtle, undetectable or absent. Most studies on this type of wound model have focused mainly on re-epithelialization, and complete remodeling might not be expected outside some expression of collagenase [22].
The modeling approach is promising. The properties of re-epithelialized tissue can be probed without having to consider full photon transport modeling of the dermal tissue layers, by utilizing scale-invariance properties. Properties like thickness could be inferred, but this has to be investigated and verified further. However, knowing that some diffuse layer with finite thickness can explain the spectral differences of different tissue regions is sufficient for the conclusions in this paper.
The change in reflectance over time indicates a change in the optical properties of the tissues. The change has been established to be related to the spectra attaining the same spectral properties as the medium. This leads to a confusion in the analysis. Spectra representing wound for the later days are not necessarily similar to spectra representing wound for the first day, and the behavior results in some noise and discrepancy in the day 1 clustering. Despite this, the still-present sloping behavior due to epidermis has made the clustering rather consistent.
It has been established that the samples converge towards the same spectral behavior as the medium. What they start out with is not as clear. Possible explanations are absorption due to cytochromes, which in the absence of blood would have a pronounced effect on the reflectance, or absorption due to a residual blood content which is gradually replaced with medium.
The analysis shows that the wound is re-epithelialized from the edge and towards the center of the wound. Multiple cell layers are expected to migrate in this fashion and quickly develop into a mature epidermis when the samples are exposed to air [17], as opposed to the initial single layer of keratinocytes expected from submerged samples [2, 17]. Glinos et al. [54] (8 mm samples, 3 mm wound, DMEM, 10% FCS, air exposure) used optical coherence tomography to study re-epithelialization in a similar wound model, with a spatial resolution corresponding to the current hyperspectral study. More mature epithelium is shown to migrate over the wound with a small tip of non-cornified epidermis extending on the wound side of the epithelium. Wang et al. [23] (12 mm samples, 4 mm wound, DMEM, 10% FCS, air exposure) shows a correspondence between reduction of dermal collagen fluorescence at 390 nm and wound closure. Extinction here would require the newly formed epithelium to have similar absorption and scattering mechanisms as the intact epidermis. Thus, it is likely that the detected epithelium in the current study represents a more mature epidermis with multiple cell layers. Immature epidermis might be expected at the very edge of this. For example, Figure 5 indicates a more white-ish line extending on the wound side of the newly formed epithelium. This would be consistent in size with the findings of Glinos et al. [54], but has to be investigated further.
The found time development of the re-epithelialization is inconsistent with the expected development of the model. Epithelium is detected at the very edges of the wounds after day 8 to 10 for the 4 mm wounds, and day 3 to 8 for the 3 mm wounds. Mean surface coverage at day 22 is 36%. The 3 mm wounds should be fully covered (100% surface coverage) by epithelium already at day 7 [17]. The prepared wounds are heterogeneous in size, and two of the intended 3 mm sized wounds are closer to 4 mm in size. Available data on 4 mm wounds in the same type of medium indicates somewhat delayed wound coverage (48% closure by day 4 and 66% closure by day 16 [23], or around 50% closure by day 7 and around 80% closure by day 12 [24]), but still earlier and more complete epidermal coverage than what is observed in the current study.
The development in optical properties indicates that medium is diffused throughout the tissue. Delay in access to nutrients due to the need for diffusion of nutrients through the bottom layer could have delayed the re-epithelialization. However, submerged wounds and wounds exposed to air are expected to have similar time development [17]. Full exposure to air over the entire tissue surface [23, 55] or increased tissue sample size [23, 54, 55] does not seem to cause similar delays in other studies. The large number of consistent studies on 3 mm wounds in 6 mm tissue samples [2, 17-22] shows that there is little variation in re-epithelialization rate due to donor variability or donor tissue location. The tissue samples rested on a metallic grid, but it is unlikely that this should have any effect.
Histologies were not available for this particular dataset. Wound tissue is transformed into tissue reminiscent of intact tissue, and photon transport modeling shows that the spectral behavior is consistent with an epidermal layer placed on top of wound tissue. However, histological verification is necessary for final confirmation of these results. The fact that the time kinetics of the investigated samples seem far slower than expected makes comparison to existing studies challenging.
The experiment has to be repeated, preferably with histologies sampled at multiple time points during the course of the experiment. This calls for a high number of samples. Representativeness can be challenging due to heterogeneity from the wound preparation method. Eikebrokk et al. [1] developed a method for creating more reproduceable wounds. These were superficial wounds with the basal layer intact, which re-epithelialize and stratify into a mature epidermis more quickly. In addition to being more reproduceable, this could also be useful for investigating the optical influence of the various stages of layer stratification. This can be corroborated back to the results of the current study. These wounds behave somewhat differently, however, and wounds more similar to the the wounds in the current study should be included for verifying the mechanisms of the epidermal migration. For simplification, only a single wound size should be included.
A major difficulty identified in this study is the general change in optical properties over the period where re-epithelialization normally would be expected. Separating these from the re-epithelialization processes could be important when the experiment is repeated, especially if the normal time course of re-epithelialization is observed. Incubating some of the models in 2% FCS rather than 10% FCS leads to viable tissue with no re-epithelialization [2]. Such modifications could be used to evaluate optical changes without interference from re-epithelialization.
5 CONCLUSION AND FURTHER WORK
Optical techniques like hyperspectral imaging could provide an objective, non-destructive and non-contact alternative to histology analysis for evaluating re-epithelization in in vitro wound models. Appropriate analysis methods are required for extracting information about the wound coverage.
The different tissue types in the samples have been separated and investigated using clustering analysis. This analysis, along with corroborating techniques like supervised classification and PCA, significantly helped identifying and generalizing important spectral features. Intact tissue and apparently healing regions are characterized by a suppression of and increased sloping in spectral features that are present in the wound reflectance spectra. The use of a specially developed photon transport model has shown that this behavior can be explained by a diffuse layer of finite thickness placed on top of optical properties representing wounds, which is consistent with the expected re-epithelialization process.
The full characterization of the spatial and temporal behavior enables further development of classification and photon transport techniques that can be used to detect and characterize wound re-epithelialization processes. There is further a possibility that a multispectral system with fewer bands can be feasible for detection of re-epithelialization, which will be investigated in future work. Histologies were not available for this study, however, and the experiment has to be repeated for final confirmation of the found behavior.
ACKNOWLEDGMENTS
Thanks to Ingvild Haneberg and Matija Milanic for acquisition of the data. Thanks to Terje Schjelderup for help with the proofreading.
CONFLICT OF INTEREST
The authors have no conflicts of interest to disclose.