Imaging of fatty tumors: appearance of subcutaneous lipomas in optoacoustic images
Abstract
A wide variety of subcutaneous soft-tissue masses may be seen in clinical practice. Clinical examination based on palpation alone is often insufficient to identify the nature and exact origin of the mass, in which case imaging is necessary. We used handheld multispectral optoacoustic imaging technology (MSOT) in a proof-of-principle study to image superficial fatty tumors and compare the images with diagnostic ultrasound. Fatty tumors were clearly visualized by MSOT and exhibited a spectral signature which differed from normal fatty tissue or muscle tissue. Our findings further indicated that MSOT offers highly complementary contrast to sonography. Based on the performance achieved, we foresee a promising role for MSOT in the diagnosis and evaluation of subcutaneous soft-tissue masses. Picture: Pseudo-color representation of a cross-sectional multi-spectral optoacoustic slice through a subcutaneous lipoma. Multi-spectral information is encoded in color. The lipoma can clearly be distinguished from the surrounding tissue based on its color. Scalebar 1 cm.
1 Introduction
Lipomas are the most common benign soft tissue tumors and can develop in any fat-containing region of the body. They often develop in subcutaneous tissues but can be also found in deeper locations 1. Lipomas form easily deformable soft tissue masses that may grow to sizes of several centimeters and are generally painless. In some rare cases, fatty tumors can be malignant liposarcoma 2.
Clinical examination based on palpation alone is often insufficient to identify the nature and origin of the mass, in which case imaging becomes necessary 3.
Ultrasound imaging is the method of choice for lipoma imaging, due to its widespread availability and low cost compared to other radiological modalities. The sonographic appearance of superficial lipomas can vary greatly 4. Some investigators have reported lipomas to be sonolucent or hypoechoic with only a few weak internal echoes 4-6. Other studies report that lipomas are medium to highly reflective and dominantly isoechoic or hyperechoic structures with respect to the adjacent muscle, and that lipomas sometimes appear with mixed patterns 4. The differences in lipoma appearance on ultrasound images may be attributed to variations in lipoma internal composition and corresponding acoustic impedance mismatches between different lipoma constituents. As a consequence, identification of lipoma in ultrasound images and distinction from other soft tissue masses may become ambiguous 7, 8.
Optoacoustic imaging has recently shown potential to provide a new modality for tissue interrogation 9, 10. By illuminating tissue with light pulses and detecting ultrasound waves generated due to thermoelastic expansion, optoacoustic imaging provides new forms of contrast useful for diagnostic imaging. Moreover, by using multi-wavelength illumination, so called multispectral optoacoustic tomography (MSOT) can specifically resolve oxy-hemoglobin, deoxy-hemoglobin, melanin, lipids and exogenous contrast agents 11. Optoacoustic imaging and MSOT have been successfully applied to small animal imaging 12, 13 and considered for various clinical applications 9, 10.
In this work we applied recently developed handheld video-rate MSOT 14 to imaging of subcutaneous lipomas. Stimulated by promising results in the literature reporting endogenous lipid contrast in excised human lymph nodes 15, we hypothesized that MSOT could offer a highly complementary modality to ultrasound, improving the imaging ability for lipoma characterization and other subcutaneous soft-tissue masses. We optimized the imaging system to allow imaging of fatty tissue, devised a pseudo-color representation scheme for the multi-spectral data and conducted a pilot study on human lipoma on volunteers. The primary goal was to gain preliminary confirmation of the feasibility of lipoma MSOT as representative of soft tissue masses. We were also interested in identifying morphological features and spectral features associated with lipomas.
2 Experimental
2.1 The video-rate handheld MSOT system
The MSOT imaging platform utilized in this study was previously described 14, but was used herein with an modified handheld imaging probe (HIP) to provide a bigger field of view and allow for imaging of fatty tissue and deeper penetration (1−3 cm). A photograph of the handheld imaging probe is shown in Figure 1a. It is based on a custom-made 256 element transducer array (Imasonic SaS, Voray, France) manufactured using 1–3 piezocomposite technology with a central frequency of approximately 5 MHz and transmit-receive bandwidth of around 60 %. The elements were arranged in one row forming a curved array with a radius of 6 cm covering 174°. The individual elements were further shaped to obtain cylindrical focusing and yield imaging from cross-sectional tissue slices (∼1.5 mm thickness). A custom silica fused-end fiber bundle with the fibers arranged in a linear pattern with 1×40 mm2 length at the output side (CeramOptec GmbH, Bonn, Germany) served to create a rectangular illumination zone ∼3 mm wide and ∼50 mm long on the surface of the object, coinciding with the ultrasound detection plane. To enable convenient handheld usage, the sensing side of the probe was sealed with an optically and acoustically transparent polyethylene plastic membrane creating a cavity which was filled with heavy water (D2O) for acoustic coupling. Heavy water has a lower optical absorption coefficient than normal water at higher wavelengths 16 (Figure 1c). Therefore, illumination light, which has to propagate through approximately 4 cm of coupling medium, is attenuated less and more light arrives at the tissue surface, thus improving imaging depth. The use of heavy water was essential to enable imaging of fatty tissue because at the higher wavelengths all the illumination light would have been absorbed by water before arriving at the tissue surface. MSOT illumination light was provided by a diode-pumped optical parametric oscillator (OPO) laser (Innolas Laser, Krailing, Germany) capable of providing wavelengths in the red and near-infrared regime (680-980 nm) at a pulse repetition frequency of 50 Hz, per pulse wavelength tuning, pulse energy monitoring and a pulse duration below 10 ns. The laser was operated at 25 Hz to limit the light fluence on the skin to below the maximum permissible exposure limits according to the applicable laser safety standard (IEC 60825–1). Optoaoustic signals were digitized with a custom-built data acquisition (DAQ) system with a total of 256 channels, a sampling rate of 40 megasamples per second and 12-bit digital resolution. The laser's Q-switch provided the trigger for the data acquisition.
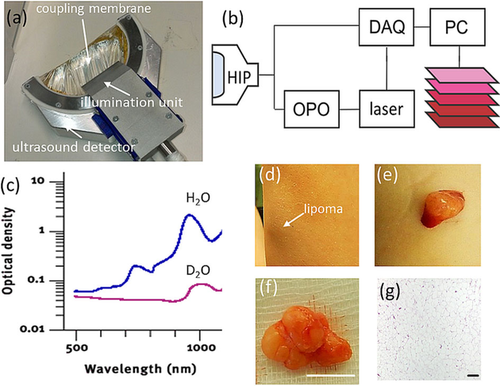
Lipoma imaging by handheld MSOT. (a) Photograph of the handheld MSOT imaging probe. (b) Schematic representation of the imaging system and component interaction. HIP: handheld imaging probe. DAQ: data acquisition system. OPO: optical parametric oscillator. (c) Comparison of the optical absorption spectrum of water (H2O) and heavy water (D2O). (d) Photograph of a superficial lipoma on the left forearm at 10 cm proximal to the wrist. The three spots seen are superficial markers. (e) Photograph of the lipoma during excision and (f) after excision. Scale bar, 1 cm. (g) Histology of the lipoma. Scale bar, 200 μm.
2.2 Image reconstruction, pseudo-color representation and spectral analysis
Data captured at each wavelength were reconstructed using a semi-analytical non-negative constrained model-based inversion algorithm 17. The reconstruction grid had a size of 301×301 pixels with a pixel size of 166 μm. Reconstructions were displayed on a logarithmic colormap to cope with light attenuation effects.


where  denotes the optoacoustic image value at the i-th column and j-ith row pixel at the illumination wavelength
  and
and  are the spectral weighting functions. The three displayed image bands
  ,
,  ,
,  , are fixed linear integrations of the multi-spectral data weighted by the three different spectral envelopes. This is comparable to human vision, where the three different cones also have different spectral sensitivity envelopes. The spectral weighting functions can be chosen according to the features one intends to highlight. Herein, we used the CIE 1931 color matching functions (http://cvrl.ioo.ucl.ac.uk/cmfs.htm) between 400 nm and 680 nm as visualization envelopes and transformed them to the sRGB colorspace 19.
Spectral unmixing was applied to produce images of blood and fat by using library spectra from oxy-hemoglobin, deoxyhemoglobin and fat 20 and nonnegative least squares on a per-pixel basis 21.
Spectral signatures of the lipoma, fat and muscle tissue were determined manually by selecting a 10×10-pixel area in which the three tissue types could be seen, and then determining the mean absorption value in each region of interest. This process was performed for each of 6 tumors at three different areas, yielding altogether 18 different spectra per tissue type. Then these spectra were normalized to their maximum, and the mean value was taken. Contrast-to-noise ratios (CNRs) were computed for all wavelengths for the same slices by manually selecting a 10×10-pixel regions within the lipoma and a 10×10-pixel region adjacent to the lipoma in the subcutaneous fat layer to represent the background. CNR was calculated as the difference between the means of the target and background pixels, divided by the standard deviation of the background pixels as a noise estimate.
2.3 Lipoma imaging and validation
A pilot study was performed on volunteer data. 6 lipomas located at different areas were imaged using MSOT and diagnostic ultrasound. Clinical identification of lipomas was based on conventional clinical examination and confirmed on the ultrasound images. Sonography was performed by an experienced physician using the clinical real-time high-resolution ACUSON X600 Ultrasound System with the linear 4–12 MHz transducer VF12-4 (both from Siemens Healthcare Systems, Erlangen, Germany). Aqueous ultrasound gel applied between handheld probe and tissue was used for acoustic coupling in MSOT and sonography.
3 Results
3.1 Imaged lipomas and comparison to ultrasound
No skin damage, side effects, or any adverse events resulting from MSOT imaging were observed. Cross-sectional imaging of lipomas at 800 nm revealed hemoglobin contrast, and these images were compared qualitatively to those of ultrasound imaging as the standard modality used in the clinic (Figure 2). The lipomas exhibited a heterogenous shape and could be clearly identified on the single-wavelength images with contrast that occasionally appears better than ultrasound. This was particularly evident for the smaller and more superficial lesions (Figure 2 h). Muscle tissue and vasculature were also visible. The fat layer did not give a signal at 800 nm but could be delineated based on negative contrast. Figure 2i shows that a lipoma in the shoulder area had displaced the underlying muscle tissue.
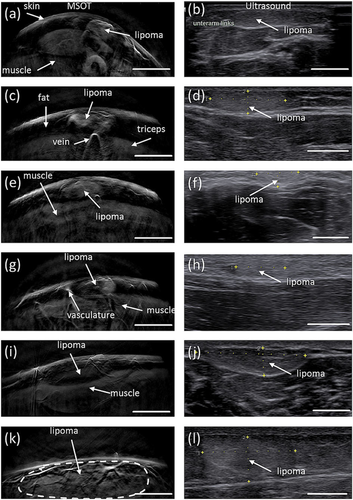
Overview of imaged fatty tumors and qualitative comparison with ultrasound imaging. The left column shows optoacoustic images obtained at an illumination wavelength of 800 nm; the right column, ultrasound images at a similar position. (a, b) Lipoma in the left forearm at about 10 cm proximal to the wrist. (c, d) Lipoma in the tricep at 15 cm proximal to the elbow. (e, f) Lipoma in the right forearm at about 15 cm distal to the elbow. (g, h) Lipoma in the left forearm at about 10 cm distal to the elbow. (i, j) Lipoma in the right shoulder. (k, l) Lipoma in the lumbar area. Scale bar, 1 cm.
Qualitative comparison between MSOT at 800 nm and ultrasonography reveals interesting differences between the two modalities. MSOT offers images of reduced speckle compared to ultrasound that reveal several sub-surface morphological features including a clear appearance of the skin, vascular structures, muscle tissue and fat, with fat appearing in negative contrast. Qualitative observations between the two modalities (e. g. Figure 2c vs 2d, or Figure 2e vs 2 f) reveal that lipomas are visualized more clearly and with higher apparent contrast with MSOT than with ultrasound.
Moreover, the MSOT image reveals both large and small vasculature, which is not the case in the ultrasound image. On the other hand, interfaces between tissue layers are more clearly visible in the ultrasound image, particularly when the lipomas are larger and deeper within the tissue (Figure 2k,l).
3.2 Multispectral imaging of lipomas
The lipoma and overall tissue appearance at different wavelengths is summarized in Figure 3. Images at wavelengths ranging from 700 nm to 860 nm (Figure 3a–f) exhibit similar contrast primarily due to hemoglobin rich structures (vasculature, muscle). Although spectral differences are present between the images, overall morphology visualized at different wavelengths is generally similar. In particular, the images taken at 700–860 nm visualize the skin, the lipoma, muscle tissue and different vascular structures. Mean CNR at this wavelength range was 13.3 (maximum=35.5, minimum=2; n=18). However, above 860 nm, fat absorption increases and the fat layer becomes visible. At 930 nm, fat absorption is maximal, yielding the best visibility of the subcutaneous fat layer. The lipoma within the subcutaneous fat layer can also be distinguished, albeit with less contrast than in the 700 – 860 nm range. Specifically, mean CNR describing lipoma contrast over surrounding tissue was 1.6 (maximum=6.4, minimum=0.3; n=18).
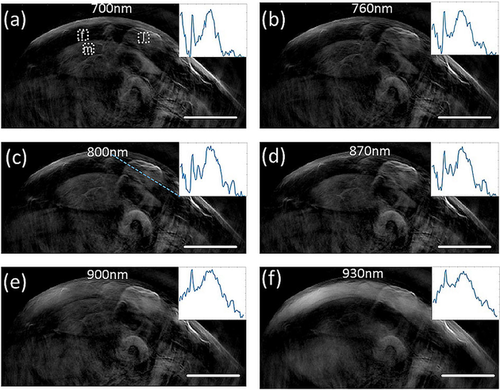
Lipoma imaging at different illumination wavelengths. (a-f) single-wavelength images of a subcutaneous lipoma at 10 cm proximal to the wrist. The inserts show the profile through the lipoma along the blue dotted line shown in (c). Scale bar, 1 cm.
Figure 4a, c and e show pseudo-color visualization of the multi-spectral datasets obtained from the first three lipomas shown in Figure 2. With this visualization technique, spectral information is encoded in color. Pixels with the same spectral signature are displayed with the same color. The brightness of the pixel reflects the strength of the optoacoustic signal. When this coloring algorithm is applied to the acquired multispectral data, the skin surface appears in light blue and the fat layer in red. The muscle tissue is bluish-green and becomes more reddish at greater depth, an effect due to spectral coloring 22. The lipoma appears yellow-whitish and can clearly be distinguished from the surrounding tissue based on its color.
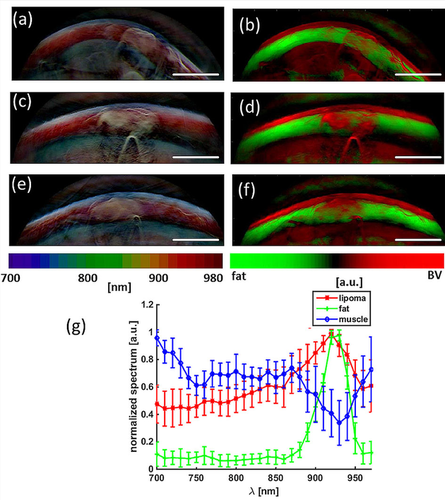
Multi-spectral lipoma imaging. (a, c, e) Pseudo-color representation of the multi-spectral dataset obtained from the first three lipomas in Figure 2 (b, d, f) Signal from blood (red) and fat (green) unmixed from the multi-spectral data by spectral fitting. Scale bar, 1 cm. (g) Mean normalized spectral signatures of lipoma, fat and muscle tissue based on all measurements.
Figure 4b, d and f show the hemoglobin (red) and fat signal (green) obtained by spectral unmixing of the multi-wavelength optoacoustic images collected. The hemoglobin and fat contributions are superimposed on one composite image. Observation of the lipoma region of interest (ROI) exhibits both hemoglobin and fat contributions.
Figure 4 g shows the mean normalized spectral signatures of the lipoma, the fat layer and muscle tissue. Differences in spectral behavior allowed us to deduce the locations of different tissue types. The spectral signature of muscle tissue resembles a mixture of oxyhemoglobin and deoxy-hemoglobin. The spectral signature of fat tissue resembles the absorption spectrum of fat, with its characteristic peak at 930 nm. The spectral signature from the lipid area is a mixture of the blood and fat signatures.
A video of a multi-wavelength scan is provided as supplementary material. In addition to the previously mentioned features, a strong surface signal at 970 nm is observed, where water absorbs more than other tissue chromophores. This is due to the aqueous ultrasound gel applied between imaging probe and tissue.
4 Discussion and conclusion
A pilot study was performed to assess the feasibility of lipoma MSOT and the potential merits of optoacoustic imaging over ultrasonography with respect to imaging of subcutaneous soft tissue masses. For the study we used a real-time handheld MSOT imaging system that can be operated in a similar fashion to a clinical diagnostic ultrasound system 14, but with a modified imaging probe to allow visualization of fatty tissue and deeper penetration. One important modification of the imaging probe, to improve light delivery to the tissue, was the use of heavy water as a coupling medium.
In addition, a pseudo-color based visualization scheme was developed to encode spectral information as color. This facilitates visual interpretation of the multispectral information obtained by MSOT.
Single-wavelength MSOT allowed visualization of subcutaneous lipomas and yielded better contrast than sonography, in particular when imaging at wavelengths where light absorption by fat is low and hemoglobin absorption is high. The ability of MSOT to differentiate multiple spectral signatures based on tissue optical absorption offers an additional dimension absent from ultrasonography, which provides only a “monochromatic” image of acoustic impedance differences 9. Advantageously, MSOT can distinguish tissue types based on molecular composition, in particular for photoabsorbing molecules such as hemoglobin and fat. Conversely, imaging at wavelengths where light absorption by fat is high (e. g. 930 nm) appears to be less appropriate for differentiating lipoma from surrounding tissues, at least when the lipoma is embedded in adipose tissue layers as in the present study. The mean CNR achieved in the wavelength range of 700–860 nm was 13.3 (±8.4).
With respect to the optimal imaging wavelength for single-wavelength lipoma imaging, we prefer imaging at the isobestic point of blood (797 nm). This should avoid effects due to variations in tissue oxygenation levels.
Multispectral analysis further showed that lipomas display a spectral signature that differs from muscle tissue or normal fat tissue. Therefore, lipomas can be distinguished based on color in the pseudo-color representation of the multi-spectral data, in which spectral information is encoded as color.
The results from our spectral unmixing of blood and fat signals are consistent with the fact that lipomas consist of both fatty tissue and vasculature. The bulk spectral signature of the lipoma therefore contains both contributions from fat and blood and therefore differs from muscle tissue, where the main absorber is blood, and pure fat tissue, which is less vascularized than the lipoma.
Occasionally, lipomas may infiltrate muscle tissue or lie close to major vasculature, although this was not the case in our study. MSOT, with its unique ability to spectrally distinguish lipomas, vasculature, tissue and fat tissue, may be better suited than ultrasonography to assess such infiltration and aid in treatment/surgical planning. MSOT may also be able to detect changes in the spectral signature of lipomas depending on the presence of other components, which can include fibrous septae, muscle fibers or necrotic fat 23. Such components would appear as different colors in the pseudo-color representation that we propose here.
A larger study is now contemplated, examining in more detail different spectral components on a larger statistical sample involving also a variety of other subcutaneous soft tissue masses such as mesenchymal tumors (e. g. lipoma, angioma, liposacroma), skin appendage lesions (e. g. epidermal cysts), metastatic tumors (e. g. carcinoma, melanoma), other tumors and tumor-like lesions (e. g. lymphoma, myxoma) and inflammatory lesions (cellulitis, abscesses).
The present study suggests that MSOT can be an excellent complement to ultrasound. Whether MSOT could ultimately replace ultrasound is an entirely different question that cannot be addressed here because, for technical reasons, it was not possible to co-register the two imaging modalities in the set-up. Recently, systems have been described that offer simultaneous, co-registered ultrasound and MSOT 24, and such a system could be used to perform parallel comparisons of the two modalities in the future. Each modality has its strengths and weaknesses. MSOT, for instance, is limited in penetration depth to 2 – 3 cm in most tissues, due to excitation light attenuation.
Therefore clinical application of hybrid MSOT and US together can yield highly complementary information, potentially improving diagnosis of subcutaneous soft tissue lesions.
Supporting Information
Additional supporting information may be found in the online version of this article at the publisher's website.
Acknowledgements
A.B. and V.N. acknowledge funding from the European Union project FAMOS (FP7 ICT, contract no. 317744). A.B. thanks Chapin Rodriguez for proofreading the manuscript.


