Disease-duration based comparison of subsets of immune cells in SARS CoV-2 infected patients presenting with mild or severe symptoms identifies prognostic markers for severity
Abstract
Introduction
Infection with SARS-CoV-2 leads to a spectrum of symptoms. Understanding the basis for severity remains crucial for better management and therapy development. So far, older age, associated-comorbidities, and IL-6 have been associated with severity/mortality.
Materials and Methodology
As a primary step, we analyzed the frequency and functional profile of innate immune cells (NK cells/dendritic cells/monocytes) and adaptive immunity-driving lymphocytes (B cells/T cells/follicular T helper cells) by flow cytometry. Sixty cases of SARS CoV-2 infection (25 severe, 35 mild) and ten healthy subjects without SARS CoV-2 IgG were included. Disease-duration based analysis of immune profile was explored for early events differentiating the two disease forms. Neutralizing antibody titers were determined by PRNT.
Results and Conclusion
Disease severity was found to be associated with impaired maturation of mDCs and hyperactivation of NK, follicular T helper cells, and CD8 T cells. Lower IL-21 receptor expression on memory B cells indicated an imbalance in IL-21/IL-21 R ratio. Lower BCMA positive plasmablast cells in severe cases did suggest a probable absence of long-term humoral immunity. Multivariate analysis revealed a progressive association of PD-1+CD4 T cells with PRNT50 titers. Thus, in addition to identifying probable prognostic markers for severity, our study emphasizes the definite need for in-depth viral antigen-specific functional analyses in a larger patient cohort and with multiple sampling.
List of abbreviations
-
- SARS-CoV-2
-
- severe acute respiratory syndrome coronavirus 2
-
- PRNT50
-
- plaque reduction neutralization test at 50% reduction
-
- IL-6
-
- interleukin-6
-
- IL-4
-
- interleukin-4
-
- IL-10
-
- interleukin-10
-
- IL-2
-
- interleukin-2
-
- NK cells
-
- natural killer cells
-
- IL-21
-
- interleukin-21
-
- BCMA
-
- B cell maturation antigen (CD269)
-
- COVID-19
-
- coronavirus disease 2019
-
- TFH
-
- follicular T helper cells
-
- ICOS
-
- inducible T-cell costimulator
-
- PD-1
-
- programmed death -1
-
- CXCR5
-
- C-X-C chemokine receptor type 5
-
- pDC
-
- plasmacytoid dendritic cells
-
- mDC
-
- myeloid dendritic Cells
-
- TCR
-
- T cell receptor
-
- BAFF
-
- B-cell activating factor
-
- IFN-γ
-
- interferon gamma
-
- TNF-α
-
- tumor necrosis factor alpha
-
- MEM
-
- minimum essential medium
-
- pfu
-
- plaque forming units
-
- ACE2
-
- angiotensin-converting enzyme 2
-
- MFI
-
- mean fluorescent Intensity
-
- Mcl-1
-
- myeloid cell leukemia-1
-
- IQR
-
- interquartile range
-
- CXCR5
-
- C-X-C chemokine receptor type 5 (CD185)
-
- IL-21R
-
- IL-21 receptor (CD360)
1 INTRODUCTION
The ongoing pandemic of SARS-CoV-2 has turned out to be an unprecedented threat to global public health and the economy. Irrespective of the degree of industrialization or availability of medical infrastructure, all populations have been (and are being) affected. The number of cases worldwide and corresponding mortality rates are 31.6 million and 3.7% respectively.1
The disease, COVID-19, varies from an asymptomatic infection and self-limiting mild disease to severe acute respiratory distress, multiorgan failure followed by recovery or fatal outcome. For any pathogen leading to variable clinical presentations and mortality, understanding of pathogenesis is of utmost importance. Initial studies identified older age and pre-existing chronic conditions such as diabetes, hypertension, cardiovascular diseases, cancer, etc., as high-risk factors for disease severity.2 Viral sequence variation was not related to severity3 and similar viral loads were detected in symptomatic and asymptomatic patients.4
The major focus of the scientific community has been to unravel the immunopathogenesis of the disease requiring a clear understanding of the immune response in both mild and severe disease forms. Due to the high transmissibility of the virus and biosafety concerns, studies are predominantly limited to blood investigations. An association of cytokine storm including high levels of interleukin IL-6 production with severe disease signifies pathological immune dysregulation.3, 5, 6 Recent data suggest that antibody response is higher in severe disease.7 Though studies on innate immunity are limited,8 T cell and B cell responses are being actively investigated9-11
In India, the first COVID case was reported on 30th January 2020. As of today, (September 23, 2020) 5.73 million confirmed cases with >91,000 deaths have been reported. Older age and existing comorbidities remain the high-risk factors. Of note, we observed significantly higher OD values in ELISA12 and neutralizing antibody titers in PRNT (unpublished observations) in patients with severe disease than those presenting with mild infection. In view of the need to understand immunology of the disease in general and among the Indian population in particular, we attempted to explore the functional profile of innate immune cells (monocytes, dendritic cells, and NK cells), and adaptive immune cells (B cells, follicular T helper cells, CD4 T, and CD8 T cells) in SARS CoV-2 infected individuals presenting with asymptomatic, mild, or severe disease. Further, the dynamics of these immune cells and, relation to neutralizing antibody titers was analyzed. We found that certain earlier modulations observed during the first week of disease could differentiate between mild and severe infections.
2 METHODS
2.1 Study design and participants
This study was approved by the human ethics committee of Bharati Vidyapeeth (Deemed to be University) hospital and Medical college. A subset of patients attending Bharati Hospital, Pune, India, with confirmed positive test for SARS-CoV-2 reverse-transcriptase-polymerase chain reaction (RT-PCR), from 20th April 2020 to 11th June 2020, was enrolled. The patients were divided into severe and mild groups according to their clinical presentation.13 All the patients were admitted to a special COVID facility at Bharati Hospital and research center, Pune, a tertiary care hospital.
After informed consent, approximately 5 ml of blood from all these patients and controls were collected in EDTA and processed for PBMC and plasma separation by ficoll-histopaque based density gradient method. Plasma was used for Th1 and Th2 cytokine profiling (IFN-γ, TNF-α, IL-4, IL-10, IL-6, and IL-2) by cytometric bead array kit (BD Biosciences) and detection/quantitation of neutralizing antibodies (Nabs) using 50% plaque reduction neutralization test (PRNT50). PBMCs were subjected for immunophenotyping for selected immune cells and their subpopulations using appropriate fluorochrome-labeled antibodies (Biolegend, San Diego & BD Biosciences) by polychromatic flow cytometry approach using CytoFLEX LX platform (Beckman Coulter). Briefly, after trypan blue-based live cell count, PBMCs were subjected for surface staining procedure using fluorochrome-labeled antibody cocktails (list of antibodies is provided in supplementary Information) followed by fixation (PBS with 3% paraformaldehyde). The intracellular proteins were detected after permeabilizing (BD FACs perm-II) the fixed PBMCs with the help of appropriate fluorochrome-labeled antibodies (Supporting Information Table). Using forward and side scatter, the lymphocyte and lympho-monocyte populations were gated while acquiring the samples, and 50,000 gated events were recorded. The cells and the subpopulations studied are enlisted in Table 1. The gating strategy is depicted in Figure 1.
| No | Major cell types | Cell subsets | Subpopulation |
|---|---|---|---|
| 1 | T cells (CD3+ cells) | CD4 T cells (CD3+ CD4+) | IL-2+CD4, and CD40L+CD4 T cells |
| TFH (CD3+CD4+CXCR5+PD-1) | ICOS+IL-21 +TFH cells | ||
| CD8 T cells (CD3+CD8+) | CD38+HLA DR + CD8 T cells | ||
| 2 | B cells | Memory B cells (CD3-CD19+ CD27+) | Switched memory B cells (CD3-CD19+ CD27+IgD-) |
| (CD3-CD19+) | Unswitched memory B cells (CD3-CD19+ CD27+IgD+) | ||
| IL-21 R+Memory B cells | |||
| Plasmablast cells (CD3-CD19+CD138+) | BCMA+plasmablast cells | ||
| 3 | NK cells | Total NK cells (CD3-CD16+CD56+)+(CD3-CD16-CD56+) | Only CD107a +Total NK cells |
| CD107a + IFN-γ+Total NK cells | |||
| Only IFN-γ+Total NK cells | |||
| 4 | Dendritic cells | Myeloid dendritic cells (mDC) (Lineage - HLADR + CD11c +CD1c+) | CD80+CD86+ mDC |
| Plasmacytoid Dendritic cells (pDC) (Lineage - HLADR + CD11c -CD123+) | CD80+CD86+ pDC | ||
| 5 | Monocytes | CD3-CD14+ | CD3-CD14+CD16- and CD3-CD14+CD16+ |

2.2 Determination of SARS CoV-2 PRNT50
For PRNT50, one day before infection, 1 × 10⁵ Vero cells/ml were seeded in 24-well plate using MEM containing 10% FBS and antibiotics. 1:5 diluted serum samples were heat-inactivated for 30 min at 56°C. Four-fold serial dilution was performed and mixed with an equal volume of 20-40 pfu of SARS CoV-2. The serum-virus mixture was incubated for 1 h at 37°C in a humidified incubator with 5% CO2. After incubation, 100 µL of the mixture was added in duplicate to 24-well plate and incubated for 1 h at 37°C in humidified incubator with 5% CO2. After incubation, 1 ml of 1% overlay media containing MEM, Aquacide-II (Merck), 2% FBS and antibiotics was added to the Vero cell monolayer. Plates were incubated for 5 days at 37°C in a humidified incubator with 5% CO2. Five days postinfection, overlay media was discarded, cells were fixed using 3.7% formaldehyde and after washing with PBS, cells were stained using 1% crystal violet. Plates were washed and kept for air dry. Plaques were counted manually and PRNT50 titer was determined using Karber's formula as described earlier.14 Samples with PRNT50 titer ≥20 were considered seropositive.
2.3 Statistical analysis
Statistical analysis was performed using SPSS 20.0 software and Graph Pad Prism 5.0 software. Median and interquartile range (IQR) were used to describe continuous variables. Mann-Whitney U test was used to compare the median for continuous variables between the study groups. For univariate and multivariate analysis, R programming was used.
3 RESULTS
3.1 Study population
The study included 60 COVID-19 patients and 10 apparently healthy individuals negative for IgG-anti-SARS-CoV2 antibodies. Patients admitted to intensive care units for oxygen/ventilator support were designated as suffering from a severe disease (SD, n = 25) while those with mild (n = 20) or no (n = 15, asymptomatic) symptoms were classified as MD. Among the SD patients, four succumbed to infection while 21 were discharged. Follow up blood samples collected from SD (n = 15) and MD (n = 5) patients were also studied. The demographic characteristics of the study participants are shown in Table 2. COVID-19 cases showed a marked lymphopenia as evidenced by lower lymphocyte percentage (median-28.83%) as compared to the control subjects (median-61.06%) (p < .0001).
| Mild | ||||
|---|---|---|---|---|
| Symptomatic | Asymptomatic | Severe | Control | |
| Number | 20 | 15 | 25 | 10 |
| Age in years (median) | 38.5 yrs | 38 | 51 | 35 |
| Sex ratio | 14M/6F | 4M/11F | 20M/5F | 5M/5F |
| Comorbidities (diabetes, hypertension, cardiovascular diseases, and obesity) | 4/20 (20%) | 3/15 (20%) | 16/25 (64%) | None |
To understand the contribution of major immune cell subsets in the pathogenesis of SARS CoV-2 infection, we evaluated the frequencies of antigen-presenting cells (dendritic cells and monocytes), natural killer cells, T cells (CD4 T cells, CD8 T cells, and follicular T helper cells [TFH]) and B cell subsets (memory B cells and plasmablast cells). Cytokine storm involving a major role of IL-6 is already documented and hence we analyzed Th1 (IFN-γ, TNF-α, and IL-2) and Th2 (IL-4, IL-6, and IL-10) plasma cytokine levels to delineate association with these cells if any. Table 3 provides the median and IQR of different immune cell subsets with associated markers in different study groups.
| Immune parameters | Mild (N = 35) | Severe (N = 25) | Mild versus severe (Mann–Whitney U test) | Controls (N = 10) | Mild versus Controls (Mann–Whitney U Test) | |
|---|---|---|---|---|---|---|
| Median (IQR) | Median (IQR) | p value | Median (IQR) | p value | ||
| Innate immune response | Myeloid DC % Total | 0.43 (0.19–0.86) | 0.21 (0.02–0.65) | 0.056 | 0.61 (0.37–0.73) | 0.56 |
| mDC (CD80+ & CD86 +) % | 87.42 (84.2–90.68) | 56.89 (41.57–77.59) | <0.0001 | 88.52 (86.4–92.13) | 0.28 | |
| CD80 MFI mDC (CD80+ & CD86) | 8976(7747–10795) | 8364 (6591–11,277) | 0.333 | 9403 (8235–10583) | 0.67 | |
| CD86 MFI (CD80+ and CD86+) | 6265(5127–8107) | 2708 (2144–4829) | 0.001 | 8628 (7695–9996) | 0.01 | |
| Plasmacytoid DC % Total | 0.17(0.10–0.26) | 0.07 (0.02–0.21) | 0.005 | 0.37 (0.28–0.54) | 0.01 | |
| CD80+ pDC % | 57.27(40.08–67.1) | 42.55 (19.05–73.68) | 0.164 | 67.96 (51.94–85.98) | 0.05 | |
| CD80 MFI (pDC) | 6025(5293–8874) | 7897 (6318–12284) | 0.047 | 6555 (6222–7968) | 0.17 | |
| CD86+ pDC % | 24.75(13.77–37.49) | 20.83 (0–43.81) | 0.692 | 18.4 (9.59–41.11) | 0.86 | |
| CD 86MFI (pDC) | 390.6(352–578.3) | 622 (445.7–775.1) | 0.863 | 524 (319–564.6) | 0.6 | |
| Monocyte % Total | 1.925(0.57–2.98) | 1.74 (0.65–3.56) | 0.872 | 1.71 (0.8–3.56) | 0.97 | |
| CD16+ monocyte % | 11.96(6.91–16.66) | 17.87 (5.53–25.73) | 0.301 | 4.91 (4.45–8.44) | 0.02 | |
| Total NK% | 8.52(4.76–12.4) | 7.74 (5.105–18.24) | 0.567 | 7.08 (3.42–10.68) | 0.76 | |
| IFN-γ & CD107a+ total NK% | 0.06(0–0.32) | 1.17 (0.09–4.88) | 0.001 | 1.11 (0–3.43) | 0.05 | |
| Only CD107a+ total NK% | 11.69(6.79–24.39) | 18.03 (9.71–31.25) | 0.305 | 19.71 (8.46–27.7) | 0.34 | |
| Only IFN-γ + total NK% | 0(0-0.038) | 0 (0–2.4) | 0.007 | 0 (0–0.63) | 0.2 | |
| T cell response | CD8% | 32.04(22.3–41.45) | 30.64 (25.63–40.54) | 0.792 | 34.62 (26.63–40.29) | 0.42 |
| HLA DR and CD38 + CD8% | 0.13(0.02–0.78) | 2.12 (0.61–8.36) | 0.0001 | 0.08 (0.01–0.11) | 0.2 | |
| CD4% | 60.93(49.53–68.25) | 54.9 (41.32–66.2) | 0.215 | 53.44 (47.89–61.45) | 0.18 | |
| CD40L+ CD4% | 6.09(3.305–11.97) | 8.04 (6–13.82) | 0.356 | 4.58 (3.35–7.93) | 0.43 | |
| CD40L MFI | 21399(20164–23105) | 24397 (22559–25459) | <0.0001 | 19,521 (19,134–20,993) | 0.01 | |
| IL-2 + CD4% | 0.02(0.01–0.06) | 0.205 (0.08–1.68) | <0.0001 | 0.01 (0–0.07) | 0.01 | |
| IL-2 MFI | 2425(1983–4385) | 1769 (1637–2076) | 0.071 | 2247 (2171–4494) | 0.61 | |
| CD4/CD8 | 1.8(1.165–3) | 1.7 (1.1–2.54) | 0.587 | 1.43 (1.12–1.77) | 0.21 | |
| Follicular T helper cell Response | TFH % | 0.09(0.02–0.22) | 1 (0.525–1.845) | <0.0001 | 0.1 (0.03–0.24) | 0.79 |
| CXCR5+CD4% | 14.62(9.59–20.03) | 23.43 (12.46–41.77) | 0.031 | 13.58 (10.38–16.52) | 0.96 | |
| PD-1+ CD4% | 0.34(0.155–1.39) | 1.84 (0.67–3.01) | 0.009 | 0.29(0.2-0.54) | 0.88 | |
| ICOS and IL-21 + cells % | 75(50–100) | 71.09 (59.33–79.87) | 0.546 | 56(42.86-83.67) | 0.71 | |
| Il-21 MFI | 14979(13186–21545) | 18814 (15943–22635) | 0.015 | 15223(13559–19936) | 0.28 | |
| ICOS MFI | 9384(7512–13657) | 10708 (9177–14010) | 0.12 | 9603 (7954–11591) | 0.42 | |
| B cells | B cells % | 10.89 (8.53–16.47) | 6.02 (2.15–17.1) | 0.134 | 13.6 (5.2–16.3) | 0.22 |
| Memory B cells % | 23.22 (14.42–31.8) | 36.04 (21.73–43.01) | 0.01 | 26.9 (15.23–39.68) | 0.52 | |
| Class switched memory B cells % | 90.65 (81.08–93.67) | 90 (84.14–94.52) | 0.741 | 89.35 (80.02–96.37) | 0.83 | |
| Unswitched memory B cells % | 7.82 (5.7–17.08) | 10 (4.79–15.2) | 0.952 | 12.63 (5.23–16.78) | 0.7 | |
| IL-21 R + memory B cell % | 6.36(1–35.69) | 7.85 (2.36–29.65) | 0.533 | 8.65 (3.68–23.56) | 0.21 | |
| IL-21 R MFI | 865.4(325.2–2541) | 1324 (457.2–3548) | 0.645 | 2123 (1632–2152) | <0.0001 | |
| Plasmablast cells | Plasmablast cells % | 9.9(3.8–12.25) | 10.72 (3.78–14.57) | 0.852 | 3.21 (1.01–6.23) | <0.0001 |
| BCMA + plasmablast cells % | 26.09(15.85–30.43) | 14.7 (8.95–27.53) | 0.072 | 25.87 (21.06-28.3) | 0.76 | |
| BCMA MFI | 29989(14346–34433) | 30,816 (18,297–41,842) | 0.724 | 28,965 (26,771–43,781) | 0.67 | |
| Plasma Th1 cytokine level (pg/ml) | IFN-γ | 0.32(0–1.54) | 0.43 (0.12–0.83) | 0.953 | 0.29 (0–1.17) | 0.15 |
| TNF-α | 0(0–0.24) | 0 (0–0.24) | 0.733 | 0.24 (0–0.85) | 0.8 | |
| IL-2 | 0.155(0–0.5) | 0.22 (0–0.39) | 0.952 | 0 (0–0.25) | 0.06 | |
| Plasma Th2 cytokine level (pg/ml) | IL-10 | 0.465 (0.08–1.37) | 2.53 (0.67–16.9) | 0.0004 | 0.39 (0.24–0.65) | 0.12 |
| IL-6 | 4.22 (2.05–6.80) | 33.78 (4.36–257.5) | 0.001 | 1.03 (0–2.65) | <0.0001 | |
| IL-4 | 0.68 (0.31–1.32) | 0.43 (0–0.89) | 0.121 | 0 (0–1) | 0.01 |
3.2 Mild symptomatic versus asymptomatic COVID-19
Initially, we compared mild symptomatic and asymptomatic individuals with respect to all the parameters examined. Except for TNF-α levels, the other parameters were comparable among these patient groups. TNF-α was detected in the asymptomatic patients (median-0.125 pg/ml [0–0.45]) while this cytokine was undetectable in the symptomatic cases (p = .027). Therefore, the two groups were combined (MD) while comparing with the patients with severe disease (SD).
3.3 Compromised antigen presentation in COVID-19 and hyperactivation of NK cells
DC population was significantly affected by the virus infection. The proportion of total mDCs was not different among the two groups at p = .056 level. SD patients exhibited a lower frequency of mDCs with the mature phenotype (CD80 and CD86 mDCs) than recorded in the MD group (p < .0001). CD86 expression density was significantly lower in MD patients reducing further in the SD category (p < .001 for both). Plasmacytoid DCs were lower in both MD and SD patients, severe category exhibiting further reduction (p < .005). In the SD patients, pDCs showed lower expression of the maturation marker, CD80 (p = .047). Thus, the disease induced a strident defect in the maturation of the dendritic cell population that was aggravated in severe disease (Table 3; Figure 2A).
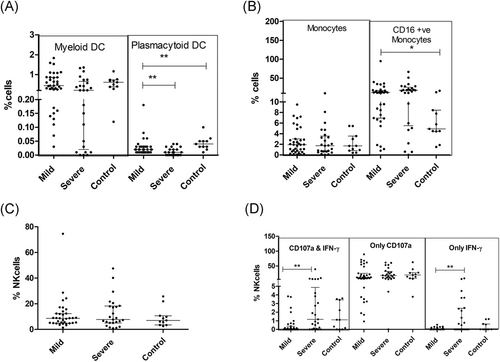
Although monocyte frequencies were intact, a large subset of monocytes was found to be CD16+, that is, nonclassical monocytes (Table 3; Figure 2B). While the total NK cell pool was unaffected, degranulation phenotype along with IFN-γ was augmented in the SD patients as compared to MD cases (p = .001; Table 3; Figure 2C,D)
3.4 Hyperactivation of TFH and CD8 T cells
In contrast to the recent findings of significant depletion of T cells in SARS Cov-2 infection,15 T cell frequencies and CD4/CD8 ratio remained unchanged among both the patient groups (Table 3; Figure 3A,B). Although the CD8 T cell compartment was unchanged with respect to quantity, activation of these cells was evident by higher expression of HLA DR and CD38 expression in the SD patients than the MD group(p = .0001) (Table 3; Figure 3C).
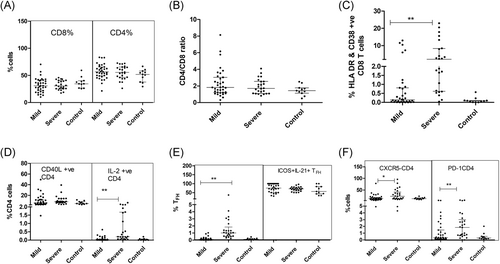
In MD patients, CD4 T cells exhibited higher expression of CD40L (p = .009) that was further enhanced in the SD category (p < .0001). The proportion of IL-2+ CD4 T cells was higher in the SD patients while the levels among MD patients and controls were comparable (Figure 3D). In SD patients, the proportion of TFH (CXCR5 + PD-1+ CD4+ T cells (p = .0001), CXCR5+CD4+PD-1- T cells (p = .03), and PD-1+CD4 T cells (p = .009) was higher than in the MD group. However, IL-21 and ICOS expression by these subsets remained comparable between SD & MD patients (Table 3; Figure 3E,F).
3.5 Quantitative and qualitative loss of B cell compartment
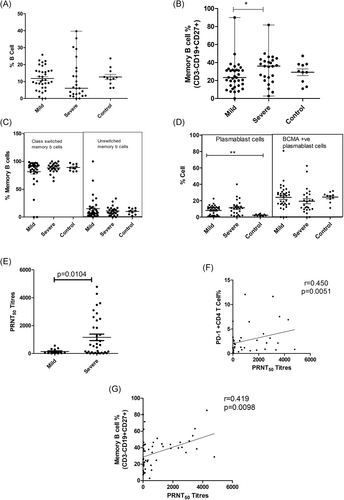
Although the total B cell frequency remained unchanged, the SD patients exhibited a higher frequency of memory B cells than the MD group (Table 3; Figure 4A,B). The class switched and unswitched memory B cells percentages were comparable among all the groups (Table 3; Figure 4C). Even though the frequency of IL-21R positive memory B cells was unchanged, the IL-21 receptor expression intensity (MFI) was lower in MD patients when compared to the controls (p < .0001). No difference was recorded among MD and SD groups. In addition, a sharp rise in plasmablast cells was evident in the MD patients (p < .0001) that remained comparable in the SD group. (Table 3; Figure 4D)
3.6 Plasma cytokine profile: An indication of immune paralysis
In line with previous findings, plasma cytokine profiling revealed the dominance of IL-6 secretion in COVID-19 patients (p = .001) which was more pronounced in severe cases than in mild disease (p = .001). IL-10 levels were also higher in severe disease (p = .0004). Only mild disease showed a significant rise in IL-4 (p = .01) as compared to the controls (Table 3; Figure 5A,B).
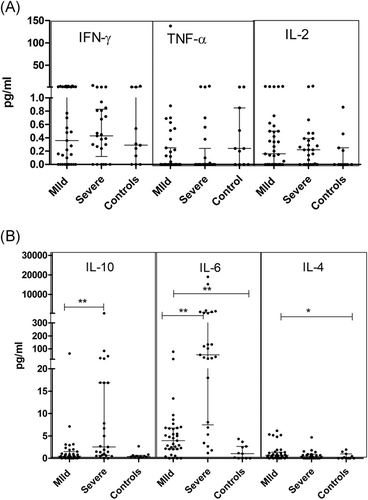
In view of the observed decline in the frequency of myeloid dendritic cells, we compared cytokine profiles of MD and SD patients with or without mDC reduction. Analyses revealed that in the mild patients, plasma IL-4 levels increased with rise in mDC frequency (p = .023). No such difference was recorded in the SD patients.
3.6.1 Neutralizing antibody titers in relation to the parameters investigated
In accordance with our earlier observations, severe disease was characterized by higher neutralizing antibody titers. During the first 2 weeks, PRNT50 titers were significantly higher in the SD patients (median: 571.1) than the MD group (median: 53.05, p= .010; Figure 4E). Therefore, the proportions and effector functions of immune cells and cytokines were compared in relation to neutralizing antibody titers in these groups. In univariate analysis, CD86+ pDC (p = .017), PD-1CD4 (p=.0051; Figure 4F) and memory B cells (p = .00982; Figure 4G) correlated with PRNT50 titer. However, in multivariate analysis, PD-1+CD4 emerged as the single variable influencing PRNT50 titers (p = .003, R2 = 0.421). As mentioned earlier, PD-1 expression on CD4 T cells was higher in severe disease.
3.6.2 Relationship of disease duration and modulation of parameters examined in the SD and MD patients
Next, we compared the proportion of immune cells and cytokine concentrations in the MD and SD patients at different time points after the onset of clinical symptoms (Table 4). These comparisons revealed the following patterns in the SD patients: (1) Lowering of activated mDCs (CD80+ and CD86+) and increase in TFH cells that continued till the 3rd-week postonset; (2) lower pDCs and a marginal reduction in B cells during the 2nd week (p = .061) and higher IL-2+CD4 cells during the first two weeks; (3) difference only in the first week; increase in HLA DR & CD38+ CD8 and memory B cells and decrease in BCMA + plasmablast cells; (4) modulation during 2nd week, decrease in CD16+ Monocytes and reduction in total NK cells.
| Name of Immune cell subset | Type of illness | Week 1 | Mann–Whitney U | Week 2 | Mann–Whitney U | Week 3 | Mann–Whitney U | Week 4 | Mann–Whitney U |
|---|---|---|---|---|---|---|---|---|---|
| mDC (CD80+ and CD86+) % | Mild | 87.6 | 0.007 | 87.8 | 0.001 | 87.7 | 0.013 | 87.8 | 1 |
| Severe | 31.77 | 33.33 | 56.02 | 83.35 | |||||
| Plasmacytoid DC % | Mild | 0.17 | 0.012 | 0.11 | 0.032 | 0.15 | 0.276 | 0.13 | 0.121 |
| Severe | 0.06 | 0.03 | 0.01 | 0.06 | |||||
| CD4% | Mild | 56.8 | 0.19 | 59.3 | 0.753 | 57.08 | 0.355 | 58.12 | 0.121 |
| Severe | 71.08 | 63.7 | 60.64 | 10.735 | |||||
| TFH % | Mild | 0.15 | 0.001 | 0.15 | 0.012 | 0.17 | 0.045 | 0.16 | 0.121 |
| Severe | 1.29 | 1.07 | 1.04 | 5.77 | |||||
| Il-21 MFI (TFH) | Mild | 18836 | 0.28 | 14852 | 0.038 | 16471 | 0.165 | 15160 | 0.121 |
| Severe | 21875 | 21751 | 17500 | 15178 | |||||
| CD16+ monocytes % | Mild | 30.37 | 0.165 | 10.16 | 0.025 | 10.16 | 1 | 10.16 | 1 |
| Severe | 13.22 | 17.86 | 12.39 | 18.3 | |||||
| Total NK % | Mild | 7.6 | 0.316 | 6.2 | 0.042 | 6.38 | 0.355 | 6.29 | 1 |
| Severe | 2.88 | 2.65 | 3.03 | 8.866 | |||||
| HLA DR + CD38 + CD8% | Mild | 0.495 | 0.041 | 0.16 | 0.414 | 0.29 | 0.122 | 0.18 | 1 |
| Severe | 3.69 | 2 | 3.03 | 0.405 | |||||
| IL-2 + CD4% | Mild | 0.13 | 0.005 | 0.03 | 0.016 | 0.06 | 0.06 | 0.035 | 1 |
| Severe | 0.49 | 0.47 | 0.3 | 0.015 | |||||
| B Cells % | Mild | 13.44 | 0.033 | 10 | 0.061 | 13.01 | 0.64 | 11.5 | 0.439 |
| Severe | 4.63 | 6.93 | 7.47 | 13.66 | |||||
| Memory B cells % | Mild | 14.3 | 0.001 | 25.76 | 0.116 | 31.26 | 0.355 | 28.73 | 0.121 |
| Severe | 41 | 42.86 | 34.78 | 42.84 | |||||
| Class Switched memory B cells % | Mild | 81.15 | 0.589 | 89.31 | 0.586 | 88.22 | 0.537 | 88.76 | 0.439 |
| Severe | 85.23 | 86.53 | 90.02 | 81.73 | |||||
| Unswitched memory B cell% | Mild | 18.27 | 0.643 | 10.27 | 0.66 | 10.97 | 0.436 | 10.28 | 0.425 |
| Severe | 14.03 | 12.61 | 10 | 16.58 | |||||
| BCMA+plasmablast cell % | Mild | 23.7 | 0.02 | 21.32 | 0.136 | 23.56 | 0.563 | 25.32 | 0.935 |
| Severe | 13.23 | 10.25 | 12.34 | 21.25 | |||||
| BCMA MFI | Mild | 25326 | 0.82 | 34215 | 0.996 | 27896 | 0.036 | 36547 | 0.865 |
| Severe | 21457 | 26359 | 21789 | 39875 | |||||
| IL-6 pg/ml | Mild | 6.14 | 0.939 | 5.12 | 0.368 | 9.68 | 0.105 | 5.83 | 1 |
| Severe | 5.82 | 27.36 | 49.13 | 21.1 |
- Note-The week wise disease duration is calculated after the onset of symptoms.
3.7 Immune cells/cytokines at the time of first and last sampling in the COVD19 patients
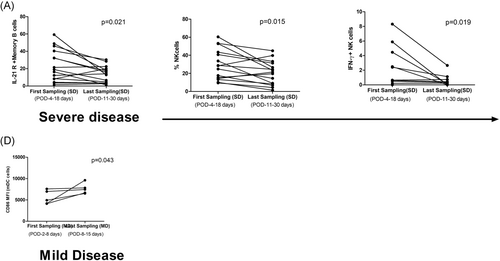
Follow up samples were available from 15 SD and 5 MD patients. A significant decline in IL-21R positive memory B cells (p = .021) and NK cell function in terms of degranulation (p = .015) and IFN-γ secretion (p = .019) capacity of NK cells was noted in the SD patients (Figure 6A,B,C). In the MD patients, except for the rise in CD86 MFI on myeloid DCs (p = .043), other immune cells and cytokines remained unchanged (Figure 6D).
4 DISCUSSION
This study reports alterations in the circulating immune cells and cytokines associated with innate and adaptive immune responses in COVID-19. We first compared all the MD and SD patients irrespective of the duration of disease onset (Table 3). However, when the same parameters were compared with respect to disease duration and severity, differential modulations were obvious and are discussed here.
4.1 Innate immune response
So far, understanding of innate immune response to SARS CoV-2 is limited.8 We assessed the proportions and effector functions of three important cell populations of the innate immune system, that is, dendritic cells, monocytes, and NK cells. Interestingly, a reduction in dendritic cells was found in the SD patients (Table 4). Comparison in relation to disease duration revealed an association of early (first week) reduction of mDCs with the mature phenotype (CD80 and CD86) and total pDCs with severe disease that continued for at least 2 weeks (Table 4). Interestingly, patients with lower frequency of mDCs exhibited lower plasma IL-4 levels. Role of IL-4 in the process of maturation of dendritic cells is well documented.16 For the first time, we show that early modulation of dendritic cells is associated with disease severity and could play a crucial role in COVID-19 pathogenesis. In-depth evaluation in terms of utility as a prognostic disease severity marker and treatment is warranted.
Involvement of monocytes, a key cell of the innate system, is documented in COVID-19.17 Monocytes from peripheral blood of healthy donors were shown to be positive for ACE2 receptor and could be infected by SARS-CoV-2.18 In contrast to previous reports,17 the proportion of monocytes were not different in MD and SD patients. Nonetheless, nonclassical monocytes (CD16+) did increase in both the patient categories. During the second week of the disease, SD patients exhibited significantly higher number of nonclassical monocytes than the MD group that could have led to further enhancement of proinflammatory cytokine secretion and worsening of the disease.
NK cells are one of the first cells to protect the host from viral infections. Lowering of these cells has been reported in COVID patients.19 In our patient series, NK cell frequencies were generally lower in SD patients reaching a significant difference during the second week. Increased frequency of activated NK cells (CD107a and IFN-γ expression) in SD patients is noteworthy and may be responsible for the aggravation of the infection by providing an inflammatory milieu.
4.2 T cell responses in SARS CoV-2 infection
T cell activation remains an essential event in effective cellular immune response against a variety of viral infections. In COVID-19, reduction,15, 20, 21 as well as unchanged21 frequencies of CD4 and CD8 T cells, have been reported. Our study did not find any alteration in CD4 and CD8 T cell frequencies in both patient categories resulting in unaltered CD4/CD8 ratios. However, a substantial increase in the activated CD8 T cells (HLA-DR and CD38+) in SD patients alone indicates the role of hyperactivation of CD8 T cells in disease severity. Of note, the difference was striking during the initial phase (first week) suggestive of a crucial role in disease pathogenesis. Prospective studies are needed to ascertain the utility of HLA-DR/CD38 positive CD8 T cells as a prognostic marker for disease severity. Following immunization with attenuated yellow fever and smallpox vaccines as models for acute viral infection, Miller et al.22 demonstrated that CD8 T cells with overexpression of HLA-DR and CD38/Ki67 markers reflect virus-specific CD8 T cells.
While confirming higher frequency of IL-2 + CD4 T cells in severe disease,23 our study revealed higher expression of IL-2 by CD4 T cells in SD patients during the first week of illness (Table 4) suggestive of an important role in pathogenesis and possibility of being a prognostic marker of disease severity. Association of elevated IL-2 levels with disease severity is known for other coronaviruses such as SARS.24-26
T cells of SD patients exhibited higher percentage of PD-1+ CD4 T cells that are characterized by poor effector function, sustained expression of inhibitory receptors, and reduced TCR sensitivity.27 IL-10, an inhibitory cytokine, not only prevents CD4 T cell proliferation but also can induce T cell exhaustion.28 Indeed, the SD patients showed higher plasma IL-10 levels which are speculated to be responsible for functional exhaustion of T cells.
Though we did not study virus-specific response, expression of CD40L on CD4+ T cells does indicate sensitization of these cells in the SD patients that could be linked to the secretion of proinflammatory cytokines. Notably, hydroxychloroquine, one of the treatments for COVID, can attenuate progression to severe disease by repressing CD40L expression on activated T cells.29 Taken together, CD40L seems to be playing a critical role in COVID-19 pathogenesis. We observed higher CD40L expression by CD4 T cells in the SD patients. CD40L plays an important role in the germinal center formation.30 In this context, higher PRNT50 titers in the SD group are noteworthy. However, when MD and SD patients were compared with respect to disease duration, no significant difference emerged suggesting the involvement of additional factors.
4.3 Cellular factors responsible for humoral response
Though long-term follow up data is not yet available, a rapid decline of IgG-anti-SARS-CoV-2 antibodies along with the possibility of reinfection is suggested.31 On the other hand, severe disease has been associated with higher antibody titers (including neutralizing).7 Taken together, the dual role of antibodies in protection/pathogenesis of SARS-CoV-2 is not clear and needs immediate attention. As our own data identified the association of early and higher neutralizing antibodies with disease severity, we determined characteristics of key cellular players of humoral responses, that is, B cell and follicular T helper cell compartments in mild and severe disease.
While confirming a significant decline in B cell population in the SD patients3 and patients with longer viral RNA shedding,11 our data revealed that this difference was evident in the first week of disease. B cell sequestration in secondary lymph nodes leading to an early enhanced humoral immune response in severe cases seems a distinct possibility.
The germinal center formation is one of the major steps in the generation of virus-specific antibodies. Generally, TFH cells reside at lymph nodes or secondary lymphoid organs, but, in severe SARS CoV-2 infection, we observed an elevated frequency of TFH in peripheral blood suggestive of their hyperactivation. Moreover, IL-21 secretion was also higher in severe cases. IL-21 exerts an array of its actions through IL-21R expressed on B cells for the induction of affinity maturation and somatic hypermutation.32 Though the frequency of total memory B cell pool in SD cases was higher, these cells were equipped with lower IL-21 R expression. Thus, although IL-21 is expressed in abundant amount, due to the lack of receptor availability, hampering processes like affinity maturation and differentiation into antibody-secreting cells seems likely. Moreover, unused IL-21 may contribute to higher soluble plasma IL-21 levels and, being a member of the Th-17 family may aggravate lung injury in severe cases through cytokine storm mediated immune paralysis.
Multiple regression analysis signified an association of PD-1+CD4 T cells with neutralizing antibody titers that correlated with disease severity. Although PD-1 is an exhaustion marker expressed on activated CD4 and CD8 T cells, it reduces TCR ligand sensitivity imposing a more stringent selection threshold for competing B cells.33 It also promotes affinity maturation, improving the quality/neutralization capacity of antibodies in secondary lymph nodes. Thus, PD-1 expression by CD4 T cells seems to have a dual influence in COVID-19 pathogenesis.
Memory B cells formed during primary infection can induce long-lasting plasma cells to protect the host from recurrent infection. B cell maturation antigen (BCMA) expression is linked to the long lifespan of plasma cells.34 Activation of BCMA by BAFF (B cell–activating factor) increases expression of the antiapoptotic molecule myeloid cell leukemia-1 (Mcl-1), pointing to the mechanistic basis by which the BAFF/BCMA axis promotes long-term survival of plasma cells.35 We observed an early, higher frequency of memory B cells in the SD patients along with a lower proportion of BCMA + plasmablast cells. Memory B cells should be able to generate a protective immune response after reinfection while a low number of BCMA + plasma cells in SD patients may lead to rapid decline over time. Dynamics of antibodies over at least one year in relation to disease severity along with a simultaneous evaluation of relevant immunologic mechanisms will be able to address the most relevant public health issue of protection from SARS-CoV-2 exposure/re-exposure.
After recognition of IL-6 as the prognostic marker for severity in COVID-19,5, 6, 36 several groups including ours (this study) confirmed this observation. In fact, anti-IL-6 antibodies are being used in the treatment of SD patients. In accordance with acute inflammatory response, both IL-6 and IL-10 levels increased in SD patients while IL-4, an anti-inflammatory cytokine predominated in mild disease helping prevention of progression to severe disease. Relation of IL-4 levels with frequency of mDCs is noteworthy. Importantly, IL-4 is observed to reduce the expression of the ACE2 receptor and may partially contribute to restraining viral entry.37
Our study has a few limitations. The sample size was limited and very few samples were available in the 4th week of disease. Due to lymphopenia and restricted sample volume, the study was limited to a few markers. Nonetheless, the results form the basis for planning in-depth analyses involving larger cohort and sequential follow up. Our results warrant exploring the role of IL-21/IL-21R expression ratio (memory B cells), CD40-CD40L interaction (CD4 T cells & B cells), and kinetics of BCMA expression on plasma cells in addressing crucial involvement of humoral response in SARS CoV-2 pathogenesis and protection.
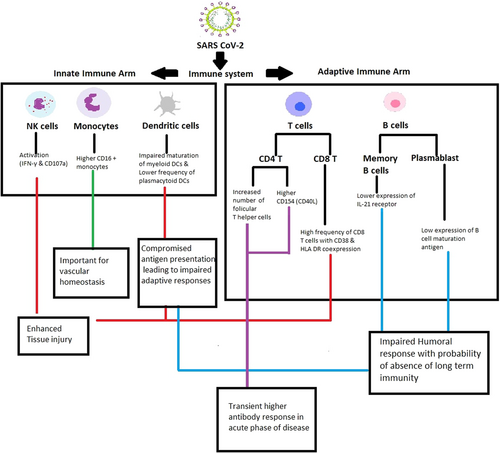
In view of the involvement of multiple immune cell subsets and numerous markers, major findings of the study are outlined in Figure 7. In summary, while confirming previous findings, our study revealed that Indian patients exhibited a different set of immunological modulation in SARS CoV-2 infection and identified additional prospective severity prognostic markers such as dendritic cells, activated CD8 T cells, IL-2+ CD4 T cells, and follicular T helper cells. Confirmation in larger cohorts and in-depth functional assays to understand the underlying mechanism(s) remains the way forward.
ACKNOWLEDGMENTS
The authors would like to thank Mr. Tushar Bhosale for clinical sample management and Mr. Rahul Patil for statistical assistance. Thanks are due to Ms. Shweta, Mr. Aniket, and Ms. Prajakta for excellent technical help. Finally, we acknowledge the study participants for providing the necessary samples. This study was supported by DBT-BIRAC, India (Grant Number-BIRAC/BT/NBM0095/02/18).
CONFLICTS OF INTEREST
The authors declare no financial or commercial conflicts of interest.
AUTHOR CONTRIBUTIONS
VAA and AK conceived and designed the study. SS was responsible for PRNT work. ACM reviewed the results and contributed to the manuscript. SP and SL were responsible for subject recruitment, collection of relevant clinical information and samples as well as follow up. All authors contributed to the article and approved the submitted version.
ETHICAL STATEMENT
The entire study was approved by the Institutional Ethics Committee.
Open Research
DATA AVAILABILITY STATEMENT
The data that support the findings of this study are available from the corresponding author upon reasonable request.


