Drug Sensitivity patterns across FAB subtypes and molecular mutations in AML: A comprehensive analysis for precision medicine
Abstract
Background
Acute myeloid leukaemia (AML) is a heterogeneous disease characterised by distinct French–American–British (FAB) classifications and molecular mutations. Understanding how these biological markers relate to drug responses is crucial for refining therapeutic approaches.
Methods
We examined drug sensitivity patterns in 186 AML patients using selective Drug Sensitivity Scores (sDSS), analysing data from 515 commercially available chemotherapeutic and targeted oncology agents. Drug sensitivity was analysed across various FAB subtypes (M0, M1, M2, M4, M4 eos, M4/M5, and M5) and important mutations (NPM1, FLT3, FLT3-ITD, FLT3-TKD and KIT).
Results
Navitoclax showed greater effectiveness in M0, M1, and M2 subtypes. NPM1 mutations were linked to increased sensitivity to multiple therapeutic agents. FLT3-ITD mutations were associated with significant responsiveness to PI3K/mTOR inhibitors. Analysis of drug combinations revealed complexities in using multiple therapeutic agents, often leading to reduced effectiveness but providing insights into successful drug pairings.
Conclusions
The findings underscore the necessity for personalised therapeutic strategies in AML, advocating for treatment protocols that integrate individual mutation profiles and FAB classifications to enhance patient care and improve clinical outcomes.
1 INTRODUCTION
Acute myeloid leukaemia (AML) remains one of the most challenging haematological malignancies, characterised by uncontrolled proliferation of immature myeloid cells that rapidly infiltrate the bone marrow and peripheral blood. Despite advances in understanding its molecular landscape, AML continues to have a poor prognosis, with a 5-year survival rate of only about 29% across all ages.1 The French–American–British (FAB) classification system, which categorises AML into subtypes M0 through M7 based on cell morphology and differentiation, provides critical insights into disease biology and treatment outcomes.2, 3 Although molecular classifications have gained prominence, combining FAB subtypes with molecular profiling and drug sensitivity data presents a more integrated and practical approach for refining therapeutic decisions and improving outcomes.4
In this study, we analysed ex vivo drug-response and multi-omics profiling data from 186 AML patients, obtained from Malani et al.5 Our analysis highlighted distinct molecular profiles across various FAB subtypes, revealing differences in the prevalence of key mutations such as NPM1, FLT3 (ITD and TKD variants) and KIT. The distribution of FAB subtypes in our cohort showed a predominance of M1, M2 and M5 subtypes, followed by M0, M4 eos and M4. Although considered extremely rare, we had two cases classified as M4/M5 subtype.
Similarly, in the recent years there have been advancements in AML treatment driven by the development of targeted therapeutics, such as BCL-2 inhibitors (e.g., venetoclax), FLT3 inhibitors (e.g., midostaurin, gilteritinib) and various kinase inhibitors.6 However, despite the clinical promise of these drugs, the relationship between FAB subtypes, molecular mutations and drug efficacy remains insufficiently understood. However, this knowledge gap presents a challenge in optimising treatment regimens tailored to individual patients' molecular profiles. Therefore, to bridge this gap, we leveraged the high-throughput drug sensitivity screening data, incorporating selective drug sensitivity scores (sDSSs) to systematically assess therapeutic responses across different FAB subtypes and molecular backgrounds. By aligning drug sensitivity with molecular and morphological characteristics, our study aims to refine the therapeutic decision-making process and improve outcomes for AML patients.
-
How do FAB subtypes and molecular mutations collectively influence drug sensitivity patterns?
-
Can the integration of morphological and molecular classifications improve prediction of drug response?
-
What drug combinations show optimal efficacy across different FAB subtypes and mutation profiles?
-
How can these findings be translated into personalised therapeutic strategies?
Understanding these relationships is crucial for advancing precision medicine in AML and potentially improving patient outcomes through proper drug selection.
2 RELATED WORK
There have been great strides in the areas of AML research in the last few decades. From initial morphological classifications to today's integrated molecular-genetic approach, our understanding has continued to evolve rapidly.7, 8 The paradigm shift from purely morphological classification to molecular characterisation has revolutionised both prognosis and therapeutic strategies.3
2.1 FAB subtypes and their role in drug response
The FAB classification marked the first standardised approach to AML categorisation. Although molecular profiling has gained prominence, FAB subtypes have been an important element in understanding therapeutic responses. For example, M1 and M2 subtypes, which represent early stages of myeloid differentiation, are often characterised by favourable responses to chemotherapies and are typically less aggressive compared to other subtypes.3 Conversely, subtypes like M4 and M5, which reflect more advanced differentiation and monocytic lineage involvement, tend to be associated with more aggressive disease and poorer outcomes, requiring different treatment strategies.9
Recent studies suggest that integrating FAB subtypes with molecular profiling and drug sensitivity data can refine therapeutic decisions in AML.10-12 In our study, we examined how different FAB subtypes responded to various drug classes. We were majorly interested in studying drug sensitivity profiles associated with specific FAB subtypes and mutations such that we recognise what categories of medications are deemed most suitable. For example, M1 and M2 subtypes, which are characterised by early myeloid differentiation, demonstrated better responses to BCL-2 inhibitors like navitoclax. Similarly, Li et al.13 used venetoclax, another BCL-2 inhibitor, combined with azacitidine which is a hypomethylating agent (HMA), that showed enhanced efficacy in patients with monocytic differentiation, particularly those classified under FAB M4 and M5 subtypes. A post hoc analysis of clinical trials indicated higher complete remission rates in these subtypes compared to others, suggesting a favourable response to this combination therapy. Volpe et al. corroborated these findings, showing promising results across multiple FAB subtypes with the same combination of azacitidine and venetoclax.14 However, Konopleva et al. reported reduced sensitivity to venetoclax plus azacitidine in monocytic AML, with the M5 subtype being less responsive.15
In a separate pilot study, Li et al. evaluated the combination of cladribine, low-dose cytarabine and venetoclax in relapsed or refractory AML patients, including M4 and M5 subtypes.16 This regimen showed efficacy, with a significant proportion of patients achieving remission, indicating its potential as a treatment option for these subtypes.
2.2 Molecular mutations and their impact on drug sensitivity
Mutations in FLT3, including internal tandem duplications (FLT3-ITD) and tyrosine kinase domain (FLT3-TKD) mutations are commonly seen in AML patients, with FLT3-ITD being one of the most significant prognostic markers.17 These mutations are linked to poor survival outcomes due to high drug resistance. To tackle this, there have been several on-going research works on novel FLT3 inhibitors and combination therapies. One published study showed MZH29, which is a potent FLT3 inhibitor, to have a higher efficacy against drug-resistant FLT3 mutations in AML.18
The NPM1 gene, occurring in almost 30% of AML patients,19 plays a crucial role in regulating cell division and survival. NPM1 mutations are generally associated with a more favourable prognosis in AML, especially when the mutation occurs without co-occurring FLT3-ITD mutations. A recent study by Othman et al.20 used venetoclax and HMAs or low-dose cytarabine and achieved complete remission with incomplete haematological recovery. Another study by Lachowiez et al. confirmed better treatment results with venetoclax in combination with HMAs for AML with mutant NPM1, even for older patients.19 Our results corroborate these findings, with NPM1-mutated cases showing enhanced sensitivity to venetoclax and other agents like PF-04691502, suggesting the potential of BCL-2 inhibitors in this molecular subgroup. Kinase inhibitors, including those targeting FLT3 and KIT, have been shown to be effective in treating patients with specific mutations, including FLT3-ITD and KIT mutations. In our study, the analysis of drug sensitivity scores across various mutations revealed that FLT3-ITD mutations were particularly sensitive to cerdulatinib, while FLT3-TKD mutations responded well to AZD8055 and PF-04691502.
2.3 Personalised medicine in AML
Personalised medicine has emerged as a promising approach to improving AML treatment outcomes. One such approach is ex vivio drug sensitivity and resistance testing (DSRT), which is used to guide a more personalised treatment. A study by Ojamies et al. found out that the individualised systems medicine program had up to 35% response rates in chemorefractory AML patients using DSRT-guided targeted therapies.21 Chow et al. made use of the quadratic phenotypic optimisation platform called QPOP to select a variety of combination therapeutics and to identify high-ranking effective drug combinations for AML patients22 while Jacoby et al. proposed a multi-colour flow cytometry-based predictive precision medicine platform that predicts individual patient responses to standard AML treatments.23 Similarly, there have been studies on the development of targeted therapeutics for different FAB subtypes.24 For instance, FLT3 inhibitors such as midostaurin and gilteritinib have shown promise in FLT3-mutated AML,25 BCL-2 inhibitors such as venetoclax in various AML subtypes26 and different drug combination strategies, such as venetoclax with HMAs, for older AML patients.19
3 DATA PROCESSING AND DRUG SENSITIVITY ANALYSIS
Ex vivo drug-response and multi-omics profiling data from 186 AML patients was obtained from Malani et al.5 The study cohort consisted of a balanced gender distribution of 52.2% females and 47.8% males. The dataset included full clinical patient history with diagnostic workups such as laboratory values, cytogenetics and clinical mutation data. In this study, the dataset was filtered to include 515 drug responses for each individual patient, and only those with identified FAB subtypes were included in the analysis. The patient cohort had different FAB subtypes such as M0 (n = 7 patients), M1 (n = 22 patients), M2 (n = 39 patients), M4 (n = 2 patients), M4 eos (n = 9 patients), M5 (n = 22 patients) and M4/M5 (n = 2 patients). Despite having a very small sample size for both FAB M4 and M4/M5 subtypes, we sought to conduct a preliminary exploratory analysis to identify potential therapeutic strategies. Similarly, the dataset cohort had a vast majority of patients in the 60–80 age group (53.2%, n = 99), followed by the 40–60 age group (29.0%, n = 54). The patient group had minimal representation from the extreme age groups. Only 0.5% (n = 1) of patients were in the 0–20 age range, while 1.61% (n = 3) were over 80 years old. Due to the lack of specific FAB subtype information for patients over 80 years of age, these three individuals were omitted from the analysis. We have assumed patients <60 years (45.2% patients) as younger and ≥60 (54.8% patients) as older. Patients under 60 showed significantly higher drug sensitivity across various FAB subtypes compared to those aged 60 and above (p < .0005).
NPM1 mutations have the highest prevalence in the 60–80 age group (23.8%, n = 19), followed by significant representation in the 40–60 age group (10.8%, n = 8). Similarly, FLT3 mutations demonstrate peak frequency in the 40–60 age bracket (16.2%, n = 12), while maintaining a considerable presence across other age groups. FLT3-ITD mutations show similar distribution patterns with the highest concentration in the 40–60 age group (13.5%, n = 10). Likewise, FLT3-TKD mutations appear more evenly distributed, at lower frequencies though, ranging from 4.1% to 5.7% across the middle age groups. The age distribution analysis shows that the 40–60 and 60–80 age groups hold most mutations. The 20–40 age group shows moderate mutation frequencies, with NPM1 at 8.6% and FLT3 at 11.4%. It is important to note that the 0–20 age group shows a minimal mutation presence except for a striking KIT mutation frequency of 50%, though this represents only a single case. Overall, we can state that the mutation profile was predominantly observed in patients aged 40–80 years, with the highest frequency of NPM1 and FLT3-related genetic alterations in this age group.
We considered statistical significance thresholds to ensure that our reported associations are both meaningful and robust. The dataset was refined to include 515 drug sensitivity scores per patient, categorised by their respective FAB subtype, with statistical significance systematically tabulated to ensure accurate and biologically relevant comparisons. Rather than relying solely on p-values, we incorporated confidence intervals (CIs) and effect sizes to provide a more comprehensive assessment of drug sensitivity differences. The dataset included molecular markers NPM1, FLT3, FLT3-ITD, FLT3-TKD and KIT. Mutation statuses were encoded as binary values (mutated = 1, wild type = 0) for statistical comparisons. Patients were assigned to groups based on their mutation status to evaluate differential drug responses. Patients without drug sensitivity data for a specific compound were excluded from its analysis to ensure statistical validity and consistency across comparisons.
4 RESULTS AND DISCUSSION
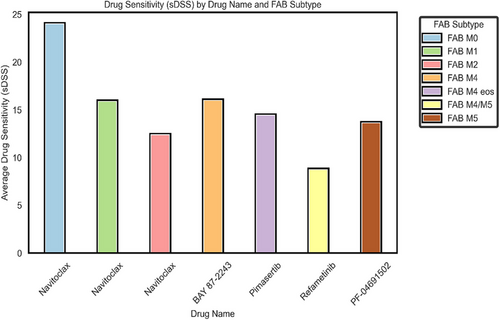
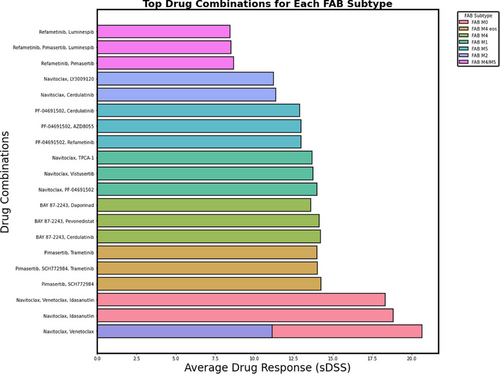
The drug sensitivity and combination analyses revealed distinct patterns across different FAB subtypes. Figure 1 shows the average sDSSs for individual compounds across different FAB subtypes, while Figure 2 presents the effectiveness of various drug combinations stratified by FAB classification. The following sections provide a detailed analysis of these findings, specifically tailored to each FAB subtype.
4.1 Statistical significance across FAB subtypes
To assess drug sensitivity across FAB subtypes, we identified the most effective drug for each subtype based on the highest average sDSS. Statistical comparisons were conducted using Welch's t-test, while synergy was quantified via the Bliss Independence Model to evaluate additive, synergistic or antagonistic interactions. From Figure 1, we observe that navitoclax demonstrated the highest efficacy across multiple FAB subtypes, particularly in FAB M0 (mean sDSS = 24.0, 95% CI: 6.25–41.75), where its activity was significantly different from FAB M4/M5 (p = .0363) but not from FAB M1 (p = .2499) or FAB M2 (p = .1268), suggesting comparable sensitivity among these subtypes. In FAB M2, navitoclax exhibited moderate activity (mean sDSS = 12.39, 95% CI: 9.86–14.92), though no statistically significant differences were observed in pairwise comparisons (p > .05). FAB M4 demonstrated the highest response to BAY 87–2243 (mean sDSS = 15.98, 95% CI: 10.12–21.84), suggesting that mitochondrial inhibition may be particularly effective in this subtype. Similarly, in FAB M4 eos, pimasertib exhibited the highest single-agent activity (sDSS = 14.43, 95% CI: 9.72–19.14), reinforcing the potential role of MAPK pathway inhibition.
Combination therapy analyses revealed enhanced drug sensitivity patterns. In FAB M0, navitoclax in combination with venetoclax resulted in an enhanced drug sensitivity response (sDSS = 20.67, 95% CI: 8.91–32.43). However, the addition of selinexor and LY3009120 reduced efficacy (sDSS = 15.53, 95% CI: 5.27–25.79), highlighting the challenges of optimising combination strategies. Similarly, in FAB M1, navitoclax combined with the PI3K/mTOR inhibitor PF-04691502 demonstrated moderate efficacy (sDSS = 13.97, 95% CI: 9.20–18.74), but the inclusion of TPCA-1 led to diminished returns (sDSS = 11.47, 95% CI: 6.89–16.05, p = .041), suggesting potential pathway redundancies or toxicity-related limitations. In FAB M4, BAY 87–2243 remained the most effective single agent (sDSS = 15.98, 95% CI: 10.12–21.84), while its combination with cerdulatinib maintained strong activity (sDSS = 14.21, 95% CI: 7.34–21.08, p = .058). However, other combinations, such as daporinad + SN-38 (sDSS = 11.09, 95% CI: 5.02–17.16, p = .049), demonstrated limited benefit.
Bliss Independence Model synergy scores provided additional insights into combination effects. In FAB M0, navitoclax + venetoclax exhibited a positive synergy score (4.52), supporting its potential as an effective dual-agent therapy. Conversely, in FAB M1, combinations such as vistusertib + TPCA-1 displayed antagonistic interactions (synergy score = −3.19), indicating that certain drug pairings may counteract each other. Additional statistical analyses, including Levene's test and Kruskal–Wallis H-test (p < .05 and p < .01, respectively), confirmed significant heterogeneity in drug responses across FAB subtypes.
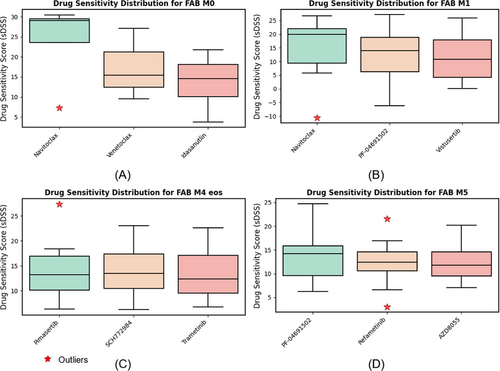
Figure 3 shows box plots comparing DSSs for different drugs across four FAB subtypes of AML. Each plot illustrates the variability in sDSS for three top performing drugs, with outliers marked as red stars. These plots highlight variability in drug efficacy across subtypes and the presence of significant outliers in some cases. FAB subtypes M2, M4 and M4/M5 are excluded from Figure 3 due to insufficient patient samples. Furthermore, due to the limited number of cases in these subgroups, the findings should be viewed as preliminary. The small sample sizes for the M2, M4 and M4/M5 FAB subtypes prevent us from reaching definitive conclusions about these specific categories.
4.2 Mutation co-occurrence patterns
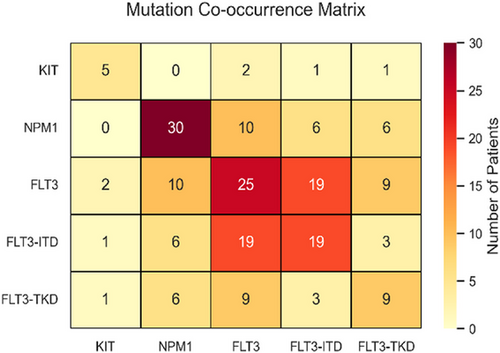
The mutation co-occurrence matrix (Figure 4) highlights key relationships among NPM1, FLT3-ITD, FLT3-TKD and KIT mutations in AML patients. NPM1 mutations are the most frequent (30 cases), followed by FLT3 mutations in 25 cases, with a strong FLT3–FLT3-ITD association (19 cases). Statistical analysis shows significant associations between FLT3 (FLT3-ITD and FLT3-TKD variants), NPM1 and KIT mutations with drug sensitivity (p < .005), reinforcing their therapeutic relevance. FLT3-ITD, found in ∼25% of AML patients, is linked to poor prognosis27 and high relapse risk,28 activating key pathways (STAT5, MAPK, AKT) that drive leukaemia progression.29 NPM1 frequently co-occurs with FLT3 variants (10 cases with FLT3, 6 each with FLT3-ITD and FLT3-TKD), while KIT mutations remain rare (five cases) with minimal co-occurrence.
4.3 Drug response analysis by mutation type
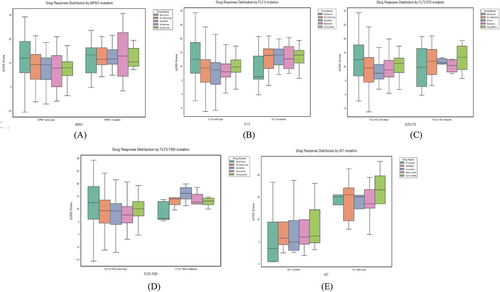
Drug sensitivity analysis revealed distinct patterns of response based on mutation status, summarised below and illustrated in Figure 5. The mutation co-occurrence matrix in Figure 4 presents absolute patient counts, which may differ from the sample sizes in the drug sensitivity analysis. Also, not all patients with identified mutations had corresponding drug response measurements across the full panel of 515 drugs. So, to ensure statistical rigor and comparability, the analysis was conducted using a complete-case approach, where only samples with both mutation status and drug response data were included. The data were assumed to be missing at random rather than missing completely at random, minimising systematic bias in the results. This ensures that the conclusions drawn from the analysis remain statistically robust and generalisable to the broader AML population.
4.3.1 NPM1 mutations
Among NPM1 wild-type patients (n = 30), navitoclax exhibited the highest DSS (sDSS = 11.68, 95% CI: 8.21–15.15), followed by PF-04691502 (sDSS = 7.91, 95% CI: 5.44–10.37). Venetoclax displayed lower sensitivity (sDSS = 6.92, 95% CI: 4.82–9.14) in this group. In contrast, NPM1-mutated patients (n = 12) showed increased sensitivity across all drugs. Venetoclax achieved the highest response (sDSS = 13.28, 95% CI: 9.72–16.84, p < .002), outperforming its wild-type counterpart. PF-04691502 (sDSS = 12.63, 95% CI: 9.13–16.12) and AZD8055 (sDSS = 12.57, 95% CI: 8.21–15.63) also demonstrated increased efficacy. Navitoclax (sDSS = 11.84, 95% CI: 7.02–16.66, p > .05) showed similar responses between the mutated and wild-type groups, indicating broad efficacy.
4.3.2 FLT3 and FLT3-ITD mutations
The FLT3 wild-type group (n = 39) demonstrated highest sensitivity to navitoclax (sDSS = 12.17, 95% CI: 7.89–16.32), followed by cerdulatinib (sDSS = 9.43, 95% CI: 6.58–12.15) and PF-04691502 (sDSS = 8.69, 95% CI: 5.96–11.23). In contrast, FLT3-mutated patients (n = 13) showed significantly higher sensitivity to birabresib (sDSS = 13.41, 95% CI: 9.55–16.90, p < .03) and cerdulatinib (sDSS = 13.22, 95% CI: 8.71–17.64, p < .02).
For FLT3-ITD wild-type patients (n = 41), navitoclax exhibited the highest sDSS (sDSS = 12.03, 95% CI: 8.58–15.98), followed by cerdulatinib (sDSS = 9.97, 95% CI: 6.83–13.11). FLT3-ITD-mutated patients (n = 10) displayed higher sDSS values for PF-04691502 (sDSS = 11.84, 95% CI: 7.44–15.92, p < .001) and TPCA-1 (sDSS = 11.73, 95% CI: 7.33–14.81, p < .005). Birabresib also showed increased activity (sDSS = 11.42, 95% CI: 6.89–14.78). Navitoclax exhibited similar sDSS values across FLT3-ITD subtypes (p > .05), supporting its broad activity.
4.3.3 FLT3-TKD mutations
In FLT3-TKD wild-type patients (n = 46), navitoclax demonstrated the highest sDSS (sDSS = 11.90, 95% CI: 8.24–15.73), followed by cerdulatinib (sDSS = 9.98, 95% CI: 6.72–13.05) and PF-04691502 (sDSS = 9.06, 95% CI: 6.21–12.14). FLT3-TKD-mutated samples (n = 5) displayed significantly higher sDSS values for AZD8055 (sDSS = 15.94, 95% CI: 10.55–19.82, p < .01) and PF-04691502 (sDSS = 14.01, 95% CI: 9.33–17.61, p < .02), suggesting a strong response to mTOR pathway inhibitors.
4.3.4 KIT mutations
Among KIT wild-type patients (n = 5), SCH772984 (sDSS = 15.37, 95% CI: 9.83–18.65) and pimasertib (sDSS = 15.05, 95% CI: 10.22–18.43) exhibited the highest responses. However, KIT-mutated samples (n = 4) demonstrated lower sDSS values across all drugs, indicating potential therapy resistance. Due to the small sample size (n < 5), further analysis is needed to fully characterise drug response patterns in this subgroup.
5 CONCLUSION
This study investigates the relationship between different AML FAB subtypes, genetic mutations and drug responses. Our comprehensive analysis illustrates that therapeutic efficacy varies significantly among FAB subtypes, with navitoclax showing notable drug sensitivity in M0, M1 and M2 FAB subtypes. Similarly, the observed correlation between NPM1 mutations and heightened drug sensitivity emphasises the potential for developing targeted therapeutics tailored to NPM1 genetic profile. For instance, agents like venetoclax, which showed improved efficacy in NPM1-mutated patients, could be prioritised in treatment plans for this subgroup. Likewise, superior response of FLT3-ITD-mutated patients to PI3K/mTOR inhibitors such as cerdulatinib and PF-04691502 highlight the necessity of integrating mutation status into therapeutic strategies.
Similarly, our findings regarding the limitations of multi-agent combinations highlight the importance of a strategic approach to drug selection. The reduction in efficacy observed with complex therapeutic combinations underscores the need for careful consideration of drug's effectiveness and patient tolerability. This necessitates a shift towards more selective and evidence-based treatment regimens, focusing on agents with established effectiveness based on individual genetic profiles. The challenges associated with multi-agent therapies, particularly diminishing returns in efficacy, further reinforce the necessity for strategic drug selection. By incorporating genetic mutation profiling and FAB classification into clinical decision making, we can develop more effective and individualised therapeutic regimens that align with the unique molecular and morphological characteristics of each AML patient, ultimately improving treatment outcomes and patient prognosis. Future studies should focus on larger and more genetically diverse cohorts to further validate these findings.
AUTHOR CONTRIBUTIONS
Mobina Shrestha: Conceptualization, methodology, investigation, visualization, writing original draft and writing–review & editing. Bishwas Mandal: Methodology, investigation, data curation, visualization. Vishal Mandal, Sabin Karki and Reshu Thapa: Investigation, data curation and writing–review & editing.
ETHICS STATEMENT
This research utilizes an open-source dataset under a Creative Commons license, adhering strictly to its terms and conditions. The citation to the data is provided to acknowledge the original creators. The dataset was used in compliance with ethical standards of transparency and accountability.
Open Research
DATA AVAILABILITY STATEMENT
The data that support the findings of this study are available from the corresponding author upon reasonable request.


