Deep learning for predicting synergistic drug combinations: State-of-the-arts and future directions
Abstract
Combination therapy has emerged as an efficacy strategy for treating complex diseases. Its potential to overcome drug resistance and minimize toxicity makes it highly desirable. However, the vast number of potential drug pairs presents a significant challenge, rendering exhaustive clinical testing impractical. In recent years, deep learning-based methods have emerged as promising tools for predicting synergistic drug combinations. This review aims to provide a comprehensive overview of applying diverse deep-learning architectures for drug combination prediction. This review commences by elucidating the quantitative measures employed to assess drug combination synergy. Subsequently, we delve into the various deep-learning methods currently employed for drug combination prediction. Finally, the review concludes by outlining the key challenges facing deep learning approaches and proposes potential challenges for future research.
1 INTRODUCTION
The practice of combining multiple pharmaceutical agents for disease treatment, known as drug combination therapy, is commonly employed for complicated diseases including cancer,1-3 hypertension4, 5 and infectious diseases.6-8 Compared to monotherapy, drug combination therapy offers several advantages such as improved efficacy and reduced side effects and toxicity. However, it is important to note that not all drug combinations exhibit synergistic effects; in fact, some combinations may show antagonistic effects.9 For example, remdesivir with amodiaquine to treat coronavirus disease 2019 shows a strong antagonistic effect.10
Early studies on screening drug combination synergy typically rely on wet-lab experiments, which are characterized by their time-consuming nature and considerable cost implications.11 Furthermore, drug combination trials carry inherent risks of adverse side effects or potentially harmful reactions. Consequently, preclinical strategies have emerged as vital tools for identifying and assessing drug combinations within the context of cancer research.
With the accumulation of large-scale datasets, computational approaches have emerged as an alternative for efficiently screening and prioritizing candidate drug pairs. For example, Li et al.12 proposed a random forests-based method for predicting synergistic anticancer combinations. Meng et all.13 trained an extreme gradient boosting (XGBoost) to predict the synergistic drug combinations using the features by runing struc2vec on protein interaction network. Sidorov et al.14 also proposed an XGBoost-based model, but it trains a unique model for each cell line.
Deep learning-based methods have garnered significant attention across various research domains in bioinformatics, encompassing areas such as drug-target interaction,15, 16 hydrogel design and optimization,17 Organoids18 and drug design.19 These methods employ diverse architectures, including fully connected neural networks (FCNN), convolutional neural networks (CNNs),20 Transformer networks21 and Graph Neural Networks (GNNs),22 which have demonstrated their efficacy in extracting meaningful features from raw data and effective modelling complex and high-dimensional datasets. Consequently, the prediction of drug combination synergy through deep learning approaches has emerged as a promising and advancing trend in this field.
This review comprehensively examines recent applications in the realm of deep learning-based drug combination synergy prediction. We start with an abridged overview of the synergy metrics employed in the drug combination synergy prediction task, alongside the datasets utilized for model development. Subsequently, the review delves into the latest developments in deep learning-based drug combination synergy prediction models. Finally, we outline the limitations and future research.
2 METRICS OF SYNERGISTIC EFFECT IN DRUG COMBINATIONS PREDICTION TASK
In deep learning-based drug combination synergy prediction models, synergy scores serve as the gold standard (label). However, a central challenge lies in the lack of consensus on a universal synergy criterion for characterizing the degree of synergistic effects. While several metrics exist, they each present distinct underlying assumptions and may not comprehensively capture the complexity of drug combinations. Among the most widely used metrics are the Loewe additivity model,23 Bliss independence model,24 highest single agents (HSAs),25 and zero interaction potency (ZIP).26
The expected effect under the ZIP metric is based on the concept that two drugs do not potentiate each other. Except for these metrics, there also exist other metrics including Combination Index (CI),27 S score28 and ComboScore.29 Even though these metrics can provide a view to quantify synergy, no consensus exists. Besides, most of them do not distinguish the potency and efficacy. Recently, multi-dimensional Synergy of Combinations (MuSyC) aims to provide a more consistent and unbiased metric and model with the synergy by enhancing potency and/or efficacy of the single agents.30, 31 Following the MuSyC idea, SynBa uses the Baysian approach to estimate the synergistic.
As deep learning-based models are increasingly applied in real-world settings, the development of a standardized synergy metric becomes even more critical. While efforts towards unifying existing frameworks are ongoing, achieving consensus remains an unresolved issue. In the meantime, it is imperative that deep learning models be evaluated across multiple metrics to demonstrate their efficacy and reliability for future applications.
3 DEEP LEARNING BASED DRUG COMBINATION PREDICTION
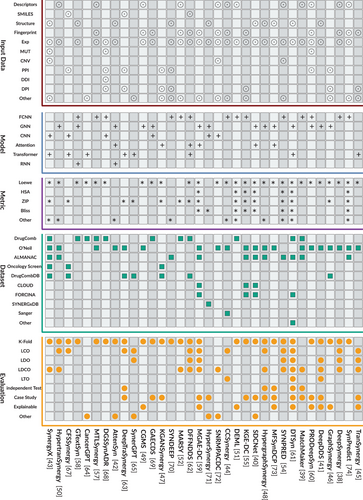
The schematic representation of drug combination synergy prediction is illustrated in Figure 1. The foundational pipeline comprises four distinct stages: dataset preparation, input data processing, deployment of deep learning models, and model evaluation. In the dataset preparation stage, several crucial tasks are undertaken, including the selection of appropriate synergy score metrics and the filtering of the dataset to ensure its relevance and quality. Subsequently, careful consideration is given to the input data for the deep learning models, with an emphasis on capturing the intricate interactions between drugs and their effects. The design of the deep learning models constitutes a critical aspect of the process, requiring meticulous attention to detail to effectively capture the underlying complexities of drug combinations. Finally, the evaluation stage involves assessing the performance of the model using multiple metrics and methodologies to ensure robustness and reliability. we present a detailed investigation in terms of input data, datasets, models and evaluation in Figure 4.

3.1 Datasets
The mechanisms underpinning deep learning-based drug combination prediction models are inherently data-driven, with their performance contingent upon the availability of large-scale datasets. In Table 1, we enumerate several datasets for reference. Except for these six datasets, there also exist some databases such as FORCINA, CLOUD, etc. It should be noted that these datasets show a significant overlap. These datasets play a crucial role in supplying the necessary volume and diversity of data essential for training and validating the predictive algorithms embedded within deep learning models. The accessibility of these drug synergy combination datasets enables the development and refinement of deep learning-based models, thereby advancing research in the field.
It is important to note that the aforementioned drug synergy combination datasets primarily stem from in-vitro experiments and emphasize synthetic compound drugs. However, recent efforts have introduced in-silico models, such as CDCDB, curated from sources like ClinicalTrials.gov.36 Additionally, the NPCDR dataset offers comprehensive molecular regulation data pertaining to natural product-based drug combinations across various disease cell lines and model organisms37. These diverse datasets contribute to a more comprehensive understanding of drug synergy.
3.2 Input data
For deep learning-based models to accurately predict the synergy effects, it is imperative to incorporate relevant drug and cell features into the models. A thorough examination of the features utilized in recent models reveals that they can be categorized into two distinct classes: biological attributes and biological knowledge.
Biological attributes pertain to the inherent characteristics of drugs and cells that directly impact their interactions and subsequent effects. For drugs, common biological attributes include SMILES representations, drug structures, descriptors, and fingerprints. Conversely, for cell lines, key biological attributes encompass gene expression profiles, genomic mutations (MUT), copy number variations (CNV), and other genomic data.
In the domain of deep learning-based models, a variety of methods have been developed that leverage biological attributes to enhance predictive accuracy. DeepSynergy,38 for example, utilizes molecular fingerprints and descriptors to characterize drugs, while gene expression data is employed to profile cell lines. This methodology has consistently demonstrated competitive performance across diverse scenarios. The approach adopted by DeepSynergy has been mirrored in other models such as MatchMaker39 and SDCNet,40 which also rely on similar input data for predictive purposes. Subsequent to DeepSynergy's establishment of this approach, there has been a shift in focus towards innovative representation of drug information. Some recent studies have eschewed the traditional reliance on fingerprints and descriptors, instead opting to model drug structures as graphs. These studies harness Graph Neural Networks (GNNs) to distil structural information from these graph representations. DeepDDS41 and AttenSyn42 exemplify this novel methodology, showcasing the potential of GNNs in capturing the intricate relationships within molecular structures to refine drug synergy predictions. Beyond drug feature exploration, research has also expanded to incorporate multi-omic data for cell line characterization. SynergyX, for instance, integrates six types of omic data, demonstrating enhanced predictive performance.43 The findings from this study suggest that utilizing two or three types of omic data can yield robust results.43 In light of the diverse drug features and varied cell line representations, CCSynergy introduces various levels of bioactivity profiles, providing a foundation for future research endeavours.44
On the other hand, biological knowledge encompasses the vast array of information that has been accumulated through scientific research and experimentation. This includes but is not limited to, known drug-target interactions, and protein-protein interaction networks. Early works like TranSynergy45 and GraphSynergy46 use the PPI network to model the drug and cell line representations. KGANSynergy47 uses multiple drug-related knowledge graphs to construct protein-related knowledge graphs for representing the drug and cell line. Except for the exploration of the external resources, some works also model the drug combination into a heterogeneous graph, such as Hypergraphsynergy,48 CGMS49 and HypertranSynergy50.
3.3 Basic neural networks
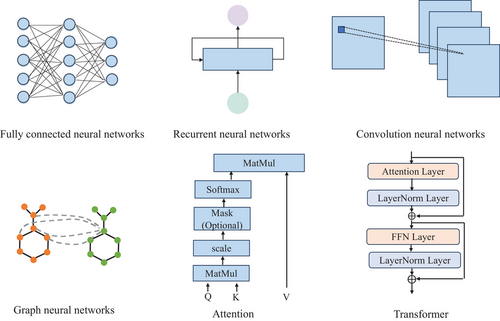
Based on the related drugs and cell line information, modelling the intricate relationships via the neural networks to effectively predict the synergistic effects is a pivotal pursuit and challenging task. This survey aims to review the prevalent deep learning-based methodologies and categorize their underlying neural network architectures into distinct classes: FCNNs, RNNs, CNNs, GNNs, Attention and Transformer. Figure 2 presents the representative structures of these fundamental neural network types.

FCNNs are typically characterized by a set of learned weights and biases applied across all input features, which can be succinctly represented by the matrix multiplication formula , where denote the trainable weight matrix and bias vector, x represents the input features.
3.4 Deep learning based models
In the context of employing deep learning techniques, it is essential to contemplate two principal elements: the backbone architecture of the model and the training objective that guides the learning process. Recent research has witnessed a proliferation of models utilizing backbone architectures such as FCNN, GNN, and Transformers. Regarding the training objectives, single-task learning (STL) and multi-task learning (MTL) have emerged as prevalent strategies. STL models are specifically tailored to optimize the prediction of drug combination synergy. Conversely, MTL models are trained to simultaneously achieve performance on multiple related tasks. These tasks may encompass not only the prediction of synergy but also other pertinent objectives such as drug-drug interaction classification51 and single-drug response prediction.52
The selection of the backbone architecture in deep learning models is primarily influenced by the nature of the drug features and cell line representation. Specifically, when dealing with one-dimensional (1D) data such as molecular fingerprints and gene expression profiles, FCNN often emerge as the architecture of choice. DeepSynergy38 is a representative model that utilizes FCNN and employs concatenated features of drug pairs and cell lines as input. Similarly, AuDNNsynergy53 adopts a comparable FCNN-based network, which incorporates three autoencoders to extract latent features. Principal Component Analysis precedes the input into the FCNN to ensure that the data is represented in a lower-dimensional space, as demonstrated in SynPred.54 KGE-DC55 employs a three-layer FCNN to predict drug combination synergy by integrating information from knowledge graphs (KGs) about drugs and cell lines with molecular fingerprints and gene expression data. Recent models like CCSynergy44 and SynPathy56 also utilize FCNNs but integrate a broader range of drug and cell features to improve prediction accuracy. In contrast to the DeepSynergy architecture, which treats drug pair and cell line features as a single entity, MatchMaker39 introduces a novel FCNN model that uses two subnetworks to individually model the interactions of each drug with the cell line. This design principle has been adopted by MARSY52 and MTLSynergy.57 However, this architecture must satisfy the permutation invariant requirement to ensure consistent predictions regardless of the input order.
Beyond the 1D input data, drug structures and biological knowledge are also utilized as inputs in deep learning models, with GNNs being employed to model these data structures effectively. Drug structures are commonly represented as graphs, where nodes correspond to atoms and edges, represent chemical bonds. This graph representation allows for the application of various GNNs to extract features from the molecular structure, which are crucial for understanding the pharmacological properties of drugs. Studies such as DeepDDS,41 AttenSyn42 and GTextSyn58 have leveraged GNNs to capture these structural features. In contrast to the representation of drug structures, some studies have attempted to design cell line-specific graphs. For instance, MGAE-DC models each cell line as three distinct graphs based on the interactions between drugs.59 This model employs a graph encoder-decoder architecture to capture drug embeddings that are common across different cell lines. Similarly, SDCNet40 constructs unique relational graphs for each cell line and utilizes a relational GCN to learn invariant patterns of drug combinations.
In addition to constructing individual graphs for each cell line, drug combination synergy data can be conceptualized as a graph where drugs and cell lines serve as nodes. CGMS treats this graph as a heterogeneous graph and employs the heterogeneous graph attention network to generate graph embeddings.49 HypergraphSynergy48 and HypertranSynergy50 model this graph as a hypergraph and utilize different hypergraph neural networks to model the synergy prediction task. Furthermore, by incorporating external biological knowledge, early works such as GraphSynergy46 and PRODeepSyn,60 which utilize PPI networks to represent drug and cell line features, have shown comparable performance.
The Transformer architecture has demonstrated its effectiveness across various domains. DTSyn introduces a dual Transformer encoder framework designed to extract correlations among drugs, targets, and cell lines.61 DFFNDDS employs a pre-trained chemical language model that utilizes the Transformer as its foundational element to distil drug features from the SMILES.62 DeepTraSynergy also harnesses the power of Transformers as feature extractors.63 SynergyX takes advantage of the Transformer's capability to model cross-modal biological knowledge.43 Inspired by the success of large language models (LLMs) in natural language processing, several studies have extended the application of LLMs to the domain of drug combination synergy prediction. CancerGPT,64 for example, utilizes LLMs to predict the synergy, demonstrating the potential of transfer learning from language models to biomedical applications. SynerGPT introduces a GPT model to learn drug synergy functions.65
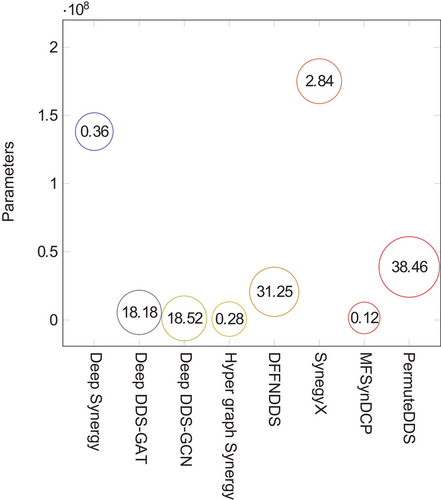
In Figure 3 , we present a detailed report on the parameter count and inference times for a selection of representative models, including DeepSynergy, DeepDDS-GAT, DeepDDS-GCN, HypergraphSynergy, DFFNDDS, SynegyX, MF- SynDCP and PermuteDDS.66 These metrics were obtained using an Intel(R) Xeon(R) Gold 6226R CPU @ 2.90 GHz in conjunction with a GeForce RTX 3090 graphics card. It is important to note that this analysis does not encompass all existing models.


Figure 3 presents a comparative analysis of the efficiency and complexity of the aforementioned models, as measured by their parameter count and inference time, respectively. The ordinate (y-axis) delineates the parameter count for each model, with each represented as a discrete point on the graph. Adjacent to each point, the inference time is annotated, providing a direct indication of the model's operational latency when processing new data. Upon examination of the figure, it is evident that the parameter count varies substantially, extending from approximately 5.86 million parameters for the DeepDDS-GAT model to a more considerable 175 million parameters for the SynegyX model. Con- currently, the inference times exhibit a similarly broad spectrum, with the MFSynDCP model demonstrating the most expeditious performance at roughly 0.12 ms, while the PermuteDDS model exhibits the longest latency, at 38.46 ms.
3.5 Evaluation
- Leave Cell Line Out (LCO): This strategy involves excluding specific cell lines from the training data, enabling assessment of the model's performance across different diseases. LCO variants may exclude a certain percentage of specific cell lines or leave out one cell line entirely.48, 41
- Leave Drug Out (LDO): In this strategy, a single drug is omitted from the training dataset, allowing evaluation of the model's predictive capabilities for the excluded drug. Like LCO, LDO variants may exclude a certain percentage of specific drugs or leave out one drug entirely.
- Leave Drugs Out (LDSO): Similar to LDO, LDPO extends the evaluation to drug pairs, excluding certain drug combinations from the training set to assess the model's robustness.
- Leave Drug Combination Out (LDCO): This strategy involves removing specific drug combinations to evaluate the model's ability to predict the synergy of new drug combinations.
- Leave Tissue Out: By excluding specific tissue types, this approach tests the model's generalizability to different biological contexts.
By simulating challenges such as predicting outcomes in new diseases or with new drugs, these specialized CV strategies better prepare models for clinical use and drug development.
In addition to CV strategies, other evaluation approaches include independent testing,48, 50 case studies39, 43 and explainable experiments.41, 43, 45, 46 Among these experiments, Interpretability is crucial for understanding why a model makes a particular decision. However, there are limitations in current approaches. Some studies evaluate interpretability only through examples, and evaluations often rely on visualizing attention weights43 or Euclidean distances via dimensionality reduction methods,59 lacking a unified standard for systematically assessing interpretability.
4 CHALLENGES AND FUTURE DIRECTIONS
While current deep learning-based models have demonstrated commendable performance in drug combination synergy prediction, it is essential to recognize the limitations inherent in these models. One such limitation pertains to the input features, where the majority of existing models rely on 1D and 2D information, with the 3D structural in the formation of drugs being notably underutilized. Research has indicated that the three-dimensional conformations of drugs are crucial for understanding Drug-Drug Interactions.75
Furthermore, while trained chemical models have been employed with notable success in drug-related tasks, the specialized models such as GraphMVP,76 MolCLR77 and UNI-MOL78 outperform traditional fingerprint and chemical descriptor-based approaches, as well as SMILES-derived representations. These models offer a more nuanced understanding of molecular structures and their pharmacological properties.
In addition to drug features, the representation of cell line features warrants reevaluation. It has been observed that many models exhibit subpar performance under the LCO strategy,49, 59, 54 which suggests a need to rethink the way cell lines are characterized within these models. The LCO strategy is particularly revealing, as it tests the model's generalised ability for real-world applications.
LLMs have demonstrated remarkable efficacy across a spectrum of natural language processing tasks. This success has catalyzed growing interest in the fields of bioinformatics and biomedicine, where researchers are integrating the sophisticated reasoning capabilities of LLMs with biomedical data.79, 80 Notably, initiatives like CancerGPT have begun exploring the application of LLMs for drug combination synergy prediction.64 Concurrently, the evolution of multi-modal LLMs (MLLMs) has extended the capacity to comprehend information spanning various modalities.81– 83 Despite these advancements, the potential of MLLMs in the context of drug combination synergy prediction remains largely untapped.
AUTHOR CONTRIBUTIONS
Yu Wang did a literature search. Junjie Wang and Yun Liu conceived and designed this study. Junjie Wang oversaw the drafting and editing. All authors reviewed the manuscript.
ACKNOWLEDGEMENTS
We thank the reviewers who provided helpful comments on earlier drafts of the manuscript. This work was supported by the National Key R&D Program of China (Grant No.2023YFC3605800) and the National Natural Science Foundation of China (NSFC, Grant Nos. 62271174 and 62102191).
CONFLICT OF INTEREST STATEMENT
The authors declare no conflict of interest.
ETHICS STATEMENT
This article does not contain any studies with human participants or animals performed by any of the authors.
Open Research
DATA AVAILABILITY STATEMENT
No data are available.


