Bulk and single-cell spatial transcriptomic analysis reveals cuproptosis-related molecular subtypes characterized by distinct tumour microenvironment infiltrates in colorectal cancer
Wenqin Luo, Ruiqi Gu, Hongsheng Fang and Ruijia Zhang contributed equally to this work.
Abstract
Background
The association between tumour microenvironment (TME) in colorectal cancer (CRC) and cell death patterns requires further exploration. Cuproptosis may provide new insight into analyzing CRC's TME.
Methods
We used cuproptosis-related genes (CRGs) to stratify the meta-Gene-Expression Omnibus cohort by the “non-negative matrix factorization” consistency matrix algorithm. To clarify the relative abundance of different cells in TME, CIBERSORT and single-sample gene set enrichment methods were performed. Then, CRGs’ transcription in different cell types and the spatial position of CRGs’ enrichment were demonstrated through single-cell spatial transcriptomics (STs) analysis. Prediction of clinical outcomes and response rate of immunotherapy was also conducted by constructing CRG_score.
Results
Three cuproptosis-related TME phenotypes were figured out in CRC with distinctive clinicopathological and prognostic features. Three phenotypes were identical to immune-inflamed, immune-desert and immune-excluded profiles, respectively. Interestingly, cuproptosis-related cluster 3 (CPRC3) phenotype-related gene_score was predominantly upregulated in the fibroblast region, consisting of stromal cells. This result was in line with CPRC3's immune-excluded profile. Based on the robust cuproptosis-related risk_score and nomogram, CRC patients’ clinical outcome and response to PD1/PD-L1 immunotherapy can be well predicted.
Conclusions
This study characterized three cuproptosis-related TME patterns with unique immune infiltration and prognosis in both bulk and single-cell ST profiling. Risk_score was also built to help clinicians decide on personalized anticancer treatment and immunotherapy applications for CRC patients.
1 INTRODUCTION
As one of the malignant tumours with high prevalence worldwide, it is estimated that colorectal cancer (CRC) would cause 28,520 deaths in the USA in 2021.1 Owing to early screening, the overall mortality rate in CRC is declining in recent years. However, 61% of all CRC patients were diagnosed with regional or distant metastasis, when they went to the hospital for the first time. Patients with advanced stages CRC will have a much worse survival rate than those who are in the early stage.2 To improve comprehensive treatment effects and develop novel biomarkers, more research is needed to unveil the heterogeneity of CRC.
Copper (Cu) is required for many essential enzymes and is an essential mineral nutrient in biological processes in human cells, such as mitochondrial respiration, detoxification processes and so on.3 The intracellular Cu concentration must be in a rather small range, in order to perform its physiological function normally. Thus, the regulation of Cu hemostasis in cells is delicate and complex. In terms of cellular intake of Cu, the Cu transporter family (COPT) on the cell surface may play a major role in transferring Cu into a cell.4 Knockout of COPT-related genes greatly decreased the level of Cu and activity of Cu-dependent biological process.5 After intaking, Cu might be transported to the Golgi complex by those high-Cu-binding chaperones and synthesize those Cu-dependent enzymes and proteins.6 Cu could also be delivered to the mitochondria and become a cofactor of cytochrome oxidase.7 To control Cu level inside cells, Cu could be caught by the superoxide dismutase family to eliminate ROS and excess Cu ions.8 Besides, cells can also export cellular Cu by changing Cu-ATPase's subcellular location.9
Cu levels have been found significantly changed in several different cancer patients’ serum and tumour tissue.10 Recently, it is reported that CRC cells could be significantly damaged by overloading intracellular Cu levels.11 Cuproptosis, which is also called Cu-dependent cytotoxicity leading to cell death, had also been proved as a unique cell death form.12, 13 Cuproptosis occurs through the direct binding of Cu to enzymes in carbohydrate metabolism and leads to metabolite disorders. Due to tumour cells’ resistance to apoptosis, some CRC patients couldn't benefit from current anticancer therapy. Therefore, the induction of cuproptosis in CRC cells may become a potential anticancer strategy.14
Vascular system, various cell types and other signalling molecules were made up of the tumour microenvironment (TME), which takes a significant part in the tumourigenesis of CRC.15, 16 For example, CD8+ T cells in TME might function differently resulting from the vast heterogeneity of its cell states and co-stimulatory molecules.17 Based on previous studies, there are immunosuppressive cell populations like myeloid-derived suppressive cells (MDSCs), which helped the initiation and progression of CRC.18, 19 Besides, immune cell infiltration in TME also varies from person to person.20 However, the relationship between TME cell infiltration and cuproptosis has rarely been reported in CRC.
Talking of the recent advance in cancer treatment, immune-checkpoint blockade (ICB) therapy showed great potential in treating CRC, which benefited part of patients in advanced stages CRC.21, 22 Nevertheless, only certain high microsatellite instability (MSI-H) patients could respond to ICB therapy, according to the clinical trials.23, 24 Thus, further investigation into the TME characteristics is needed to find the precise immunotherapeutic markers and targets in CRC. Nonetheless, whether cuproptosis correlated with TME and immunotherapy response in CRC requires further exploitation and discussion.
In this study, we analyzed Gene-Expression Omnibus (GEO) (GSE39582,25 GSE1433326 and GSE3789227), TCGA (COAD/READ), single-cell RNA dataset (scRNA)27 and spatial transcriptomic (ST) databases28 to clarify TME characteristics and phenotypes in CRC, using exclusive proptosis pattern caused by Cu. Three distinctive TME phenotypes in CRC were identified by CRGs. Then, we also tried to verify the consistency of our findings by exploring phenotype-related genes and establishing a scoring system to predict patients’ clinical outcomes and TME characteristics. Our findings may provide new ideas for applying different therapeutic treatments towards different CRC phenotypes.
2 MATERIALS AND METHODS
2.1 RNA expression dataset
Three transcriptomics datasets in our analysis, GSE39582, GSE14333 and GSE37892, were obtained from the GEO database. The batch effects were corrected by the Combat function. After batch effects correction, we integrated these GEO databases. SMC and KUL cohorts in GSE14473523 were included for analysis, which was scRNA data.
We also used COAD and READ cohorts in TCGA to verify our findings. Besides, other data in the TCGA database like somatic mutation were also analyzed. The information was downloaded from the UCSC Xena and TCGA websites. The expression and clinicopathological information of GEO and TCGA datasets are shown in Table S1.
The ST database was obtained from the website21 (http://www.cancerdiversity.asia/scCRLM/).
2.2 Cell viability and migration assays
In cell experiments, DLD1 and SW480 cells were cultured. Cell Counting Kit-8 (CK04; DOJINDO, Kumamoto, Japan) was used to evaluate cell viability. In migration assay, Transwell experiments were performed by cultivating 104–8 × 10⁴ cells with no foetal bovine serum (FBS) into the upper chamber (CLS3464; Corning Costar, Corning, NY, USA), while 500 μl medium with FBS was added in the lower chamber. After 36–72 hours of culturing, migrated cells were fixed with 4% paraformaldehyde (G1101; Servicebio, Wuhan, Hubei, China), stained with Crystal Violet Staining Solution (C0121; Beyotime, Shanghai, China) and counted under a microscope. The primary antibody for western blotting were as follows: anti-CDKN2A (ab185620; Abcam).
2.3 Non-negative matrix factorization classification
We performed a non-negative matrix factorization (NMF) clustering function29 to stratify the meta-GEO cohort into three molecular clusters using cuproptosis-related genes (CRG). The description of clusters is shown in Table S2.
2.4 Consensus molecular subtypes classification
As previously reported,30 CRC could be divided into four consensus molecular subtypes (CMS) subtypes with discrepant molecular and immune characteristics. To delineate the molecular heterogeneity of NMF clusters of CRC, we performed CMScaller31 to classify tumour samples in our cohort. The description of CMS subtypes is shown in Table S2.
2.5 Analyses of TME infiltration
The infiltration and abundance of different cell types in TME were illustrated by CIBERSORT32 and single-sample gene set enrichment (ssGSEA) algorithm.33
2.6 Data processing and visualization of scRNA and ST expression pattern
The NormalizeData function in the Seurat package was used to normalize the filtered expression matrix. Then, clustering was performed using the RunTSNE or RunUMAP function of the Seurat package.
The clustering of ST data was based on the same workflow of scRNA-seq analysis. The clustering information was visualized using Seurat's SpatialDimPlot function.
2.7 Intersection analysis between cuproptosis-related cluster subtypes and ST transcriptomic data
We identified differentially expressed genes (DEGs) of cuproptosis-related cluster (CPRC) subtypes in bulk data by the FindAllMarkers method. DEGs of different clusters in ST were also calculated using the FindAllMarkers function. Firstly, we assessed the statistical significance of the overlapping expression data in both ST genes and scRNA's marker genes. If the p-value < 0.05, it will be regarded as the accumulation of CPRC subtypes in spatial position and then displayed with red color.
2.8 Development of risk_score system
Firstly, the DEGs of three NMF clusters were determined by intersection. Through gene ontology (GO) analyses, we confirmed 134 genes as CRG-related genes. In order to test the function of those genes, we further clustered our patient cohorts into three gene classifications (Table S2).
At last, a 10-gene model, which had the highest frequency, was screened out from all the CRGs and CRG-related genes (Table S3). Then, 10 genes were used to calculate risk_score by the Lasso Cox regression algorithm, as follows:
CRG_score = (-0.176612549* MIS18A's expression) + (-0.127606751* PPID's expression) + (-0.001009568* WDR89's expression) + (-0.477626624235849* RBFA's expression) + (0.0195666084251348* GLI1's expression) + (-0.0256275163114301* TIAL1's expression) + (-0.164256856902423* MYB's expression) + (0.103464404* PPP1R18's expression) + (0.0168481361941815* MLLT11's expression) + (-0.0479459333550557* FUT4's expression).
The median value of CRG_score was the cutoff value to classify patients into different risk groups. Kaplan-Meier (K-M) survival testing and immune analyses were conducted to prove our findings.
2.9 Analysis of immunotherapy cohorts’ expression
PD-L1 inhibitor Atzolizumab (IMvigor210 cohort)34 and PD1 ICB cohort (Liu et al. study)35 were included and normalized into TPM form for analysis. In our study, we mainly analyzed the data which were obtained before pharmacological interventions.
2.10 Statistical analysis and testing methods
R and Graphpad software were mainly used for statistical analysis in our study. In terms of testing methods, The Kruskal-Wallis H test and Wilcoxon test were carried out for three cohorts’ difference and two cohorts’ difference. Results with p-value < 0.05 were considered as the results with statistical difference.
3 RESULTS
3.1 Alteration landscape of cuproptosis genes in CRC
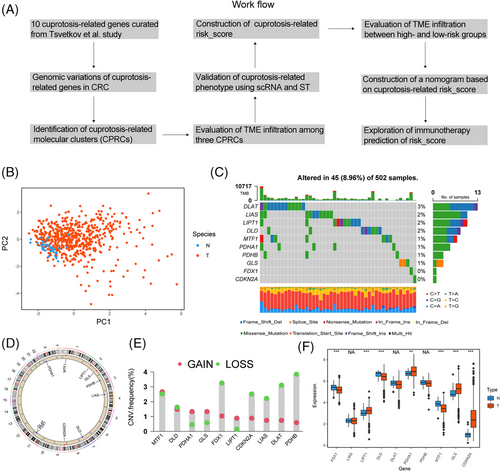
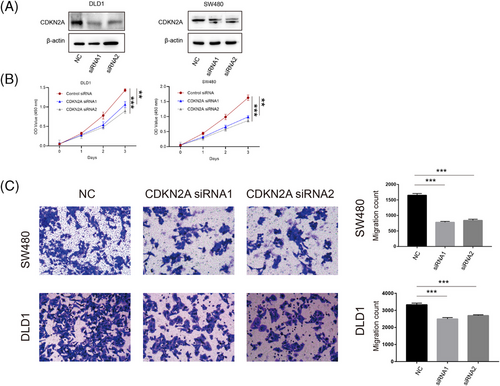
A flowchart systematically describing our research was shown in Figure 1A. First, 10 genes were highly correlated with cuproptosis, reported in Tsvetkov et al. study.36 Principal component analysis (PCA) showed that CRG had a discriminating ability to divide tumour and normal samples in CRC in TCGA (Figure 1B). Next, CRGs’ somatic mutation was identified in 45 of 502 samples in COAD/READ cohorts and DLAT showed the highest mutation rate (3%) (Figure 1C). CRGs’ location of copy number variations (CNVs) on chromosomes were exhibited in Figure 1D. CNV analysis demonstrated that 10 CRGs showed prevalent copy number alterations in CRC (Figure 1E). Based on expression of CRGs in paired tumour-normal tissues, we observed that PDHA1, GLS and LIPT1 were upregulated in the tumour, in line with their CNV amplification. Among genes with CNV deletion, apart from FDX1, the expression of most genes was upregulated in tumour tissue (Figure 1F). Our analysis revealed significant difference in the landscape of genetic alterations of CRGs between CRC and normal colon tissues. To explore the function of CRGs in CRC, we selected a gene upregulated in CRC, CDKN2A, to perform several cytological experiments in vitro. We first transfected CDKN2A siRNAs in SW480 and DLD1 cells and validated the success of downregulation (Figure 2A). Here, we demonstrated that downregulation of CDKN2A significantly prevented tumour cells from proliferation (Figure 2B) and attenuated the cell migration ability (Figure 2C). To sum up, the expression pattern of CRGs is of importance in the tumourigenesis of CRC.
3.2 Cuproptosis-related clusters in CRC
To further delineate transcriptomic patterns of CRGs in CRC, 913 samples from three cohorts (GSE14333, GSE37892 and GSE39582) were merged for further analyses. A network in Figure 2A described the connections and prognostic value of CRGs in CRC. We observed that six CRGs (FDX1, LIAS, DLD, DLAT, PDHB and MTF1) had significant prognostic values by univariate Cox regression and survival analyses in CRC (Figure S1). Notably, CDKN2A could predict a worse prognosis by univariate Cox regression (Figure S1) but had no significant survival prediction.
Next, three distinct subtypes were identified in the meta-GEO cohort using the NMF algorithm (Figure 3B,D and Figure S2A–C), as confirmed by PCA algorithm (Figure 3F). These subtypes were considered as CPRC, including 302 patients in CPRC1, 469 patients in CPRC2 and 142 patients in CPRC3. In survival analysis, patients in CPRC1 showed the best clinical outcome, while patients in CPRC3 were more likely to have shorter survival (Figure 3D; p < .0001). Distribution of clinicopathological features indicated that CPRC3 contained the highest proportion of patients in stage IV (8.45%), while CPRC1 had the maximum numbers of patients in stage I (61.54%), supporting their corresponding prognosis patterns.
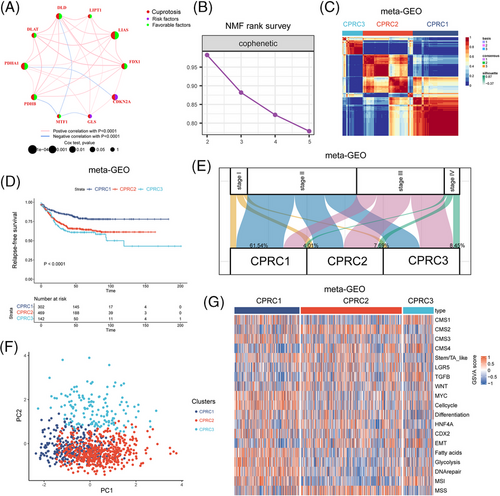
Finally, we evaluated different biological pathway activities between CPRCs, (Figure 3G and Figure S2D). Here, we demonstrated that pathways related to CMS 4-mesenchymal, tumour growth factor β (TGF-β) and epithelial-mesenchymal transition (EMT) were predominantly enriched in CPRC3. Immune-activated characteristics like CMS1 and MSI-related signatures were upregulated in CPRC1. These results highlighted the significant discrepancy of biological function among three CPRCs.
3.3 TME analysis in CPRCs
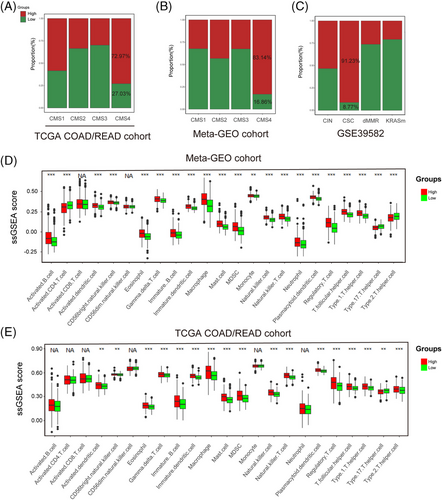
We then turned our attention to TME infiltration in three CPRCs. In Figure 4A,B, we observed that CMS4-mesenchymal and cancer stem cell (CSC) subtypes were mainly clustered into CPRC3, suggesting CPRC3 was characterized by stromal invasion. CMS2-canonical subtypes were predominantly grouped into CPRC2, implying CPRC2 mainly displayed features of epithelial differentiation. Interestingly, CMS1-immune and dMMR subtypes were both concentrated within CPRC1 and CPRC3, suggesting that they were enriched by immune cells. To clearly characterize TME heterogeneity of CPRCs, we scored the meta-GEO cohort using signatures of 23 immune cell types (Figure 4C). This analysis revealed that higher abundance of activated CD8+ T cells were found in CPRC1 and CPRC3. Activated CD4+ T cells were mainly upregulated in CPRC1. However, immune-suppressive cells such as MDSCs and Tregs were mainly accumulated within CPRC3. Therefore, CPRC3 was identified to the immune-excluded phenotype for its stromal invasion and immune-suppressive characteristics. CPRC1 was considered as immune-inflamed, because of its immune activation. CPRC2 was finally referred as immune-deserted phenotype owing to epithelial phenotype.
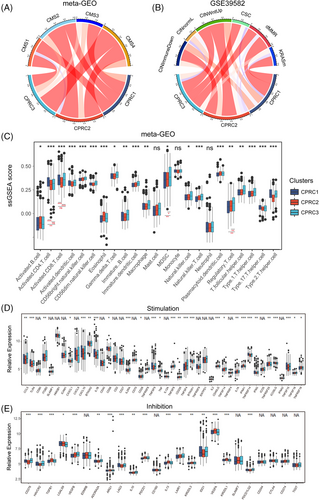
We next explored the expression of stimulatory and inhibitory immune-related genes among CPRCs (Figure 4D,E). The results showed that CPRC1 exhibited higher expression of stimulatory cytokines like interferon-gamma. For inhibitory genes, LAG3, PDCD1, IDO1 were upregulated in CPRC3 but differed in CPRC1. These findings were also in line with immune-activated phenotype of CPRC1 and immune-suppressed phenotype of CPRC3.
3.4 Cuproptosis phenotype-related classification in CRC
To further understand transcriptomic patterns mediated by cuproptosis, we obtained a total of 134 genes by overlapping DEGs from three CPRCs (Figure 5A). According to GO analysis (Figure 5B), we observed that these genes were related to mitochondrial gene expression. Considering that copper-dependent cell death was dependent on mitochondrial respiration, the 134 genes related to mitochondrial biological function could be recognized as cuproptosis phenotype-related signatures. Then, based on cuproptosis phenotype-related signatures, we stratified meta-GEO cohort into three gene-clusters with distinct clinicopathologic features (Figure 5C). By hierarchical clustering (Figure 5C), cuproptosis phenotype-related signatures were clustered into signature genes A, B, C. Based on GO annotation of three signatures (Figure S3), Genes A were referred to as signatures of gene-cluster A, which were related to metabolic process and mitochondrial gene expression. Genes B were grouped into gene-cluster B and associated with GO function like epithelial cell development. Genes C belonged to gene-cluster C, which exhibited biological function such as regulation of mitochondrion organization and stromal-related biological function like regulation of vasculogenesis.
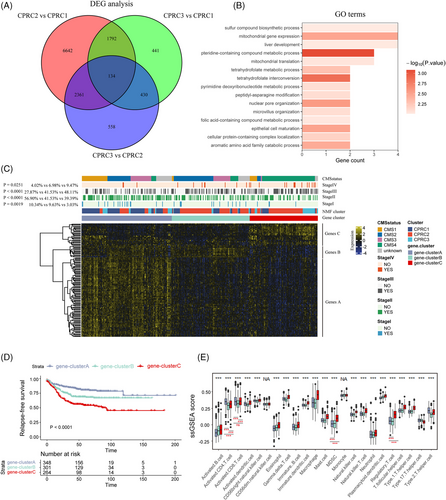
Combining with the clinical information, patients in cluster A were more likely to be in early-stage CRC (10.34% in stage I, Figure 5C, p-value = .0019) and have a better survival (Figure 5D; relapse-free survival [RFS], p-value < .0001). Interestingly, patients in previous CPRC1 were mainly clustered into gene-cluster A. CMS1 subtype was predominantly concentrated within gene-cluster A, also in line with characteristics of CPRC1. Accordingly, CPRC2 and CMS2 subtype were mainly grouped into gene-cluster B (Figure 5C). Finally, the 5-year survival rate of patients in cluster C is the lowest in three clusters (Figure 5D; p-value < .0001), with the most patients in CPRC3, CMS4 subtypes and advanced stage (9.47% of stage IV in gene-cluster C, p-value = .0251). TME analysis showed that activated CD4/8+ T cells were mainly enriched in gene-cluster A, while immune-suppressive cells like MDSCs and Tregs were upregulated in gene-cluster C. Therefore, TME characteristics of gene-clusters were also in line with three CPRCs. Overall, there were three stable transcriptomic patterns mediated by cuproptosis with distinct TME characteristics as follows: immune-inflammed, immune-deserted and immune-excluded.
3.5 Single-cell profiling based on CRG
Considering that single-cell profiling could distinguish immune cells from tumour tissues to improve the understanding of TME characteristics, we performed bioinformatic analyses of single cells subset from tumour samples in a single-cell dataset (SMC and KUL cohorts) of CRC (GSE144735) (Figure 6A,B and Figure S4A,B).
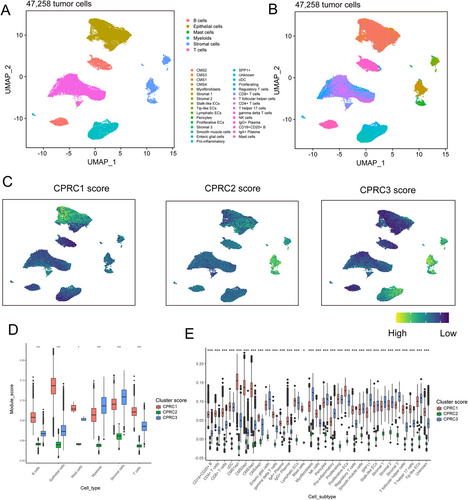
We utilized the DEGs derived from three CPRC subtypes to score single cells (Figure 6C and Figure S4C). The results showed that T/B cells and their cell subtypes were mainly concentrated in CPRC1 (Figure 6D,E and Figure S4D,E), while stromal cells and their cell subtypes (Figure 6D,E and Figure S4D,E) were predominantly enriched in CPRC3. Expectedly, there were few immune cells and their cell subtypes in CPRC2. Overall, these results confirmed the immune-inflamed phenotype of CPRC1, immune-deserted phenotype of CPRC2 and immune-excluded phenotype of CPRC3 at single-cell level.
3.6 Mapping of CPRC subtypes across ST regions
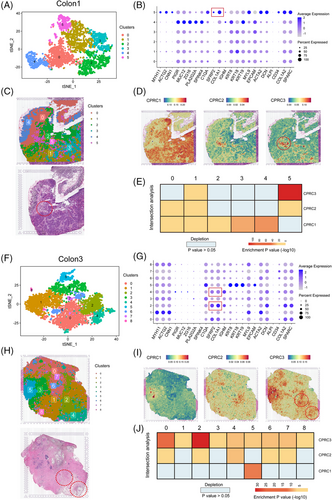
To further validate the phenotype of three CPRCs, we included four CRC tissues (Figure 7A,C,F,H and Figure S5A,C,F,H) with ST to perform several bioinformatic analyses. As previously reported,37 these tissues could be divided into five regions (tumour, fibroblast, lamina propria, smooth muscle and enterocyte) according to cell markers (Figure 7B,G and Figure S5B,G). Interestingly, we found that the clusters expressed fibroblast markers (SFRP2 and COL1A1) in ST data were enriched with CPRC3 DEGs score (cluster 5 of colon1 in Figure 7D, cluster 2/4 of colon3 in Figure 7I, cluster 2 of colon2 in S5D and cluster 6 of colon4 in Figure Figure S5I). Moreover, by intersection analyses as previously described,38 ST region corresponding to fibroblast was significantly enriched with CPRC3-related score instead of other two subtypes. Therefore, ST data could also confirm the immune-excluded phenotype of CPRC3 (cluster 5 of colon1 in Figure 7E, cluster 2/4 of colon3 in Figure 7J, cluster 2 of colon2 in Figure S5E and cluster 6 of colon4 in Figure S5J). However, there were not significant patterns of CPRC1 and CPRC2 in ST data.
3.7 Construction of CRG_score
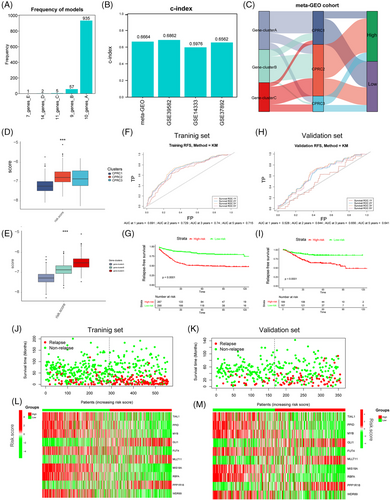
To construct an appropriate signature to calculate CRG_score, we chose GSE39582 as a training set and performed 1000 iterations as previously reported.39 We finally selected a group of 10 genes with the highest frequencies of 935 to generate a signature to construct CRG_score (see methods; Figure 8A). In Figure 8B, we demonstrated the high C-index of four different cohorts to test the consistency of the CRG_score. Then, we set the median value of CRG_score as cutoff point to separate meta-GEO cohort into groups with different risks. The barplot reflected that patients in high-risk group were mainly clustered into previous clusters with the worse prognosis, such as CPRC2 and CPRC3 (Figure 8C), in line with the results of subsequent quantification analyses (Figure 8D,E). The area under the curve (AUC) values of 1-, 2-, 3- and 5-year survival rates in training set (GSE39582) were 0.691, 0.729, 0.74 and 0.715, respectively (Figure 8F). AUC values of 1-, 2-, 3- and 5-year survival rates in validation cohort (combined dataset of GSE14333 and GSE37892) were 0.528, 0.644, 0.656 and 0.641 (Figure 8H). AUC values of 1-, 2-, 3- and 5-year survival rates in the external cohort (TCGA-COAD/READ) were 0.593, 0.619, 0.63 and 0.623 (Figure S6C). The survival analyses showed that patients in high-risk in each dataset had worse prognosis than those in low-risk (Figure 8G,I and Figure S6D). In all datasets, we found that high-risk groups had an increasing relapse and death rates compared with low-risk groups (Figure 8J,K and Figure S6A,B,E,F). The heatmap of 10-scoring genes’ expression between different groups in training (GSE39582), validation (combined dataset of GSE14333 and GSE37892) and the external cohort (TCGA-COAD/READ) are shown in Figure 8L,M and Figure S6G. All in all, our rigorous analysis reflected the survival prediction value of CRG_score.
3.8 Analysis of microenvironment in different risk groups
The molecular characteristics related to immune infiltration were displayed in Figure 9A–C. High CRG_score group was mainly concentrated within CMS4 and CSC subtypes, both of which were related to stromal invasion phenotype, EMT and TGF-β pathways activation. Next, analysis of immune cell abundance showed that patients with high CRG_score were mainly infiltrated by immune-suppressive cells including MDSCs and Tregs (Figure 9D,E). These findings suggested that CRC patients clustered in high CRG_score group might exhibit an ineffective response to immunotherapy. Therefore, CRG_score ,we constructed, might be used for prediction of CRC patients’ response to immunotherapy.
3.9 Constructing the CRG_score nomogram
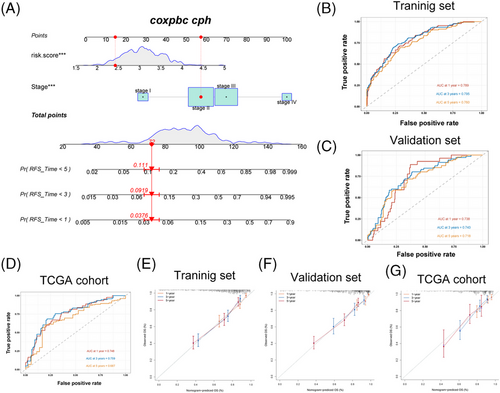
Combing the CRG_score with the TNM staging system, a nomogram was established to predict RFS in GEO datasets and predict overall survival (OS) in TGCA-COAD/READ cohort. The AUC of the receiver operating characteristics (ROC) curve for 1-, 3- and 5-years’ survival demonstrated great prediction value in the training cohort (GSE39582), validation cohort (combined datasets of GSE14333 and GSE37892) and an external validation set (TCGA-COAD/READ) (Figure 10A–D). In training cohort, AUC values at 1-, 3- and 5-year were 0.789, 0.795 and 0.760, respectively. In validation set, AUC values at 1-, 3- and 5-year were 0.738, 0.743 and 0.718. In TCGA cohort, AUC values at 1-, 3- and 5-year were 0.748, 0.759 and 0.687. By compared with AUC values of TNM stage systems, we found that, in training set, AUC values of nomogram at 1-, 3-, 5-year were higher than that of disease stages (Figure S7A). In validation set, AUC values of nomogram at 3-, 5-year were higher than that of disease stages (Figure S7B). In TCGA cohort, the AUC values of the nomogram at 1- and 3-year were also higher than that of disease stages (Figure S7C). These findings implied that our nomogram has a better capacity to predict prognosis compared with disease stages. Finally, the calibration plots of the nomogram shown in Figure 10E–G suggested that our nomogram has a good prediction ability.
3.10 Immunotherapy prediction based on CRG_score
PD-L1 inhibitor Atzolizumab (IMvigor210 cohort34) and PD1 ICB cohort (Liu et al. study35) were added to our study for immunotherapy response analysis. Here, we found that, in IMvigor210 cohort, low-risk group exhibited the better survival rates (Figure 11A) and displayed a more effective clinical response to immunotherapy (64.71% vs. 35.29%; Figure 11B). In Liu et al. cohort, although the difference in responding rates between high- and low-CRG_score groups didn't have statistical significance, while group with a higher CRG_score had the tendency of worse survival and exhibited ineffective response to immunotherapy, compared with low-risk group (53.06% vs. 46.94%; Figure 11C,D). Overall, CRG_score showed an advantage in immunotherapy prediction.

4 DISCUSSION
The relationship between Cu and carcinogenesis has been widely discussed. Researchers have reported Cu ionophores could selectively do harm to cancer cells by upregulating the intracellular level of Cu.24, 40 However, the selectivity and severe side effects of Cu ionophores in treating cancer failed to reach the clinical demand.41 Thus, activating the cuproptosis process in tumours may become a potential anticancer strategy. To provide new therapeutic targets in CRC personalized treatment, the association between CRG and TME characteristics in CRC is needed to be found.
In this study, three distinctive cuproptosis-related TME patterns were first discovered in CRC. We classified CRC samples into three phenotypes, which are CPRC1-3. The CPRC1 featured the activation of immune effector cells and costimulatory molecules, in line with the immune-inflamed phenotype.42 Immune-deserted phenotype20 was highly correlated with the CPRC2, according to its accumulation of CMS2 subtypes. In CPRC3, MDSCs, Tregs and inhibitory immune-related genes were upregulated, consistent with immune-exclude phenotype.20 The association among CRGs’ expression, TME cell population and their spatial position has been validated through single-cell ST analysis on the CRC dataset.
Talking of the TME traits, cytotoxic CD8+ T cells are the backbone effectors in cancer immunotherapy.43 During the activation of CD8+ T cells, many co-stimulatory cytokines and cell-cell interactions are needed.44 Therefore, patients in CPRC1 featuring higher activated CD4+ T cells and CD8+ T cells indicated better immunotherapy response. Though CD8+ T cells were also in high abundance among in CPRC3 group, MDSCs and regulatory T cells could reverse their immune activation process, by generating arginase-1 and other immune-suppress factors to damage the normal function of adaptive and innate immunity.45, 46 However, High expression of LAG3, and PD-1 were also found in CPRC3, which may increase patients’ response towards checkpoint inhibitor-based immunotherapy.47 For patients in CPRC2, CMS2 subtype and microsatellite-stable signature were mostly related, which indicated those patients might not benefit from immunotherapy.48 On the other hand, CRG and its role in carcinogenesis and progression haven't been illustrated sufficiently. Genes like LIPT1, DLAT and FDX1 were distinctive in CPRC1 and gene-cluster A. Those genes closely took part in the energy metabolic process in mitochondria,49 the same as our findings (Figure S3). DLAT were reported to take part in cancer proliferation and carbohydrate metabolic reprogramming in gastric cancer.50 Likewise, FDX1 promote the production of ATP in lung cancer.51 Nonetheless, there is still a lack of synthetical analysis of their role in cancer progression and metabolic reprogramming, especially in CRC. Regarding GLS and CDKN2A in cluster B and C, the high expression of GLS was found in pancreatic ductal adenocarcinoma, which shows a positive relationship with tumour cell proliferation,52 but the relationship between epithelial differentiation in carcinoma and GLS haven't been completely unravelled. CDKN2A hypermethylation is an unfavourable prognostic factor in CRC patients,53 matching the result of gene-cluster C and CPRC3's poor clinical outcome. In short, CRG expression and mutation patterns haven't been well reported and profound experiments are still needed in future work.
To demonstrate the clinical significance of our findings, a stable and concise prognostic CRG_score was built. Patients could be stratified into different groups with different prognoses, and clinicopathological and immunotherapy response statuses. CMS4 subtype, MDSCs and Tregs were observed in the high CRG_score group, contributing to its worse survival rate. In contrast, those cells didn't enrich in the low-risk group. Furthermore, we confirmed the ability of CRG_score in immunotherapy prediction, which showed the clinical application potential of CRG_score. Finally, a comprehensive nomogram was built to improve the accuracy.
To sum up, CRGs’ mutations and expression alterations were first analyzed in CRC. Then, we figured out CPRC and CRG_score. Their correlation with immune infiltration and clinical features in TME were screened out in our research. Nevertheless, our work also has certain shortcomings. This study is mainly based on the public database. Further validation in the multi-centre dataset may better prove our findings. What's more, molecular and cellular experiments may help illustrate our work in the future.
ACKNOWLEDGEMENT
Not applicable.
CONFLICT OF INTEREST
The authors declare that they have no conflict of interest.
FUNDING INFORMATION
This work was supported by the Shanghai Municipal Natural Science Foundation (21ZR1414400), the National Science Foundation of China (81802370) and the Shanghai Sailing Program(18YF1404200).


