Quality Control of Sewage Water in Wastewater Treatment Plants using Raman Technologies
Abstract
The aim of this study is to improve the inline monitoring of wastewater. Two probes, a resonator chamber constructed from aluminum and a 3D-printed hollow sphere crafted from steel with gold coating, are evaluated in comparison with a commercially available probe (Kaiser NCO10.5-VE). The impact on the sensitivity of the probes is illustrated in the Raman spectra. Furthermore, relevant analytes were measured in order to investigate the sensitivity in the ppm range. The effect on the Raman scattering with regard to the cross-sensitivity of the substances to each other and the turbidity of the sample was also investigated. With the help of simple and robust correction methods, the actual substance concentration of the respective analyte can be determined from a Raman measurement.
1 Introduction
According to the Federal Statistical Office [1], 8891 official wastewater treatment plants were in operation in Germany in 2019. These plants treated and discharged 9 billion m3 of wastewater, i.e., approximately 5.1 billion m3 of domestic wastewater and 3.9 billion m3 of external and precipitation water, into surface waters. Recent updates to the EU Urban Wastewater Treatment Directive (91/271/EEC) emphasize stricter nutrient limits (e.g., ≤10 ppm for nitrate and phosphate) and real-time monitoring requirements for wastewater treatment plants. Improving the quality of treated wastewater through further development of measurement and control technology is the focus of the technology presented here.
Wastewater treatment generally takes place in several successive stages, each treatment stage focusing on one type of process. Physical treatment (mechanical removal of coarse impurities) is followed by biological and chemical processes [2].
With the help of microorganisms, organic impurities are broken down and inorganic substances (partially) oxidized during biological purification. This can be achieved using various processes (activated sludge process, trickling filter process, fixed-bed reactor process, etc.). In Central Europe, this is mainly achieved using the activated sludge process [3].
Water constituents in wastewater, such as organic matter, nitrogen, and phosphorus, are not pollutants in the classic sense (e.g., synthetic chemicals or heavy metals) but rather naturally occurring substances that require controlled removal to prevent environmental harm. Excessive levels of these constituents, however, can lead to eutrophication, oxygen depletion, and disruption of aquatic ecosystems, necessitating stringent treatment and monitoring [4].
In aerobic wastewater treatment, microorganisms convert degradable organic components into low-molecular-weight products and inorganic end products (e.g., water, carbon dioxide, nitrate). This is done by microorganisms (special types of bacteria, fungi, and protozoa) [5, 6].
In anaerobic wastewater treatment, carbon compounds are converted to organic acids, methane, and carbon dioxide. Organically bound nitrogen and ammonium are also removed by bacterial nitrification and denitrification [7]. In the downstream abiotic-chemical phase, phosphorus is eliminated primarily by precipitation reactions in order to prevent eutrophication of the water bodies.
The analytics used are constantly evolving in order to increase the efficiency of wastewater treatment plants and the degree of automation, especially in water and wastewater analysis [8, 9]. Optical spectroscopy offers a way of directly obtaining information about the molecular composition of substances [10-12].
Spectroscopic process measurement technology is subdivided into UV/VIS spectroscopy, near-infrared, mid-infrared, fluorescence, and Raman spectroscopy [13]. UV/VIS systems are widely deployed in wastewater treatment plants for monitoring nitrate and organic carbon, though their accuracy diminishes in turbid or multicomponent samples due to overlapping absorption bands [14-16]. In particular, individual measurement techniques often face unique challenges when confronted with the high turbidity, complex matrix effects, and fluctuating composition of wastewater. This gap highlights the need for further research and development to adapt these methods for reliable inline monitoring in wastewater treatment plants.
The lowest detection limits are currently achieved by surface-enhanced Raman spectroscopy (SERS) [17]. Unlike many conventional approaches, our Raman-based measurement method is specifically designed for the harsh environment of wastewater treatment plants [18]. Whereas state-of-the-art UV/VIS and other optical techniques may struggle with signal interference and limited sensitivity under turbid conditions, our system, featuring a novel hollow-spherical measurement chamber combined with advanced signal correction algorithms, delivers reliable quantification below 10 ppm. This is crucial for ensuring compliance with increasingly stringent nutrient limits and for enabling real-time process control. Moreover, the robust design minimizes the impact of matrix interferences and fouling, which are significant challenges in wastewater applications.
VIS spectroscopy is mostly used in applications for differentiating colors, e.g., in dye production. UV or NIR spectroscopy is often employed to analyze the structural composition [10-12, 24]. Trace substances can be easily detected in the UV radiation range. However, the possibilities of UV spectroscopy are limited, as not every molecule has characteristic bands in this wavelength range [20].
Near-infrared spectroscopy reaches its limits with regard to the interpretability of multicomponent mixtures and the associated calibration effort [21, 22]. Misinterpretations, e.g., due to impurities, result in the need for recalibration [11, 23-33].
Raman spectroscopy, which is based on the Raman effect discovered in 1928, is another measurement technique for process analysis and is increasingly being used [29]. Recent developments in the field of detectors have contributed to an increase in the detection sensitivity of the weak Raman scattering [11]. Similar to the mid-infrared spectrum, the Raman spectrum often shows several discrete bands [10, 11].
The main advantages are the non-destructive and non-contact measurement method and the molecule-specific spectra generated [30]. Under certain circumstances, the lasers used can be seen as a disadvantage, as their power can collide with the requirements of explosion protection (DIN EN 60079-28) [31]. In the case of light-sensitive samples, this can lead to their decomposition [30] and considerable safety precautions (DIN EN 60825-1) must be taken. The aim is, therefore, to manage with a low laser power [32, 33].
The focus of this study was the development of two measurement systems and their comparison with an established purchasing system. The chosen approaches pursue the goal of measuring Raman scattering in continuously flowing liquid systems. The influence of special coatings on the effect of deposits and the durability of the probes was also investigated.
By carrying out several series of tests, the change in the measurement signal was demonstrated by varying individual concentrations of the selected analytes. The measurement signal refers to the Raman scattering detected by the spectrometer. The aim was to achieve a detection sensitivity in the ppm range. The original concentrations were reconstructed from the measurement signal using a correction formula.
The cross-sensitivity of the individual analytes to each other was simulated in a series of tests. The effects on the measurement signal were investigated by sequentially adding the substances. The calculation of the individual substance concentrations was realized using the generated spectrum with a correction function.
The influence of turbidity in the flow medium on the measurement signal was also demonstrated by means of experiments. This underlines the innovative development this work aims at. An approach for a highly sensitive, process-robust system for wastewater technology is demonstrated which achieves a detection sensitivity in the ppm range without having to rely on SERS technology.
2 Method
2.1 Raman Effect
The Raman effect is employed for the purpose of quantifying analyte concentrations through the analysis of the manner in which light interacts with matter including reflection, scattering, transmission, and absorption. The absorbed energy is transformed into electrical, thermal, vibrational, or rotational energy depending on the energy required for electron transitions. The vibrational energy, which is quantized and molecule-specific, is dependent on the photon energy and wavenumber which fall within the range of 12 800–200 cm−1. If the photon energy is insufficient, it is converted into rotational energy which is also quantized. These energy transitions entail asymmetric charge movement, whereas in Raman spectroscopy symmetric charge movement occurs [9, 10, 24].
The Raman effect enables quantification through inelastic light scattering. Triatomic molecules exhibit Raman-active vibrational modes critical for detecting wastewater analytes. This phenomenon entails energy exchange leading to frequency shifts, such as the Stokes shift. The weaker inelastic scattering necessitates the filtering out of elastically scattered light to detect Raman photons. Anti-Stokes shifts arise when pre-excited molecules transfer energy to incoming photons resulting in opposite frequency shifts [34].
The energy absorbed within the molecule is transformed into rotational, vibrational, or electronic energy. A pre-excited molecule can release energy to an incoming photon to descend to a lower energy state from a virtual excited state. Consequently, the photon's frequency shifts in the opposite direction, called an anti-Stokes shift [35].
2.2 Analyte Description
Organic substances are broken down by microbiological processes in the biological treatment stage of the wastewater treatment plant. Among other things, nitrate is formed when nitrogen compounds are broken down by the microorganisms. As ammonium nitrate consists of ammonium and nitrate ions, it can be used as an analyte to monitor the progress and efficiency of nitrogen degradation. The presence and concentration of ammonium nitrate in wastewater provide an indication of how well the biological degradation of nitrogen compounds is working and whether the wastewater treatment plant is operating optimally [36, 37].
For this reason, the analytes ammonium nitrate (Roth GmbH, Karlsruhe, Germany, cat#X988.2), ammonium sulfate (Roth GmbH, Karlsruhe, Germany, cat#3746.1), and ammonium dihydrogen phosphate (VWR International GmbH, Bruchsal, Germany, cat#21305.260) were used to validate the measuring chambers. In addition to the described salts, ethanol (Roth GmbH, Karlsruhe, Germany, cat#9065.1) was used to check the general function of the measuring chambers, as it exhibits a strong Raman scattering at 882 cm−1. Calcilit (CALCILIT 65 KA) from Alpha Calcit Füllstoffgesellschaft mbH & Co. KG (Köln, Germany) was employed to measure the turbidity.
Characteristic peaks can be worked out from the Raman spectra of the samples described and can then be assigned to the samples in terms of material. In addition to the experimental determination, these peaks are also found in literature. This is shown in Tab. 1 which describes a baseline used for calculation explained in-depth in Sect. 2.5. The specified detection limits for the individual substances that the treated wastewater must contain are also listed.
| Peak [cm−1] | Baseline [cm−1] | Concentrations [ppm] | |
|---|---|---|---|
| Ethanola) | 882 | 820, 940 | |
| Ammonium nitrateb) | 1047 | 1115 | ≤30 |
| Ammonium sulfatec) | 981 | 1115 | ≤40 |
| Ammonium dihydrogen phosphated) | 881, 1071 | 1115 | ≤6.75 |
- a) [38–40];
- b) [41–45];
- c) [46–48];
- d) [49–51].
2.3 Measurement Technology
The following sections provide a detailed description of the structures and operating principles of the three measurement systems used in this study: the reference system, the resonator measuring chamber, and the hollow-spherical measuring chamber. Each of these systems was specifically developed to optimize the detection of analytes at low concentrations, particularly through the amplification of the Raman scattering. Analyzing the structural components and operational mechanisms of each system provides a deeper understanding of their contributions to improving measurement accuracy and sensitivity within the context of Raman spectroscopy. Raman spectroscopy outperforms UV/VIS in multi-analyte detection, reducing recalibration needs in turbid wastewater matrices (linked to wastewater challenges).
2.3.1 Structure of the Reference System
The probe (Kaiser NCO-0.5-VIS) belonging to the spectrometer (Raman spectrometer “RNX1-532”, Kaiser Optical Systems, Inc., Ann Arbor, MI, USA) is used as a measuring reference in this study. The spectral range covered extends from 100 to 4375 cm−1. For all measurements, the device software was configured with an integration time (exposure) of 10 s and 5 accumulations (Accumc) per measurement point. These settings are critical for the subsequent spectral analysis. The laser beam from the laser unit (532 nm, 150 mW) built into the spectrometer is connected to the probe via fiber-optic connections. Backscattered light can also be transferred into the spectrometer itself by the fiber-optic connection. For sample positioning, a holder belonging to the spectrometer was used in which cuvettes (Helma, article no. 100-10-40) can be positioned in the focus (at 55 µm spot size with 125 mm focal length) of the probe. The cuvette itself can be removed from the holder for loading the appropriate sample. Thus, only stationary measurements are possible. The reference system described contrasts with the development of separate measurement chambers.
2.3.2 Structure of the Resonator Measuring Chamber
Due to the complex measuring task of detecting low concentrations (<10 ppm) with the Raman effect, measuring chambers were developed which shape the excitation light for enhancing the measured Raman scattering as illustrated in Fig. 1. This is achieved by reflecting the light to pass the sample several times and can thus also excite the Raman effect several times.
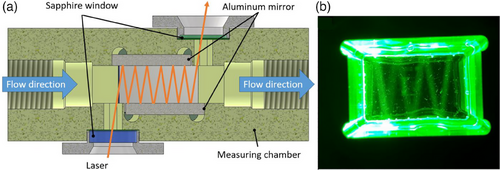
The resonator chamber is a measuring chamber made from an aluminum block which is intended to flood the interior space filled with sample with the highest feasible amount of photons coming from the laser with the help of glued-in aluminum mirrors (Fig. 1a). The measuring chamber can be filled and emptied with a liquid sample through two threaded nozzles. The collimated laser beam is guided laterally through a sapphire glass and an oblong hole with an angle of incidence of 6°. The incoming light is reflected in a zigzag between the glued-in opposing mirrors which are mounted with a slight offset to couple the laser. Another aluminum mirror was glued into the bottom of the cavity. This is used to guide undirected Raman light to the top-mounted detection system. Seven plastic optical fibers (Edmund Optics, Opt Fiber Jacket 1000 µm) are mounted in the cap which is screwed onto the chamber. The fibers are positioned so that each of them is in the path of the reflected laser light in a zigzag pattern (Fig. 1b). Furthermore, the distance between the cap and the mirror bonded to the bottom is at 3 mm. This corresponds to the diameter of the laser which ensures that the sample is covered by laser light at the complete height.
The laser is collimated by a Fixed Focus Collimation Package (Thorlabs, F260SMA-A) and can be transferred to the measurement cell via SMA connector. It exits the measurement chamber through another sapphire glass on the opposite side and can be tapped there for a power measurement, e.g., to assess turbidity effects. Both the screw-in glass and the sealing cap have been provided with sealing surfaces to guarantee flow-through operation without leakage. The seven glass fibers are reduced to one fiber by a self-built transfer to ensure a connection to the spectrometer. The probe (Kaiser NCO-0.5-VIS) belonging to the spectrometer (Raman spectrometer “RNX1-532”, Kaiser Optical Systems, Inc., Ann Arbor, MI, USA) is used as a measuring reference in this study. Fiber-optic connections allow the excitation laser built into the spectrometer to be transferred into this probe. Backscattered light can also be transferred.
2.3.3 Structure of the Hollow-Spherical Measuring Chamber
In order to obtain an increased Raman scattering, a new measuring cell was designed. The hollow-spherical measuring chamber has been manufactured by selective laser sintering using an additive 3D printing process with 316L-A stainless-steel powder with a chemical composition similar to EN 1.4404 and UNS S316603. Connection ports for flow are provided on both sides. Furthermore, a sealing surface is integrated into which an O-ring can be inserted to seal the two halves during flow under line pressure.
The two halves can be screwed together. The rough surface inside the chamber caused by selective laser sintering was smoothed by hand grinding and polishing, as a reflective surface is needed for its scattering properties. Grinding was first performed with diamond grinding paste starting with coarse to fine grits (diamond, special single-grinding paste No. 240 grit 70–28 µm, No. 240 grit 19–3 µm, and No. 1200 grit 7–1 µm). Subsequently, the surface was treated with fiber polishing/lapping film for use with stainless-steel ferrules started with 5 µm to 1 µm grit (Thorlabs, LF5P, LF3P, LF1P) and finally electroplated with gold (Tifoo, gold electrolyte “Flash”) (Fig. 2a).
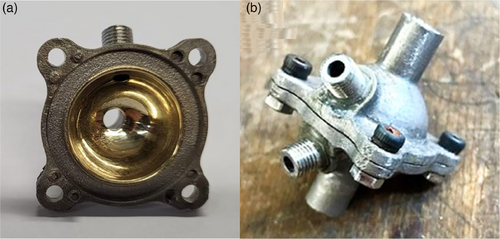
For this purpose, the chamber was prepared for electroplating with degreaser and activator according to the manufacturer's instructions. Furthermore, two inlets were provided at a 45° angle to the through-flow direction into which fiber-optic connectors were glued (Fig. 2b). By screwing in an SMA fiber (Thorlabs, M76L02 – Ø 400 µm, 0.39 NA, Low OH, FC/PC to SMA905 Fiber Patch Cable, 2 m) the fiber is led directly into the hollow-spherical measurement chamber and radiates the excitation light with a numerical aperture of 0.39 into the measurement chamber. Here, the light is reflected by gold-mirrored surfaces many times in the chamber. The second fiber connection allows the spectrometer to be transferred into the system by an optical fiber coupling.
Deposits on the grobe surface impair measurement signals and pose a risk of contaminating analyte samples. To address these challenges, test components with various surface modifications, including stainless-steel and aluminum mirrors, were developed and optimized for optical properties through processes such as electropolishing and gold electroplating. These components were evaluated in a flow chamber designed to promote leading demonstrating that surface refinement significantly reduces deposit formation. Among the tested materials, aluminum mirrors and gold-plated stainless steel exhibited superior performance for optical measurement showing no detectable residues after rinsing with deionized water even following prolonged exposure to sewage water (evaluated with Koyence VHA 6008).
2.4 Measurement Setup
All measurement setups based a separate fiber connection for detection and excitation. The detection was performed using a Raman spectrometer. The spectrometer has an integrated laser unit, which is used as excitation in this study. Both detection and excitation are connected to the corresponding measurement chamber using a fiber optic (Thorlabs, M76L02, Ø 400 µm, 0.39 NA, Low OH, FC/PC to SMA905 Fiber Patch Cable, 2 m) (Fig. 3a). While the corresponding measurement chamber and the probe of the Kaiser spectrometer can only be used in stationary operation, flow-through operation is also possible with the two (Figs. 3b and 3c) in-house designed prototypes. For stationary operation, the prototypes are closed with a 3D-printed stainless-steel plug on one side and filled via the other side. In flow-through operation, sample liquid is pumped in a circuit through the measuring chamber from a beaker with the aid of a diaphragm pump. Stationary operation in the purchased system is performed by inserting a filled cuvette into the sample chamber.

2.5 Evaluation Algorithm
The concentrations used in this study were not calculated based on mass or volume. Instead, the mass mixing ratios of the components are given in relation to the solvent (deionized water). This must be considered when interpreting the ppm values [52].
To achieve the influence of external factors on the measurement setup, a standardized data processing schedule was employed. Raw spectral signals were baseline-corrected by subtracting a reference region. The reference region was selected from a portion of the spectrum with minimal signal variation and was adjusted over a width determined by the full width at half maximum (FWHM) of the reference peak. The same FWHM-based width was used to integrate the intensity of the large peak resulting in variations in the reference region. Finally, the summation of values for both the peak and the reference region was performed prior to subtracting the reference signal.
To ensure a statistical difference between various measurement setups, a standardized test was applied to the regions of the subchannels. The statistical deviation was calculated and visually represented as the thick. This representation enhances the interpretation of the data by illustrating the variations around the mean values. Results provide a clearer indication of the significance of the mean values in distinguishing between different concentrations.
External effects, which are not attributable to the sample itself, are often overlooked in such analyses. These effects can influence both the peak shape and the overall spectrum intensity. To include such influences in the evaluation, a reference region is defined in a part of the spectrum where no significant signal variation is present. Therefore, the regions 820 and 940 cm−1 were used for ethanol measurements, as well as 1115 cm−1 for the other analytes. This approach allows for consistent and reliable comparison of measurements even under complex experimental conditions [53].
2.6 Sample Preparation
To assess the overall functionality of the measurement chambers, a series of measurements was initially conducted using ethanol. These tests were performed in a stationary setup. The measuring chamber was sealed at the bottom with a plug, and the sample was introduced through the remaining opening. The ethanol concentrations in deionized water were 25, 50, 75, and 99.8 vol.-%, as detailed in Sect. 3.1. Following the functionality test, a concentration series of ammonium nitrate was prepared to evaluate the sensitivity of the systems. Stock solutions with concentrations ranging from 10 to 200 ppm in deionized water were prepared and introduced into the stationary measurement setups.
Subsequently, the samples were continuously circulated through the selected measurement chambers. The concentration was increased to 500 ppm by adding stock solutions containing up to 500 ppm of analyte for ammonium nitrate, ammonium sulfate, and ammonium dihydrogen phosphate (Sect. 3.2).
The cross-sensitivity of the Raman scattering was also evaluated in a continuous flow measurement setup. As in the previous experiment, defined quantities of substances were continuously added to the circulated deionized water. However, in this case, a separate measurement series was not performed for each analyte. Instead, the analytes were added sequentially, resulting in an equal concentration of 500 ppm for all analytes in the mixture at the end of the test series (Sect. 3.3).
In addition to assessing the cross-sensitivity of the substances to each other, the cross-sensitivity to matrix effects relevant to the process, particularly turbidity, was tested. For this, deionized water was introduced into the flow-through test setup, and ammonium nitrate was gradually added to achieve a turbidity of 1.5 %. The generated ammonium nitrate concentrations of 5, 10, 20, 50, 100, 200, and 500 ppm were circulated for 5 min to ensure uniform distribution within the system. To induce visible turbidity, 250 mg of Calcilit per liter was added to the system after achieving an ammonium nitrate concentration of 500 ppm. A turbidity value of 134 NTU (Nephelometric Turbidity Unit) was determined using WTW Turb 430 IR (Xylem Analytics Germany GmbH, Weilheim, Germany). Since real-world operational conditions in wastewater treatment plants can impact measurements, it is essential to assess the influence of such effects. Turbidity directly affects optical measurements and is monitored alongside wastewater quality control (Sect. 3.4) [54, 55].
3 Results and Discussion
Raman spectroscopy has gained importance in wastewater monitoring due to its ability to detect key contaminants with minimal sample preparation. Recent advancements allow real-time analysis of ammonium, sulfate, nitrate, and phosphate. Compared to fluorescence techniques, Raman spectroscopy is less affected by water interference and provides detailed molecular fingerprints. However, fluorescence can be more sensitive for certain organic compounds but requires extensive sample preparation. SERS and deep UV excitation help mitigate fluorescence interference in Raman applications. Using SERS for inline Raman monitoring in sewage plants is possible due to its high sensitivity and selective detection, but challenges such as nanoparticle degradation, biofouling, and reproducibility issues limit its practicality for continuous wastewater analysis [56, 57].
3.1 Proof-of-Concept
In this chapter, various ethanol concentrations ranging from 25 to 99.8 vol.-% were spectrometrically analyzed in three stationary measurement chambers (Fig. 4).

The measurements conducted using the Kaiser probe (Fig. 4a) and the hollow-sphere measurement chamber (Fig. 4c) show the expected linear relationship. However, in the resonator chamber (Fig. 4b), the data for the 75 vol.-% ethanol concentration present as outliers. Multiple repetitions of the measurements for each concentration with independent flushing and refilling of the entire system rule out errors due to concentration inconsistencies. Errors in the preparation of the concentration series can also be excluded, as the same samples yielded consistent results in the other measurement chambers.
The intensity values presented are not raw measurements but were processed by calculating the difference relative to a reference region at 820 and 940 cm−1 according to Sect. 2.5. To facilitate comparison between datasets, the graphs were normalized, providing a clearer visualization of differences across measurements between different systems.
In order to assess the general functionality of the measuring chambers, a series of measurements with ethanol were first carried out. These tests were performed in a stationary setup. The measuring chamber was sealed at the bottom with a stopper and the sample was introduced through the remaining opening. The ethanol concentrations in deionized water were 25, 50, 75, and 99.8 vol.-%, as described in Sect. 2.7.
Overall, it can be seen that the resonator measurement system, regardless of the outlier at 75 vol.-%, has the lowest signal intensity and the highest standard deviation. Reliable differentiation, even at high concentrations, is therefore not possible. For this reason, the principle of the resonator chamber is not used for further measurements. The failure of the custom-built chamber may be attributed to several potential issues that could have influenced its performance. Firstly, the alignment of the light path may not have been perfectly straight during the mirror attachment process, resulting in slight tilting that could have led to a significant reduction in signal output. Additionally, refraction effects within the medium might have influenced the results, causing distortions in the measurements. Furthermore, the coupling and collimation of the laser could have deviated slightly from the optimal alignment, potentially introducing errors in signal detection and intensity. These factors could have contributed to the observed performance issues with the chamber.
The comparison between the hollow-sphere measuring chamber and the Kaiser probe shows that the measured intensities are lower with the hollow-sphere measuring chamber, but the standard deviation is significantly smaller. This enables a clear separation of the individual concentrations.
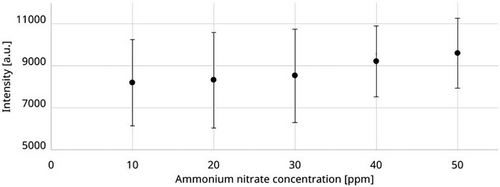
In order to demonstrate the limits of the Kaiser system, a dilution series with ammonium nitrate was carried out instead of the ethanol concentration. The measurement setup remained unchanged in this experiment. The mean values of the measurements (Fig. 5) show a value of 8209 counts at 10 ppm and a value of 9595 counts at 50 ppm. However, the difference between these concentrations is less than the standard deviation, which causes fluctuations of over 2265 counts (up to 27.2 %). This makes a reliable differentiation of the concentrations in this range (10–50 ppm) no longer possible. In the following, the focus is placed on the investigation of the hollow-sphere measuring chamber.
3.2 Flow-Through Measurement of Samples
The sample is continuously transported through the hollow-sphere measuring chamber (Fig. 4c). A constant flow rate of 12.7 L h−1 is achieved using the ALPB 0612 diaphragm metering pump from ProMinent GmbH (Heidelberg, Germany). This approach reduces the influence of potential disturbances, such as deposits of the analyte.
At the end of each run, the entire system is drained and rinsed several times with deionized water. After a suitable drying period, the experiment is repeated multiple times. For each analyte and concentration, the measurement is repeated ten times. The measurement signal is recorded with the spectrometer (Sect. 2.5, integration time 10 s, accumulation 5). The mean value for each analyte concentration is then calculated from the recorded data. These averaged spectra serve as the basis for further signal analysis.
The measurement results, after being calculated using Eq. (1) and Eq. (3) and the parameters from Tab. 1, are presented in Fig. 6.
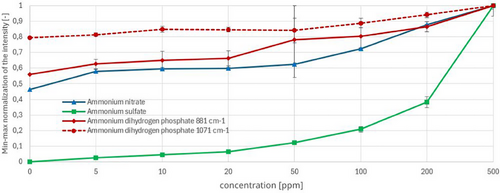
In accordance with the EU Urban Wastewater Treatment Directive (91/271/EEC), the required sensitivity of < 50 ppm was achieved for ammonium nitrate and ammonium sulfate, as the standard deviation remained sufficiently low. However, for ammonium dihydrogen phosphate, the standard deviation was notably high at the 50 ppm concentration, thereby complicating clear differentiation. This is illustrated in Fig. 6.
3.3 Cross-Sensitivity of the Analytes
To assess potential cross-interferences among the different analytes (ammonium nitrate, ammonium sulfate, and ammonium dihydrogen phosphate), spectra were recorded using the measurement setup (purchase probe) described in Sect. 2.6.
A glass cuvette was filled with the sample to be measured and positioned in the measurement apparatus. The measurement chamber was then sealed to prevent light interference, and the measurement was initiated via the software. After the measurement, the cuvette was cleaned and prepared for the next sample.
For each analyte, a separate stock solution was prepared. From these stock solutions, concentration series were created, and individual samples were subsequently developed (Tab. 2).
| Measurement No. | Ammonium nitrate [ppm] | Ammonium sulfate [ppm] | Ammonium dihydrogen phosphate [ppm] |
|---|---|---|---|
| 1 | 200 | 0 | 0 |
| 2 | 400 | 0 | 0 |
| 3 | 600 | 0 | 0 |
| 4 | 800 | 0 | 0 |
| 5 | 1000 | 0 | 0 |
| 6 | 1000 | 200 | 0 |
| 7 | 1000 | 400 | 0 |
| 8 | 1000 | 600 | 0 |
| 9 | 1000 | 800 | 0 |
| 10 | 1000 | 1000 | 0 |
| 11 | 1000 | 1000 | 200 |
| 12 | 1000 | 1000 | 400 |
| 13 | 1000 | 1000 | 600 |
| 14 | 1000 | 1000 | 800 |
| 15 | 1000 | 1000 | 1000 |
The concentration was increased in 200-ppm steps up to 1000 ppm according to Sect. 2.6. The same procedure was performed for each analyte, so that 1000 ppm of each substance was measured with the 15th sample (Fig. 7).
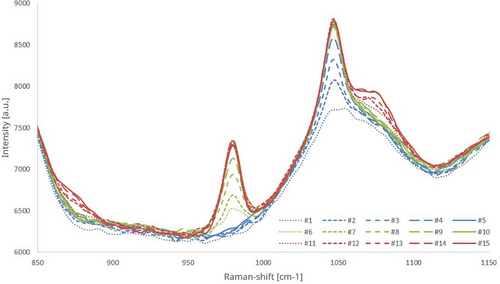
When examining Fig. 7, it becomes evident that upon the addition of ammonium nitrate a peak forms at a Raman shift of 1047 cm−1 (blue graph). Subsequently, the concentration of ammonium sulfate was increased leading to the formation of a peak at 981 cm−1 (green graph), while the ammonium nitrate peak remains unchanged. In the final step, increasing the concentration of ammonium phosphate (red graph) resulted in the formation of corresponding peaks at the associated Raman shifts which do not interact with the other peaks.
The described series of tests was carried out for different sequences of analyte addition in which an identical behavior of the spectra was observed. Although one of the phosphate peaks forms very close to the nitrate peak, sufficient spectral resolution allows for clear separation between the two. Further, the influence of the overlapping region between the peaks at 1047 cm−1 and 1071 cm−1 can be mathematically corrected, complementing a narrow-band analysis. The peak observed at 881 cm−1 demonstrates a correlation with the phosphate component within the transition region. Alternatively, it is conceivable to isolate and analyze only the left flank of the 1047 cm−1 peak and the right flank of the 1071 cm−1 peak to determine concentrations, thereby minimizing cross-sensitivity between the peaks.
This indicates that the substances do not interfere with each other's signals allowing for the independent detection of their respective peaks. The distinct and nonoverlapping peak formation highlights the selectivity and specificity of the measurement system, demonstrating its ability to distinguish between different substances even in mixed samples.
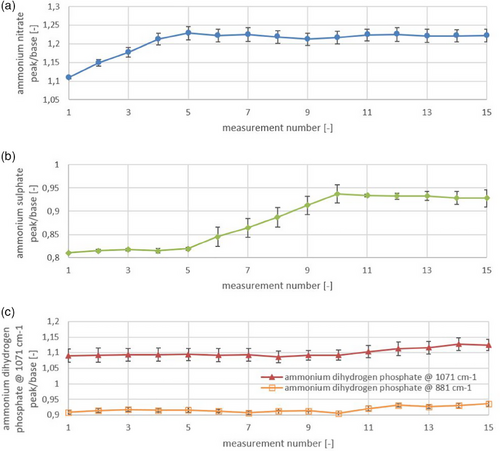
To further emphasize the low cross-sensitivity of the substances, the measured intensities of individual peaks across all dosing steps are visualized in Fig. 8. The intensity values remain relatively constant over time, except during the dosing phases, where a signal increase is observed. This stable behavior underscores the low cross-sensitivity, while the signal increases confirm the proper functionality of the developed measurement principle. In summary, the technique is highly selective, capable of differentiating substances with minimal interference, and responds clearly to changes in concentration, thus verifying its effectiveness.
3.4 Influence of Turbidity
There is a broad signal attenuation across the spectrum impacting the ammonium nitrate peak as well. However, given that turbidity affects the entire spectrum, it is crucial to consider the potential of an offset calculation to mitigate the systemic influence. Upon examining the designated Raman range encompassing approximately 1047 cm−1, it becomes evident that the signal intensifies with rising concentration, yet diminishes with escalating turbidity, posing challenges for concentration correlation. By applying a differential approach, such as calculating the range in contrast with a reference interval like the integral from 1110 cm−1 to 1125 cm−1, the signal attenuation attributed to turbidity can be rectified (Eq. (1)). This method also enables compensation of cross-sensitivities linked to turbidity levels as shown in Fig. 9.
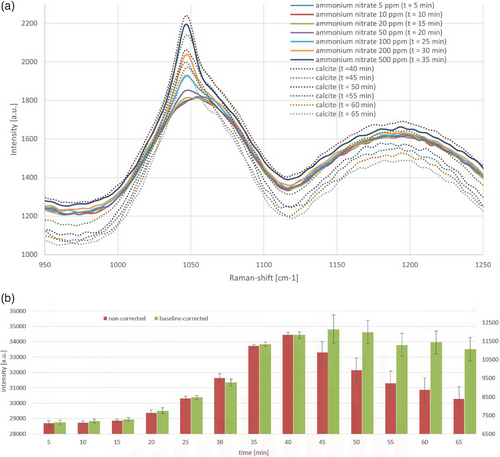
To investigate this issue in more detail, a series of experiments was conducted in which the concentration of ammonium nitrate was incrementally increased every 5 min (5, 10, 20, 50, 100, 200, and 500 ppm). After 35 min, CALCILIT 65 KA was added to the system.
The stepwise increase in ammonium nitrate concentration is clearly reflected in the corresponding rise in signal intensity as depicted in Fig. 9a. Upon the addition of calcite, while the ammonium nitrate concentration remained unchanged, a sudden spike in the signal intensity was observed. The data indicate that this initial increase gradually diminishes over time, eventually dropping below the levels recorded at the point of calcite addition. This phenomenon can be attributed to the system's transient response. When the turbidity-inducing agent is introduced, a significant amount of the substance is initially detected by the probe. However, uniform distribution across the entire system occurs only with increasing time. The effects of turbidity significantly influence the measurement signal and, consequently, the calculation of the analyte concentration.
An analysis of the signal values within the range of 1040 cm−1 to 1055 cm−1 (Tab. 1) allows for the determination of the analyte concentration up to the point of calcite addition. Beyond this point, the data becomes uninterpretable. In contrast, Fig. 9b demonstrates a calculation using a baseline correction from 1100 cm−1 to 1125 cm−1. The amplitude variations of the spectra caused by calcite are due to scattering losses along the optical path of the laser beam in the sample and can be compensated within certain limits as explained in Sect. 3.4. From the time point t = 35 min, a deviation of 794 counts upward (t = 40 min) and 278 counts downward (t = 65 min) was observed (Fig. 9b, green chart). This corresponds to a change in concentration of approximately +100 ppm and –30 ppm, respectively. Without this correction, the unprocessed signal would indicate fluctuations ranging from –30 ppm to +400 ppm (Fig. 9b, red chart).
Our turbidity correction aligns with laser-induced Raman studies in real wastewater [59-61], demonstrating robustness in complex matrices.
These findings suggest that the measurement system is capable of compensating for external disturbances, such as turbidity, by subtracting a reference range within certain limits. However, to ensure robust functionality, the integration of an additional turbidity measurement and its correlation with measurement accuracy is necessary. This should be further validated under real-world conditions. Overall, the results indicate that analyte concentration can be reliably quantified even under challenging conditions.
4 Conclusions
Two innovative measurement cells for the detection of the Raman effect at low analyte concentrations were successfully developed. By carefully selecting materials, fouling was effectively prevented allowing for efficient cleaning and enabling application in wastewater treatment plants for the quality control of treated effluents. The hollow-sphere measurement chamber demonstrated superior performance in differentiating low concentrations leveraging multiple reflections to enhance the Raman scattering. Measurement accuracy below 10 ppm was achieved for the analytes nitrate and sulfate, a crucial threshold for evaluating treated water quality. This is visible in Fig. 6. For both analytes, a low standard deviation and clear signal difference could be achieved even below 10 ppm. Compared to the state-of-the-art probe highlighted in Fig. 5 it is evident that below 50 ppm the standard deviation of measurements is too high to differentiate between the different concentrations. The standard deviation for phosphate measurements remained too high, even when using the prototype probe. However, with the identification of the spectral peak positions, it is possible to implement more sensitive and specific detectors targeting these regions to improve accuracy. This approach is planned for future development, aiming to enhance reliability for all analytes. Additionally, it was confirmed that different analytes do not interfere with one another in the Raman spectrum, enabling simultaneous detection of multiple substances.
The challenge of turbidity in wastewater measurements was addressed by employing a reference range outside the measurement peaks, effectively mitigating its impact on the signal. While the resonator chamber did not produce reproducible results, the hollow-sphere chamber outperformed a commercially available probe (Kaiser probe), particularly in the low-concentration range. Further enhancements in measurement accuracy could be achieved through machine-based manufacturing to improve the reflectivity of the measurement surfaces. Moreover, a transition to photometric measurement could increase sensitivity for specific substances, though this would limit the system's ability to detect unknown substances across a broader spectrum.
In conclusion, while the system has shown promising results under controlled conditions, the next critical step is to validate its performance in a real-world setting. Testing the measurement system in an operational wastewater treatment plant will be essential to assess its reliability and effectiveness under practical conditions. Furthermore, future work will involve testing the system with real wastewater spiked with analytes to evaluate matrix effects beyond turbidity.
Acknowledgment
Open access funding enabled and organized by Projekt DEAL.
Abbreviation
-
- SERS
-
- surface-enhanced Raman spectroscopy


