Atlas of Cerebrospinal Fluid Immune Cells Across Neurological Diseases
Abstract
Objective
Cerebrospinal fluid (CSF) provides unique insights into the brain and neurological diseases. However, the potential of CSF flow cytometry applied on a large scale remains unknown.
Methods
We used data-driven approaches to analyze paired CSF and blood flow cytometry measurements from 8,790 patients (discovery cohort) and CSF only data from 3,201 patients (validation cohort) collected across neurological diseases in a real-world setting.
Results
In somatoform controls (n = 788), activation of T cells increased with age in both CSF and blood, whereas double negative blood T cells (CD3+CD4−CD8−) decreased with age. A machine learning model of CSF and blood immune cells defined immune age, which correlated strongly with true biological age (r = 0.71). Classifying all diseases solely based on the CSF/blood parameters in 8,790 patients resulted in clusters of 4 disease categories: healthy, autoimmune, meningoencephalitis, and neurodegenerative. This clustering was validated in an analytically independent test dataset (8,790 patients) and in a temporally independent cohort (3,201 patients). Patients with multiple sclerosis were more likely to have progressive disease when assigned to the neurodegeneration cluster and to have lower disability in the autoimmune cluster. Patients with dementia in the neurodegeneration cluster showed more severe disease progression. Flow cytometry helped differentiate dementia from controls, thereby enhancing the diagnostic power of routine CSF diagnostics.
Interpretation
Flow cytometry of CSF and blood thus identifies site-specific aging patterns and disease-overarching patterns of neurodegeneration. ANN NEUROL 2025;97:779–790
Cerebrospinal fluid (CSF) is in constant contact with the brain, thus providing a unique diagnostic window into the study of neurological diseases.1 Despite improving imaging techniques, CSF analysis remains indispensable to diagnose common neurological diseases, such as meningitis, small subarachnoid hemorrhage, and leptomeningeal metastases.2, 3 Routine CSF parameters include non-cellular parameters (total protein, albumin, glucose, lactate, and immunoglobulins) and cellular parameters (leukocytes and erythrocytes).2 In most CSF laboratories, leukocytes are only grossly classified as lymphocytes, monocytes, and granulocytes. A more comprehensive flow cytometric analysis is not routinely conducted in most centers, and, consequently, the full potential of CSF cells remains unexploited.
A more detailed CSF immune cell analysis has been performed in individual neurological diseases in the context of studies, including multiple sclerosis (MS),4-6 dementia,7, 8 inflammatory neuropathies,9 and neuropsychiatric lupus.10 These studies demonstrate that a deeper analysis of CSF immune cells can, per se, provide a better pathophysiological understanding and support the differential diagnosis of neurological and other diseases. However, previous studies took a hypothesis-driven approach to classifying the diseases and suffered from small sample sizes.
Immunosenescence describes the age-dependent deterioration of the immune system that leads to a reduced immune response to infection, cancer, and vaccination.11 Age-related immune cell alterations in the blood have been described in several studies.12, 13 Immunosenescence preferentially affects T cell subpopulations in the blood. A recent single cell RNA-sequencing study13 detected that type 2 memory CD4+ and CD8+ T cells, as well as HLA-DR CD4+ memory T cells and GZMK+CD8+ T cells, accumulate with age. In contrast, immunosenescence in the CSF has been poorly studied, and available studies focused on age-associated immune changes in small cohorts of patients with MS.14, 15
Here, we present a large-scale atlas of CSF and paired blood immune cells (n = 8,790 patients) across neurological diseases. We defined immune alterations induced by age, sex, and daytime in the CSF and blood, and found that immunosenescence primarily affects T cells in both compartments. An unsupervised machine learning approach of CSF and blood yielded 4 clusters of disease groups: healthy, autoimmune, meningoencephalitis, and neurodegenerative. The neurodegenerative cluster correlated with clinical signs of underlying neurodegeneration in MS and dementia.
Materials and Methods
Ethics Declarations
This study was approved by the local ethics committee (Ethik Komission Medizinische Fakultät Münster, AZ 2023-113-f-S). The data were collected as part of the clinical routine and pseudonymized for analysis. Therefore, no written patient consent was required according to German law and the ethics committee.
Routine CSF Analysis
Routine CSF parameters, as referred to in the present article, denotes the following parameters: CSF cell count, lymphocytes, granulocytes, erythrocytes, other cells, IgG/A/M ratios, protein, glucose, lactate, albumin, and oligoclonal bands (OCBs). These analyses were performed in a certified clinical laboratory according to standard operating procedures, as described previously.6, 10 For further details, see the Supplementary Methods.
Flow Cytometry
Flow cytometry of the CSF and EDTA-blood were processed in parallel and simultaneously to routine CSF analysis with the same protocol as described previously.6, 10 The staining was performed on a Navios flow cytometer (Beckman Coulter). The flow cytometry raw data were gated by GateNet,16 which is a neural network architecture specifically designed for automated flow cytometry gating. Further details on the automated gating procedure are described in Fisch et al.16 For the downstream analysis, we used percentages, that is, the number of gated events divided by the number of events in the parent gate. Further details are provided in the Supplementary Methods.
Patient Cohort
For the discovery cohort, we retrospectively collected all flow cytometry measurements that were processed in the CSF laboratory of the Department of Neurology of the University Hospital Münster between February 2011 and September 2020 (27,131 measurements). For the validation cohort, we retrospectively collected all flow cytometry data that were processed in the CSF laboratory of the Department of Neurology of the University Hospital Münster between October 2021 and June 2024 (8,036 measurements). Further details are provided in the Supplementary Methods.
Data Cleaning and Imputation
We used R version 4.3.1 for the data analysis. Further details are provided in the Supplementary Methods.
Disease Categorization by International Classification of Disease 10th Edition Codes
In total, discharge diagnoses included 1,121 different principal International Classification of Disease 10th Edition (ICD-10) codes. We manually classified 740 principal ICD-10 codes into 11 broader level 1 and 58 finer level 2 disease categories (Supplementary Table S4).
Data Thinning
Because measurement splitting, and thus model evaluation, is not available in unsupervised clustering, we performed data thinning.17 Further details are provided in the Supplementary Methods.
Uniform Manifold Approximation and Projection and Clustering
We used Seurat version 5.0.118 to perform dimension reduction and clustering because Seurat is a mature and user-friendly package with a wide range of functions to perform unsupervised learning approaches. Although it is primarily used with single sequencing data, it accepts other formats and proved to be a suitable tool in our use-case. Further details are provided in the Supplementary Methods.
Predictive Models
For predictive modeling, we used the tidymodels package version 1.1.1. We used XGBoost, as it represents the current state of the art on tabular data and outperforms deep learning models on tabular data.19 Further details are provided in the Supplementary Methods.
Further Downstream Analysis
More details on further downstream analysis, such as age and sex comparisons, and clinical phenotypes in disease clusters, are provided in the Supplementary Methods.
Results
Automated Gating of Paired CSF and Blood Immune Cells of 8,790 Patients
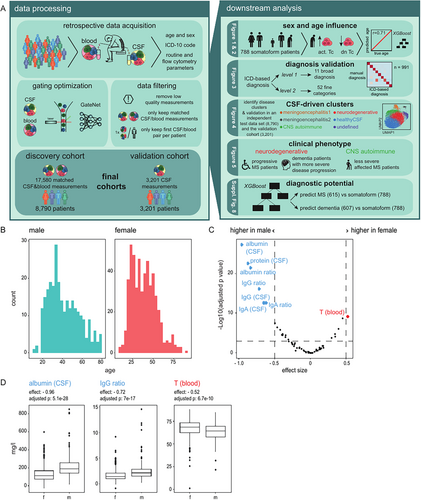
In contrast to most centers worldwide, our center has routinely analyzed the composition of CSF and blood cells in all specimens collected during regular business hours using a standardized multiparametric flow cytometry antibody panel (see the Methods section). We retrospectively identified 12,602 CSF and 14,529 blood flow cytometry measurements in our center analyzed between February 2011 and September 2020 (Fig 1A, Methods). Applying identical flow cytometry gating to all data failed to account for batch effects and technical changes over this long time period. Manually optimizing the gating of 27,131 raw measurements was equally infeasible. Therefore, we used a neural network for optimization of gating that had previously achieved human-level gating performance on a subset of this dataset (n = 127 patients) when compared with 4 independent human experts.16 Because manually curating clinical metadata was also infeasible, we extracted the main final diagnosis (ICD-10 code) coded after discharge by the treating physicians to serve as an approximation of the real diagnosis. We also automatically extracted routine CSF parameters from the medical records, including CSF cell count, lymphocytes, granulocytes, erythrocytes, other cells, IgG/A/M ratios, protein, glucose, lactate, albumin, and OCBs. We removed low-quality measurements (see the Methods section) and those without paired blood or CSF. Measurements with missing CSF results showed similar characteristics compared to those with available paired blood and CSF results (Supplementary Fig S1), indicating that their removal did not introduce bias. Additionally, we kept only the chronologically first CSF/blood pair of measurements from each patient for all analyses to minimize confounders, for example, due to treatment. This resulted in 17,580 matched CSF/blood measurements from 8,790 patients—a dataset of unprecedented size.
Immunosenescence Primarily Affects T Cells in CSF and Blood that Become Activated With Age
We next harnessed the data to understand how sex and age influence the composition of CSF and blood. We used the somatoform group (n = 788) to avoid disease-related effects. This subgroup included 519 female subjects and 269 male subjects; whose age ranged from 8 to 88 years (Fig 1B). We found several parameters that were significantly different (adjusted p < 0.001, effect size > 0.5) between male subjects and female subjects in this cohort after adjusting for age (Fig 1C). The albumin, protein, IgG, IgA, and IgM ratios were increased in male subjects, whereas T cells in the blood were increased in female subjects after correcting for age (see Fig 1C, 1D). In summary, our data suggest that the proportion of T cells in the blood increased in female subjects, whereas the blood-CSF barrier was more permeable in male subjects, a phenomenon described previously.20
We then investigated how age influenced CSF and blood cells. After regressing out sex and adjusting for multiple hypothesis testing, we identified variables that showed a significant linear relationship with age (absolute value of the coefficient >0.01 and p < 0.001; Fig 2A). The parameters that increased the most with age were HLA-DR-expressing CD4 and CD8 T cells in the CSF and blood and the albumin ratio. In contrast, double negative T cells (CD3+CD4−CD8−) in the blood decreased most strongly with age (see Fig 2A,B). Interestingly, CD8 T cells increased in the CSF with age but decreased in the blood (see Fig 2A), suggesting that age-related changes are partially compartment-specific. In summary, our findings indicate that age predominantly induced activation of CD4 and CD8 T cells. Whereas immunosenescence is described in the blood,12, 13 our findings provide insights into CSF-specific age-related effects associated with signs of increased T cell activation across compartments. Additionally, CSF and blood immune cell parameters may need to be corrected for age and sex in the future.
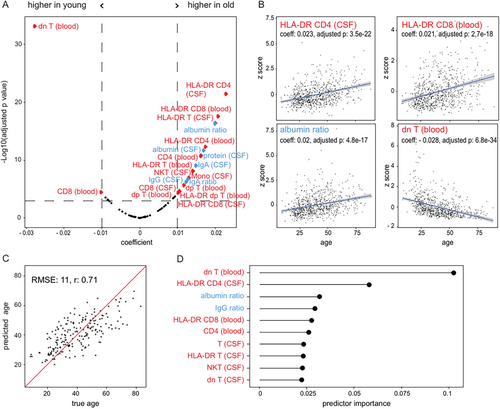
We next inversely asked whether the CSF and blood parameters were sufficient to predict biological age. We trained an XGBoost model21 on 588 patients with somatoform disorders after adjusting the parameters for sex and validated it on the remaining 200 patients with somatoform disorders. The prediction on the independent test patients showed a strong correlation with true biological age (Pearson r = 0.71; Fig 2C). In accordance with our findings depicted in Figure 2A, double negative T cells in the blood were by far the most important predictor of age, followed by HLA-DR expressing CD4 T cells in the CSF (Fig 2D). Collectively, we defined immune age that correlated strongly with true biological age.
Immune Cells in Blood and CSF Show No Relevant Diurnal Variation
Studies have observed a circadian variation of leukocyte subsets in blood22, 23; whether the same is true for CSF remains unknown. Therefore, we investigated variations of the immune cell composition in blood and CSF throughout the day. To exclude disease-related bias, we focused again on patients with somatoform disorders (n = 788). The time of sampling varied between 8 am and 4 pm. However, we did not detect any apparent alterations in the proportions of immune cell populations in either the CSF or blood during this time frame (see Supplementary Fig S1). This indicates that analyzing CSF and blood immune cells is feasible at any time of day. Of note, no nocturnal (4 pm to 8 am) flow cytometry data were available because flow cytometry is only performed during regular working hours at our center, which may account for the lack of diurnal variation.
Categorizing Neurological Diseases From ICD-10 Codes and Manual Validation in 991 Patients
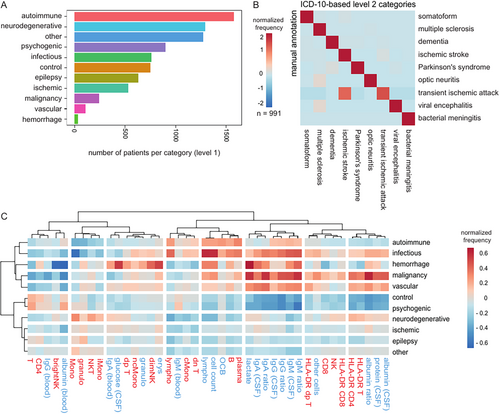
We next aimed to understand disease-related cell patterns. However, the available ICD-10 codes poorly reflect the conceptual classification of diseases in neurology. Therefore, we manually assigned ICD-10 codes into 11 broad categories (named “level 1” classification of diseases; Fig 3A, see Supplementary Table S4) and 52 finer categories (named “level 2”; Supplementary Fig S2). Level 1 categorization included central nervous system (CNS) diseases classified as autoimmune (e.g. MS), neurodegenerative (e.g. dementia and Parkinson's syndrome), psychogenic, infectious (e.g. meningitis), epileptic, control (e.g. idiopathic intracranial hypertension), malignancy (e.g. glioblastoma), ischemic (ischemic stroke and transient ischemic attack), and other vascular diseases (e.g. cerebral venous thrombosis). The frequency of diagnostic categories was overall plausible for patients receiving CSF analysis in our center (Supplementary Fig S3). To validate our approach, 991 patients were manually annotated into the given categories by trained neurologists based on their detailed medical records, and this was compared to their ICD-10-based level 2 diagnostic categories. The ICD-10-based categories were in high agreement with the manually annotated diagnoses (Fig 3B). The only partial mismatch occurred between ischemic stroke and transient ischemic stroke, 2 closely related diagnoses. As a second validation, we plotted and compared alterations of routine CSF (colored in blue) and CSF flow cytometry (colored in red) results in level 1 categories (Fig 3C). As expected, infectious diseases (e.g. bacterial/viral meningoencephalitis) showed an increase in cell count, CSF protein, and Ig ratios, whereas CNS autoimmune diseases (e.g. MS) displayed elevated lymphocytes, OCB, B cells, and plasma cells. Diseases associated with tumors (e.g. leptomeningeal metastasis) showed very high CSF protein and Ig ratios. In summary, our ICD-10-based disease classification provided a plausible approximation of the true diagnosis, and all diagnostic categories showed expected CSF alterations.
Unsupervised Analysis of CSF Yields Disease Clusters of Four Neurological Categories: Healthy, CNS Autoimmune, Meningoencephalitis, and Neurodegenerative
We next speculated that CSF or blood analysis could allow us to classify neurological diseases in an unbiased, data-driven approach—inverse to routine clinical neurology. We combined all parameters (i.e. parameters of the routine CSF analysis, CSF flow cytometry, and blood flow cytometry) of all patients with paired CSF and blood measurements (8,790 patients and 62 parameters). The resulting dataset showed complex between-parameter correlations (see Supplementary Fig S3A). We observed a high correlation between activated T cells in both CSF and blood (see Supplementary Fig S3A), suggesting that the activation of T cells is shared across compartments. Within CSF, one set of highly correlated features showed signs of CSF inflammation (e.g. cell count and lymphocytes). Another set of correlated features showed B cell activity in the CSF (OCB and CSF B and plasma cells). Additionally, immunoglobulin levels/ratios in the CSF, CSF albumin, and CSF protein were highly correlated. In summary, our findings indicate that T cell activation in the blood may serve as a surrogate parameter of CSF T cell activation. However, blood analysis cannot replace CSF sampling in detecting CSF inflammation, CSF B cell activation, or blood-CSF barrier disruption.
We then aimed to identify diagnostic categories in this complex dataset. We performed normalization by ordered quantiles, uniform manifold approximation and projection (UMAP) dimension reduction, and cluster detection using Seurat,18 an established framework for the analysis of single cell sequencing data (see the Methods section). In order to determine the correct number of clusters and validate our approach, we used a data thinning approach,17 which splits an observation into 2 or more independent datasets. We calculated the adjusted Rand index (ARI), which is a statistical measure for agreement between 2 partitions in cluster validation, between the test and train set.
In CSF, the ARI was highest at a clustering resolution of 0.5 (Supplementary Fig 4A), resulting in 6 clusters (Supplementary Fig 4B). We found that the same approach yielded only one cluster in blood (see Supplementary Fig S3B), showing that CSF flow cytometry is superior to blood flow cytometry in categorizing neurological diseases. Next, we aimed to attribute these clusters to diagnoses and parameters in a data-driven approach. We therefore adopted a method which is based on the “term frequency” (see the Methods section). In an effort to identify a unifying disease term for each cluster, we annotated each cluster manually based on the top enriched diseases as “healthy CSF,” “CNS autoimmune,” “meningoencephalitis,” or “neurodegenerative” as abbreviated terms for the respective disease categories. Notably, not all of the enriched diseases within a cluster necessarily align with the simplified term. A first “healthy” cluster showed the highest enrichment for diseases with inconspicuous CSF, such as somatoform diseases and headaches (Supplementary Fig 4C). It showed a relative increase of CD4 T cells in the CSF. A second “CNS autoimmune” cluster was dominated by MS, followed by other infectious or autoimmune CNS diseases (see Supplementary Fig 4C). This cluster displayed a CSF B cell profile (B cells and plasma cells), but also an increase in classical monocytes and double negative T cells (Supplementary Fig 4D). A third “neurodegenerative” cluster was mostly enriched in neurodegenerative diseases, including dementia, Parkinson's syndrome, and mild cognitive impairment, but also contained neuropathies (see Supplementary Fig 4C). As expected, patients in the neurodegenerative cluster were older (see Supplementary Fig S3D, S3E). Therefore, we cannot differentiate whether T cell activation in this cluster is merely age-related, as shown earlier, or also disease-related. In contrast, intermediate monocytes and bright NK cells in the CSF were increased in the neurodegenerative cluster but not in the immunosenescence analysis (see Supplementary Fig 2A), suggesting that they are specific for neurodegeneration. Two further clusters were annotated as “meningoencephalitis 1” and “meningoencephalitis 2” due to their enrichment of bacterial meningitis and viral/other encephalitis. The “meningoencephalitis 2” cluster, as expected, exhibited elevation in various CSF parameters, including cell count, granulocytes, protein, lactate, albumin, and IgM/A/G. In contrast, the “meningoencephalitis 1” cluster showed T cell activation and a less prominent increase in cell count and lactate (see Supplementary Fig 4D). This might be due to a higher enrichment of viral encephalitis and potentially a higher enrichment of bacterial meningitis with a less typical profile, such as neuroborreliosis, compared to the “meningoencephalitis 2” cluster. A last cluster, annotated as “undefined,” did not show a specific disease enrichment (see Fig 4C).
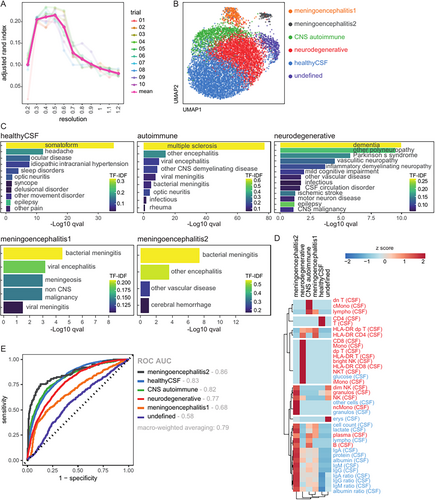
In summary, data-driven analysis of CSF parameters allows an unbiased classification of patients into broad neurological disease categories: healthy, CNS autoimmune, meningoencephalitis, and neurodegenerative.
Dual Validation of CSF Disease Clusters
To validate the CSF clusters, we used 2 methods: first, by predicting the performance on an established data thinning approach,17 and, second, on a temporal validation cohort.
For the first approach, we trained an XGBoost model on the datathin train set (8,790 patients, 10-fold cross validation, and 10 repeats) and predicted its performance on the independent datathin test set (8,790 patients). This approach avoids overfitting the model by “double dipping”24 and provides more reliable performance results. We found that the clusters could be predicted with good performance: receiver operating characteristic area under the curve (ROC AUC) macro-weighted averaging 0.79 (Fig 4E). In each individual one-versus-all comparison, the “healthy CSF,” “CNS autoimmune,” “meningoencephalitis 1,” and “neurodegenerative” clusters showed good performance, as measured by the ROC AUC (see Fig 4E). The model is available on our GitHub repository.
For the second validation approach, we identified a second collection of CSF measurements analyzed in our center between October 2021 and June 2024, which we call a temporally independent validation cohort. Subsequent analysis was performed in the same way as in the discovery cohort, including gating by GateNet,16 removal of low-quality measurements, and retention of only the chronologically first CSF measurement of each patient. This resulted in 3,201 CSF measurements. The manually assigned ICD-10 based level 2 categories had a similar distribution compared to the discovery cohort (see Supplementary Fig S4). We used the XGBoost model trained on the discovery cohort to predict the cluster in these 3,201 measurements based on the CSF parameters and performed disease enrichment. Overall, the disease enrichment in this temporally independent cohort validated our annotations, although the “healthy CSF” cluster did not show significant enrichment (Supplementary Fig S5A), likely due to a smaller sample size.
To assess whether clustering was affected by different technical thresholds, we applied an additional stricter filter (> 500 CD45+ cells), yielding 7,514 measurements. The clustering remained highly similar, indicating that the results are technically robust (Supplementary Fig S5B).
Taken together, we could validate neurological disease categorization and provide a retest-reliable model, which allows predicting disease clusters in future patients.
CSF-Defined Clusters Are Associated with Specific Clinical Phenotypes in MS and Dementia
Because certain diseases were predominant in one cluster but also present in other clusters, we wondered whether cluster membership corresponded to a particular clinical phenotype. We focused on 2 clinically important diseases: MS and dementia. To minimize age-related effects, we first adjusted the data for age. The MS subtype was determined in 409 patients by trained neurologists. We found that patients with MS with a progressive disease course, that is, primary or secondary progressive MS, were enriched in the “neurodegenerative” cluster (Fig 5A). Other clusters with at least 30 patients with MS, the “CNS autoimmune” and “healthy” clusters, were not significantly enriched for a particular subtype. The disability resulting from MS, as measured by the Expanded Disability Status Scale (EDSS), was assessed among 454 patients. Patients with MS in the “CNS autoimmune” cluster had lower EDSS scores and were thus less severely disabled than patients with MS in the remaining clusters (Fig 5B). CSF-based classification thus allows stratifying patients by MS-driven disability.
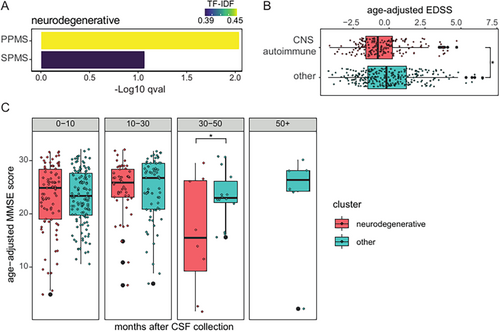
Dementia subtypes were determined in 464 patients and were evenly distributed across all clusters (see Supplementary Fig S5B). Dementia severity, as measured by the Mini Mental Status Examination (MMSE), had been assessed as part of neuropsychological examinations in 266 patients. The MMSE scores did not differ between the “neurodegenerative” cluster and the remaining clusters (Supplementary Fig S5C). Additionally, 354 longitudinal MMSE scores from 231 patients were available. Patients with dementia in the “neurodegenerative” cluster showed a more severe disease progression with a significant decline in MMSE scores beginning 30 months after CSF collection in a linear mixed-effects model (Fig 5C). CSF cell analysis may thus help predict the progression of dementia.
Flow Cytometry Can Support the Diagnosis of Neurological Diseases
Next, we sought to quantitatively benchmark the diagnostic potential of CSF and blood parameters. We utilized an XGBoost model to predict MS (train/test cohort = 461/154 patients) versus somatoform (train/test cohort = 591/197 patients) and dementia (train/test cohort = 455/152 patients) versus patients with somatoform disorders. MS and patients with somatoform disorders could be classified correctly with high sensitivity and specificity with routine parameters only (ROC AUC test cohort 0.9). The performance did not change substantially with the addition of flow cytometry parameters (ROC AUC test cohort 0.91; Supplementary Fig S6A). The most important predictor in both models was OCB in the CSF, followed by plasma cells in the CSF in the combined model and Ig ratios in the routine model (Supplementary Fig S6B, S6C). Classification performance was generally lower when differentiating dementia from somatoform. Interestingly, the combined model was superior to the routine model (ROC AUC test cohort 0.79 vs 0.69; Supplementary Fig S6D). Activated CD4 T cells and NK T cells in the CSF and double negative T cells and activated CD8 T cells in the blood were the most important predictors in the combined model (Supplementary Fig S6E). Adding CSF and blood flow cytometry to the established CSF routine diagnostics can thus improve the accuracy of diagnosing neurological diseases. Flow cytometry of CSF and blood is thus especially valuable in diseases that are difficult to differentiate with routine CSF diagnostics.
Discussion
We present the largest atlas of CSF cells so far, encompassing data from 8,790 patients with paired blood measurements, and we used a data-driven approach to infer knowledge. Age and sex significantly impacted the immune cell composition of CSF and blood. Immunosenescence primarily affected T cells: activated T cells in both compartments increased most strongly with age, whereas double negative T cells in the blood decreased with age. We trained a machine learning model of immune age that correlated strongly with true biological age. Using an unsupervised machine learning approach, we demonstrated that CSF cell analysis allowed classifying patients into clusters that correspond to 4 clinically neurological categories: healthy, CNS autoimmune, meningoencephalitis, and neurodegenerative. These clusters displayed specific immune profiles. We validated the clusters by 2 methods: first using a data thinning approach (8,790 measurements) and second on a temporally independent cohort comprising 3,201 CSF measurements. It has been shown that cytotoxic T cells in CSF contributed to neurodegeneration in dementias25, 26 and predicted disease progression in motor neuron diseases,27 and such CSF alterations become tangible through flow cytometry. In our study, patients with dementia in the “neurodegenerative cluster” tended to progress more rapidly, and patients with MS were more likely to have a progressive MS disease course. CSF cells thus mirror and predict more pronounced neurodegeneration in the brain parenchyma.
Understanding immunosenescence is of increasing importance because of a higher life expectancy and a poor understanding of immunomodulatory therapies in the elderly. The literature describes drastic changes in the peripheral T cell compartments, featuring a reduction of naive T cells11 and an increase of memory-like T cells.11 The most striking age-associated changes in our data were an increase in HLA-DR expressing CD4 and CD8 T cells in both compartments. This indicates that the known increase in HLA-DR expression in the blood28 also applies to the CSF compartment. CD8 T cells in the blood decreased with age, whereas CD8 T cells in the CSF increased with age, indicating compartment-specific immune effects induced by age. An earlier study did not detect age-dependent immune cell alterations in the CSF of the healthy controls,15 which might be due to the lower number of patients (n = 85) compared to our study (n = 788). Our model predicted true biological age and featured double negative T cells in the blood and HLA-DR expressing CD4 T cells as the most important features. Previously, a blood-based immune aging score predicted mortality beyond established risk factors.29 It is tempting to speculate that our model, which represents immune age, is a better predictor of mortality than biological age.
In current clinical medicine, patients are categorized into diagnoses based on their clinical presentations, and biomarkers are then sought to differentiate these diagnoses. Here, we inverted this approach and for the first time sought to identify patterns in neurology purely based on blood and CSF parameters. This data-driven approach enables the discovery of disease groups without relying on prior assumptions, which may be incorrect. Inspired by recent advances in dimensional reduction in single-cell data,30 we used Seurat18 to identify clusters in our large and complex dataset. Recently, other studies have taken similar data-driven approaches to gain better understanding of clinical data.31, 32 We found clusters that corresponded to 4 clinical categories: healthy, CNS autoimmune, meningoencephalitis, and neurodegenerative. Diagnosis in neurology could therefore be rethought driven by CSF analysis. We believe that this data-driven approach becomes increasingly important in the future with progressive data collection and digitalization of medical records.
CSF and blood immune profiles have previously been used to support the differential diagnosis of various neurological diseases.6, 9, 10, 33 However, these studies have mostly focused on differentiating 2 diseases, such as Guillain-Barre syndrome and chronic inflammatory demyelinating polyneuropathy, in a comparatively small number of patients (n = 58).9 A recent study analyzed a larger cohort of 777 manually curated patients, including autoimmune, neurodegenerative, vascular, and non-inflammatory (i.e. somatoform disorders) healthy controls, to develop classifiers for identifying neuroimmunological diseases.6 Here, we utilized a cohort that was over 10 times larger. Our findings support that the combination of established routine CSF diagnostics with CSF and blood flow cytometry parameters can support the diagnosis of common neurological diseases. Additionally, it also allowed stratifying patients for disability. Integration with additional biomarkers, such as neurofilament light chain, which were not available in our cohort, would likely enhance the accuracy of the predictions significantly. We anticipate that the use of predictive models with multiple biomarkers will refine and accelerate diagnosis in the field of clinical medicine in the future.1, 34
Our study is limited by its retrospective design and can therefore not establish causality. The results might be biased by treatment-induced effects. The diagnosis was based on ICD-10 codes and could not be verified in all patients. However, we found few misdiagnoses in nearly 1,000 patients with manually curated diagnoses and reproduced known CSF alterations. To reduce treatment-induced effects, we excluded specimens collected more than 7 days after admission.
Acknowledgments
The authors thank the members of the CSF laboratory of the Hospital of the University of Münster for excellent processing of the patient material. M.H. and G.M.zH. were supported in this project by the Interdisziplinäres Zentrum für klinische Forschung (IZKF) of the medical faculty Münster (MzH3/020/20 to G.M.zH., SEED/016/21 to M.H.). Furthermore, G.M.z.H. was supported by grants from the Deutsche Forschungsgemeinschaft (DFG; ME3050/12-1, ME4050/13-1, and ME4050/8-1). G.M.zH., H.W., and T.K., and their contribution to this project, were in part supported by F. Hoffmann-La Roche Ltd. as part of the Integrative Neuroscience Collaborations Network. A.J. and T.J.B. were supported by a grant from Bundesministerium für Bildung und Forschung (BMBF) (Netzwerk Universitätsmedizin, NUM-DIZ 01KX2121). Open Access funding enabled and organized by Projekt DEAL. The funders were not involved in designing the study, analyzing the data, or writing the manuscript.
Author Contributions
G.M.zH., H.W., and M.H. contributed to the conception and design of the study. A.J., C.C.G., E.S., G.M.zH., H.W., L.F., L.M.M., M.H., N.G., T.H., T.J.B., T.K., and S.M. contributed to the acquisition and analysis of data. A.L.B., C.D., G.M.zH., and M.H. contributed to drafting the text or preparing the figures.
Potential Conflicts of Interest
All authors declare no competing interest.
Open Research
Data Availability
The code used to analyze this data is available at https://github.com/mihem/csf_immune_atlas. The machine learning models are available at https://github.com/mihem/csf_immune_atlas/tree/main/models. The data that support the findings of this study are available on request from the corresponding author. The data are not publicly available due to privacy restrictions.


