Automated Neuroprognostication Via Machine Learning in Neonates with Hypoxic-Ischemic Encephalopathy
Abstract
Objectives
Neonatal hypoxic-ischemic encephalopathy is a serious neurologic condition associated with death or neurodevelopmental impairments. Magnetic resonance imaging (MRI) is routinely used for neuroprognostication, but there is substantial subjectivity and uncertainty about neurodevelopmental outcome prediction. We sought to develop an objective and automated approach for the analysis of newborn brain MRI to improve the accuracy of prognostication.
Methods
We created an anatomic MRI template from a sample of 286 infants treated with therapeutic hypothermia, and labeled the deep gray-matter structures. We extracted quantitative information, including shape-related information, and information represented by complex patterns (radiomic measures), from each of these structures in all infants. We then trained an elastic net model to use either only these measures, only the infants’ demographic and laboratory data, or both, to predict neurodevelopmental outcomes, as measured by the Bayley Scales of Infant and Toddler Development at 18 months of age.
Results
Among those infants for whom Bayley scores were available for cognitive, language, and motor outcomes, we found sets of MRI-based measures that could predict their Bayley scores with correlations that were greater than the correlations based on only the demographic and laboratory data, explained more of the variance in the observed scores, and generated a smaller error; predictions based on the combination of the demographic-laboratory and MRI-based measures were similar or marginally better.
Interpretation
Our findings show that machine learning models using MRI-based measures can predict neurodevelopmental outcomes in neonates with hypoxic-ischemic encephalopathy across all neurodevelopmental domains and across the full spectrum of outcomes. ANN NEUROL 2025;97:791–802
Perinatal hypoxic-ischemic encephalopathy (HIE) affects approximately 1.5 infants per every 1,000 births worldwide and is a major cause of death and neurodevelopmental disability.1 HIE is caused by a disruption in oxygen-rich blood flow to the fetus or neonate in the perinatal period. The implementation of therapeutic hypothermia in neonates with HIE has improved outcomes, but still, nearly half of infants with HIE die or develop neurodevelopmental impairments, including cerebral palsy, cognitive delay, speech and language problems, and behavioral disorders.2-10 Today, brain magnetic resonance imaging (MRI) is routinely used for supporting the diagnosis of HIE and also for neuroprognostication in this population.3, 11-18 In particular, injuries to the deep gray matter (DGM), posterior limb of the internal capsule (PLIC), cerebral peduncles, cortex, and watershed zones have been associated with neurodevelopmental impairment after HIE.11, 13, 15, 16, 18, 19 However, the interpretation of a neonatal brain MRI relies upon extensive neuroradiology expertise, is time-intensive, and subject to inter-rater variability.
Recent developments in radiomics provide a means to quantify brain injury more precisely, and machine learning models can utilize these new neuroimaging measures together with demographic and laboratory parameters to form a more objective prognosis. In this study, we utilized this approach to predict neurodevelopmental outcomes in a single institution cohort of neonates with HIE. We hypothesized that this approach would enhance the accuracy of prognostication.
Materials and Methods
Study Cohort, Demographic. and Laboratory Parameters
This retrospective cohort study was conducted at the Hospital for Sick Children in Toronto, Canada. The Institutional Research Ethics Board reviewed and approved the study protocols and waived informed consent (REB: 1000064940 and 1000079302). There is a growing practice of utilizing therapeutic hypothermia in newborns with mild encephalopathy worldwide.20 In line with this therapeutic drift, newborns with a gestational age of ≥ 35 weeks across the full spectrum of severity of HIE between January 2018 and January 2022 were included in the present study. Newborns with presumed HIE underwent therapeutic hypothermia as per the unit protocol using the following criteria: for newborns with cord or postnatal blood gas within 1 hour of birth showing a pH of ≤ 7.00 or a base deficit of ≥ 16 mmol/L, clinical criteria of neonatal encephalopathy must be present, requiring at least 3 mild, moderate, or severe Sarnat scores.21 If the cord or postnatal blood gas within 1 hour of birth shows a borderline pH of 7.01 to 7.15 or a base deficit of 10 to 15.9 mmol/L, the newborn must also have an Apgar score of ≤ 5 at 10 minutes, or require continued positive pressure ventilation for at least 10 minutes after birth, before assessing the clinical criteria of neonatal encephalopathy. As per our unit protocol, the severity of neonatal encephalopathy was also trended with the Thompson score,22 as an additional assessment alongside the gold standard Sarnat assessment.
Therapeutic hypothermia was initiated within 6 hours after birth and continued for 72 hours, as per institutional protocols, unless, in rare circumstances, discontinued early due to clinical contraindications. The target core temperature was maintained at 33 degrees to 34 degrees Celsius with the whole-body cooling system. Infants were excluded for major congenital anomalies, chromosomal or genetic abnormalities, or neonatal encephalopathy due to causes other than HIE. Basic demographic and laboratory (including biochemical and clinical encephalopathy) measures were obtained from the electronic medical records. Gestational age, birth weight, sex, 5-minute Apgar score, umbilical cord arterial and venous pH, first postnatal gas pH, highest blood lactate within the first 72 hours, and highest Thompson score prior to initiation of therapeutic hypothermia were used. Supplementary Table S1 provides the statistical details of these data for the set of neonates whose data were used to construct a population-specific labeled multi-contrast template; Supplementary Tables S2 through S8 provide the details of these data in the context of each of the prediction analyses. As can be seen in those tables, the prediction analyses utilize only a subset of the infants whose data were used to construct the template. This is largely due to the fact that many of the infants had not yet completed their 18-month assessment at the time that the analyses were performed; but other factors also played a role: a number of infants could not complete their 18-month assessment due to the coronavirus disease 2019 (COVID-19) pandemic; a few families moved away before their infant turned 18 months old; and a small number of infants did not survive. As can also be seen in those tables, there are missing values for many of these measures. These missing data were dealt with using imputation. We used the Multiple Imputation by Chained Equation (MICE) Imputation method in scikit-learn.23 MICE is an advanced missing data imputation technique that uses multiple iterations of a machine Learning model trained to predict the missing values in the data using the known values as predictors.24, 25 We used 10 iterations for each analysis that included variables which had missing values. Additionally, a percentile score of 1 was assigned across all Bayley outcome domains for one infant with severe cerebral palsy (CP) and global developmental delay.
MRI Acquisition and Processing
All neonates (n = 357) underwent brain MRI as near as possible to 4 days after birth, after the completion of therapeutic hypothermia. The MRI scans were acquired on a 3 Tesla scanner (Magnetom Skyra, Siemens Healthcare Limited, Germany) or a 1.5 Tesla scanner (Ingenia, Philips NV, Netherlands) with an age-appropriate head coil. The acquisition protocol on both scanners produced high-resolution 3-dimension (3D) T1-weighted volume(s), and two-dimensional (2D) T2-weighted volumes with high in-plane resolution, but thick slices, in each of axial, coronal, and sagittal orientations. The 3D T1-weighted images were acquired as sagittal slices, with a slice-thickness of 0.5 mm, and an in-plane resolution of 0.4018 mm × 0.4018 mm (echo time 3.52 ms; repetition time 2200 ms). The 2D T2-weighted volumes were acquired with a slice thickness of 3 mm, an in-plane resolution of 0.5 mm × 0.5 mm, and with 3.3 mm spacing between slices (echo time 186 ms; repetition time 5330 ms). In an attempt to obtain usable data, the scan operator might collect multiple T1- and T2-weighted images. We performed quality control on the data, and eliminated data with artifacts, for example, motion. Of the 357 neonates with MRI data, there were 286 infants with acceptable T1- and T2-weighted data; 220 infants acquired on the Siemens scanner, and 66 infants acquired on the Philips scanner. The demographic and laboratory (biochemical and encephalopathy) data for these infants are presented in Supplementary Table S1.
All acceptable T1-weighted volumes were then denoised with DenoiseImage,26 and non-uniformity corrected with N4BiasFieldCorrection.27 If there were multiple acceptable T1-weighted volumes for a subject, one was chosen, and the others were aligned to it with a rigid registration using advanced normalization tools (ANTs).28 All aligned volumes were then averaged, resampled to 0.5 mm iso, and normalized to have intensity values between 0 and 100.
The T2-weighted images were processed with super-resolution code29 to produce 0.5 mm iso volumes. Each such volume was then denoised, non-uniformity corrected, normalized to have intensities between 0 and 100, and then linearly registered to its T1-weighted counterpart using ANTs. All T2-weighted volumes, in all 3 orientations were then averaged.
A brain mask was extracted by providing the T1- and T2-weighted volumes to a convolutional neural network (CNN) trained to do this. The training data for the CNN was progressively constructed by registering the FinnBrain neonate multi-contrast template30 to each subject's T1- and T2-weighted volumes, using the resulting transform to bring the mask from the Finnbrain template to the subject, and then, if the result was approximately correct, manually correcting the result and adding it to the training set. Training of the CNN continued until it produced acceptable brain masks for each of the neonate T1- and T2-weighted volume pairs. The resulting brain masking tool can be found at https://gin.g-node.org/johndlewis/HIE/Tools/BET-CNN.sh.
Template Construction and Use
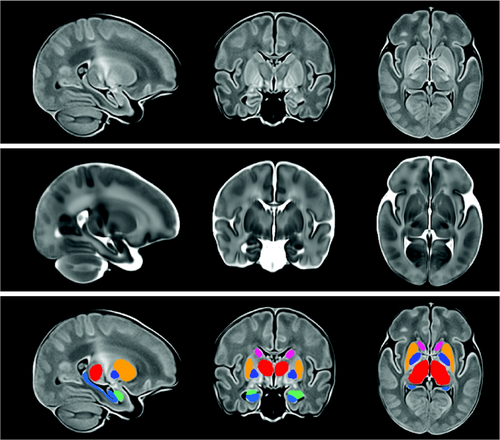
Once we had masked, denoised, and non-uniformity corrected the T1- and T2-weighted volumes for each subject, we then provided these data to the ANTs script antsMultivariateTemplateConstruction2.sh, which we ran in 4 stages to create a population-specific brain multi-contrast template. First, we ran it with the FinnBrain neonate T1- and T2-weighted template as a target, and used rigid registration to build a population-specific target for our data. Second, we ran affine registration, starting from the template arrived at via rigid registration. Third, we ran the nonlinear SyN registration method with the result of the second stage as the target. This new population-specific neonatal brain multi-contrast template was then linearly and nonlinearly registered to the multi-contrast neonatal template from the FinnBrain Birth Cohort Study30 using ANTs. The inverse of the resulting transformation was then used to overlay the labels from the FinnBrain neonatal template on our new population-specific neonatal brain template. Our final template is shown in Figure 1, with the T1-weighted volume shown on the top, the T2-weighted volume below, and the T2-weighted volume with the labels overlain on the bottom. These labels, as well as labels for the left and right PLIC, were overlaid on individual subjects by linearly and nonlinearly registering the subject data to the template, then using the inverse of the resulting transform to take the template labels back to the subject. Once the labels were on a subject, the geometric measures were taken by running LabelGeometryMeasures and the radiomic features of both the T1- and T2-weighted volumes for each structure were taken by running pyRadiomics, with each label as a mask31-33; this was done separately for both hemispheres. Radiomics capture complex patterns that may fail to be seen with the naked eye,34 including features of the image intensity histogram; the relationships between image voxels; neighborhood gray-tone difference derived textures, and features of complex patterns. Descriptions of each of the radiomics measures can be found in the pyradiomics documentation.
Analysis of Relation Between Measures and Outcomes
Gestational age, sex, and the laboratory measures, or the MRI-based measures, or the combination, were input to a linear regression model to predict 18-month neurodevelopmental outcomes. The regression model was used to predict 7 different outcome scores on the Bayley Scales of Infant and Toddler Development, third edition (Bayley-III) at 18 months corrected age: cognitive, receptive language, expressive language, composite language, gross motor, fine motor, and composite motor.
The linear regression model utilized Elastic-Net penalized linear regression. Elastic-Net is designed to balance 2 approaches to regularization of the coefficients: the approach used in Lasso regression, and the approach used in Ridge regression.35 Ridge regression adds the sum of the squares of the coefficients to the sum of squares of the residuals. That keeps the coefficients small, but keeps all variables in the model. Lasso regression adds the sum of the absolute value of the coefficients. That allows some coefficients to go to zero; thus, some features of the data may be ignored. Elastic-Net aims for a balance which allows for learning a sparse model where few of the weights are non-zero, and the coefficients are generally kept from becoming large. This balance is controlled by hyperparameters that determine the size of the penalties that are incurred, and the weighting between the choices. We used 10-fold cross-validation to ensure that our results generalize; and within each fold we used 10-fold cross-validation to find the best hyperparameters. For each outer fold, the elastic-net model is fitted on the training data, and predictions made for the testing data, that is, data that the model has not been fitted for. To quantify the performance of the linear regression model, we used 3 evaluation metrics: the correlation coefficient (R) between the predicted and observed outcomes; the coefficient of determination (𝑅2), which is an estimate of the proportion of variance in the observed outcomes that can be explained by the predictors; and the mean absolute error (MAE) of the predicted outcomes versus the measured outcomes.
We first assessed the predictions based on only the demographic and laboratory data. We then assessed the predictions based on the MRI-based measures. Last, we assessed the combination of the demographic, laboratory, and MRI-based measures. The models were further analyzed to determine which aspects of the inputs were driving the predictions. It should be noted that the predictions based on the demographic and laboratory data alone should not be understood as clinical prognostications; rather they merely represent a baseline of what can be achieved without the use of MRI or electroencephalogram (EEG) data, and with only a limited set of demographic, biochemical, and encephalopathy measures.
Results
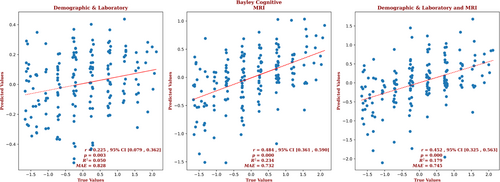
The analyses used the data from all of the neonates for whom we had a post-rewarming brain MRI and Bayley-III scores. The demographic and laboratory data for the infants for whom we had Bayley-III cognitive outcome scores are presented in Supplementary Table S2. Of these infants, 63% had normal brain MRIs, 20% had predominantly white-matter/watershed predominant injuries, 9% had predominantly deep gray-matter injuries, and 8% had near-total injury, that is, injuries to the white matter, cortex, and deep gray-matter. For these infants, brain MRI measures yielded a correlation coefficient for the cognitive outcomes that is more than twice that of the correlation produced with the demographic and laboratory measures alone (r = 0.484, 95% confidence interval [CI] = 0.361 to 0.590 vs r = 0.225, 95% CI = 0.079 to 0.362, respectively) and a smaller error (MAE = 0.732 vs 0.828, respectively), and the relation based on the brain MRI data explained more than 4 times the variance in the observed outcome compared to that of the relation based on the demographic and laboratory measures (R2 = 0.234 vs 0.050, respectively). Combining demographic, laboratory, and MRI metrics did not further improve the predictive accuracy (r = 0.452, 95% CI = 0.325 to 0.563, R2 = 0.179; and MAE = 0.745). These results are shown in Figure 2. Measures from each structure contributed to the results from the analyses which used the MRI-based measures; in the analysis which used the combined measures, only birth weight contributed to the result. The largest contribution to the result came from the PLIC, and 10.6% of the predictors came from radiomic features from the PLIC. However, a number of predictors came from the hippocampus (14.9%), amygdala (13.8%), thalamus (8.5%), and caudate (6.4%); and radiomic features of the brain as a whole constituted 40.4% of the cognitive outcome predictors. Among the demographic and laboratory parameters, only birth weight was selected by the model. The contribution of the top predictors of cognitive outcome for the combined model is presented in Supplementary Figure S2. The contributions of the full set of predictors for each result can be found in the Supplementary Material.
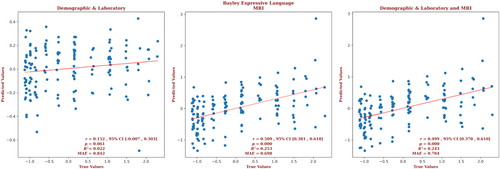
The demographic and laboratory data for the infants for whom we had Bayley-III expressive language outcome scores are presented in Supplementary Table S3. Of these infants, 65% had normal brain MRIs, 18% had predominantly white-matter/watershed predominant injuries, 9% had predominantly deep gray-matter injuries, and 8% had near-total injury, that is, injuries to the white matter, cortex, and deep gray-matter. For these infants, brain MRI measures yielded a correlation more than 3 times that of the correlation based on the demographic and laboratory measures (r = 0.509, 95% CI = 0.381 to 0.618 vs r = 0.152, 95% CI = –0.007 to 0.303, respectively) and a smaller error (MAE = 0.698 vs 0.842, respectively), and the relation based on the brain MRI data explained more than 11 times the variance in the observed outcome (R2 = 0.253 vs 0.022, respectively). Combining demographic, laboratory, and MRI metrics did not further improve the predictive accuracy (r = 0.499, 95% CI = 0.370 to 0.610, R2 = 0.243, MAE = 0.704).These results are shown in Figure 3. The largest contributions to the result came from the amygdala, and 26.3% of the predictors came from features from the amygdala. But features of the thalamus, putamen, and PLIC each comprised 15.8% of the predictors; features of the globus pallidus and caudate comprised 10.5% and 5.3% of the predictors, respectively. The only demographic or laboratory metric that was selected by the model was gestational age. The contribution of the predictors of expressive language for the combined model is presented in Supplementary Figure S3. The contributions of the full set of predictors for each result can be found in the Supplementary Material.
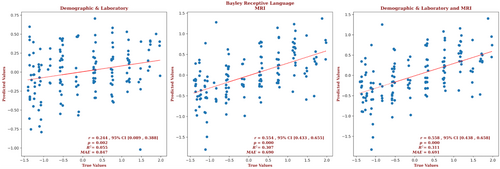
The demographic and laboratory data for the infants for whom we had Bayley-III receptive language outcome scores are presented in Supplementary Table S4. Of these infants, 65% had normal brain MRIs, 18% had predominantly white-matter/watershed predominant injuries, 9% had predominantly deep gray-matter injuries, and 8% had near-total injury, that is, injuries to the white matter, cortex, and deep gray-matter. For these infants, brain MRI measures yielded a correlation more than twice that of the correlation based on the demographic and laboratory measures (r = 0.554, 95% CI = 0.433 to 0.655 vs r = 0.244, 95% CI = 0.089 to 0.388, respectively) and a smaller error (MAE = 0.690 vs 0.847, respectively), and the relation based on the brain MRI data explained more than 5 times the variance in the observed outcome data (R2 = 0.307 vs 0.055, respectively). Combining demographic, laboratory, and MRI metrics did not further improve the predictive accuracy (r = 0.558, 95% CI = 0.438 to 0.658, R2 = 0.311, MAE = 0.691). These results are shown in Figure 4. The largest contribution to the result came from the PLIC, and 7.4% of the predictors came from the geometric and radiomic features from the PLIC. But features of each brain structure contributed to the predictions of the combined model; features of the amygdala made up 13.9% of the predictor set, followed by features of the putamen (12%), the caudate (9.3%), the hippocampus and PLIC (7.4% each), the thalamus (6.5%), the globus pallidus (1.9%), and the brain as a whole (39.8%). The 2 demographic predictors that were selected by the model were gestational age and sex; and it is notable that sex is prominent, being the second largest contributor to the result. The contribution of the top predictors of receptive language for the combined model is presented in Supplementary Figure S4. The contributions of the full set of predictors for each result can be found in the Supplementary Materials.
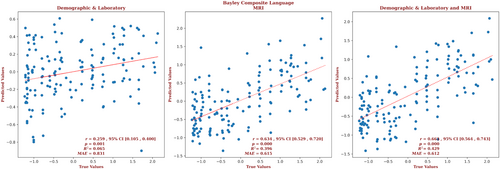
The demographic and laboratory data for the infants for whom we had Bayley-III composite language outcome scores are presented in Supplementary Table S5. Of these infants, 64% had normal brain MRIs, 19% had predominantly white-matter/watershed predominant injuries, 9% had predominantly deep gray-matter injuries, and 8% had near-total injury, that is, injuries to the white matter, cortex, and deep gray-matter. For these infants, the brain MRI measures yielded a correlation more than twice that of the correlation based on the demographic and laboratory measures (r = 0.634, 95% CI = 0.529 to 0.720 vs r = 0.259, 95% CI = 0.105 to 0.400, respectively) and a smaller error (MAE = 0.615 vs 0.831, respectively), and the relation based on the brain MRI data explained more than 6 times the variance in the observed outcomes (R2 = 0.396 vs 0.065, respectively). Combining demographic, laboratory, and MRI metrics marginally improved the predictive accuracy (r = 0.668, 95% CI = 0.564 to 0.743, R2 = 0.429, MAE = 0.612). These results are shown in Figure 5. The largest contribution to the result came from the PLIC, but only 4% of the predictors came from the PLIC. Most predictors came from the amygdala (34.7%), followed by the brain as a whole (32.7%), the putamen (8%), and the caudate and globus pallidus (6% each). Gestational age and sex were significant demographic predictors. The detailed contribution of each parameter to composite language outcome prediction is presented in Supplementary Figure S5 and provided in the Supplementary Material.
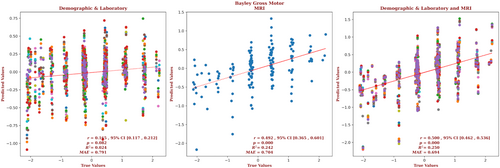
The demographic and laboratory data for the infants for whom we had Bayley-III gross motor outcome scores are presented in Supplementary Table S6. Of these infants, 63% had normal brain MRIs, 20% had predominantly white-matter/watershed predominant injuries, 10% had predominantly deep gray-matter injuries, and 6% had near-total injury, that is, injuries to the white matter, cortex, and deep gray-matter. For these infants, brain MRI measures yielded a correlation almost 3 times that of the correlation based on the demographic and laboratory measures (r = 0.492, 95% CI = 0.365 to 0.601 vs r = 0.165, 95% CI = 0.117 to 0.212, respectively) and a smaller error (MAE = 0.704 vs 0.791, respectively), and the relation based on the brain MRI data explained more than 10 times the variance in the observed outcome data (R2 = 0.242 vs 0.024, respectively). Combining the demographic, laboratory, and MRI metrics marginally improved the predictive accuracy (r = 0.5.00, 95% CI = 0.462 to 0.536, R2 = 0.250, MAE = 0.694). These results are shown in Figure 6. The largest contribution to the result came from the caudate, and 15.2% of the predictors came from features of the caudate. But an equal number of predictors came from the brain as a whole, and the most predictors came from the PLIC (21.7%); the putamen and amygdala both contributed 10.9% of the predictors, followed by the globus pallidus (6.5%), the hippocampus (4.3%), and the thalamus (2.2%). Gestational age, sex, 5-minute Apgar score, the highest Thompson score, blood lactate, and venous pH were significant demographic and laboratory predictors. The detailed contribution of each parameter to gross motor outcome prediction is presented in Supplementary Figure S6 and provided in the Supplementary Material.
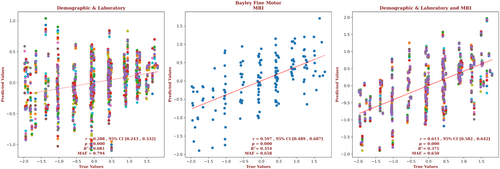
The demographic and laboratory data for the infants for whom we had Bayley-III fine motor outcome scores are presented in Supplementary Table S7. Of these infants, 62% had normal brain MRIs, 21% had predominantly white-matter/watershed predominant injuries, 10% had predominantly deep gray-matter injuries, and 7% had near-total injury, that is, injuries to the white matter, cortex, and deep gray-matter. For these infants, brain MRI measures yielded a correlation more than twice that of the correlation based on the demographic and laboratory measures (r = 0.597, 95% CI = 0.489 to 0.687 vs r = 0.288, 95% CI = 0.243 to 0.332, respectively) and a smaller error (MAE = 0.658 vs 0.794, respectively), and the relation based on the brain MRI data explained more than 4 times the variance in the observed outcome data (R2 = 0.354 vs 0.081, respectively). Combining demographic, laboratory, and MRI metrics only marginally improved the predictive accuracy (r = 0.613, 95% CI = 0.582 to 0.642, R2 = 0.371, MAE = 0.650). These results are shown in Figure 7. The largest contribution to the result came from the caudate, and 15% of the predictors came from features of the caudate. But an equal number of predictors came from globus pallidus, and the most predictors came from the hippocampus (50%), with the brain as a whole providing another 10% of the predictors, and the putamen providing another 5%. The only demographic or laboratory predictor retained by the model was venous pH. The detailed contribution of each parameter to fine motor outcome prediction is presented in Supplementary Fig S7 and provided in the Supplementary Material.
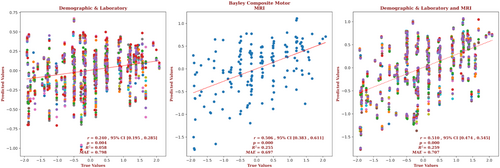
The demographic and laboratory data for the infants for whom we had Bayley-III composite motor outcome scores are presented in Supplementary Table S8. Of these infants, 63% had normal brain MRIs, 20% had predominantly white-matter/watershed predominant injuries, 10% had predominantly deep gray-matter injuries, and 7% had near-total injury, that is, injuries to the white matter, cortex, and deep gray-matter. For these infants, brain MRI measures yielded a correlation more than twice that of the correlation based on the demographic and laboratory measures (r = 0.506, 95% CI = 0.383 to 0.611 vs r = 0.240, 95% CI = 0.195 to 0.285, respectively) and a smaller error (MAE = 0.697 vs 0.798, respectively), and the relation based on the brain MRI data explained more than 4 times the variance in the observed outcome data (R2 = 0.255 vs 0.058, respectively). Combining demographic, laboratory, and MRI metrics marginally improved the predictive accuracy (r = 0.510, 95% CI = 0.474 to 0.545, R2 = 0.259, MAE = 0.707). These results are shown in Figure 8. The largest contribution to the result came from the caudate, and 11.8% of the predictors came from features of the caudate. But the largest number of predictors came from the hippocampus (29.4%), and the brain as a whole supplied 23.5% of the predictors. The globus pallidus, PLIC, and putamen each supplied 5.8% of the predictors. Gestational age and venous pH were the significant demographic and laboratory predictors. The detailed contribution of each parameter to the composite motor outcome prediction is presented in Supplementary Figure S8 and provided in the Supplementary Material.
Discussion
Post-rewarming MRI obtained in neonates with HIE is commonly used to assess the extent and severity of brain injury and counsel caregivers about the expected neurodevelopmental outcome trajectories. Although the implementation of hypoxic-ischemic injury scoring systems for neonatal MRI has improved this process, these scoring systems are not widely used in the clinical setting and are generally reserved for research purposes, as they are time-consuming and require significant neonatal neuroimaging interpretation expertise.18, 36-39 Previous studies have shown that severe and extensive brain injury on MRI is predictive of mortality or severe neurodevelopmental disability; however, milder forms of brain injury have been claimed to offer little predictive power, with such infants generally having neurotypical development and similar 18 to 24-month cognitive, language, and motor outcomes as infants showing no visible injuries.37, 40 Such claims, however, may stem from relying on visual perception to quantify signal abnormalities, or the use of a scoring system that under-represents the contribution of injuries to structures like the amygdala and hippocampus.41
In this study, we created a population-specific neonatal brain MRI template and obtained radiomic and geometric measures of the deep gray-matter structures and the brain as a whole. We explored how well these measures, and demographic and laboratory measures, predicted cognitive, language, and motor Bayley-III outcome scores. We used a machine learning method that could choose the best set of predictors from a large number of possibilities (Elastic-Net penalized linear regression), and found that the MRI-based measures yielded good predictions across all domains and across the full spectrum of outcomes. Indeed, with the MRI-based measures, the correlations between predicted and measured outcomes were more than twice that of the correlations for the predictions based on the demographic and laboratory data alone, and explained more than twice the variance in the observed outcomes. These findings show that quantitative neuroimaging measures can be effectively utilized with machine learning models to enhance the accuracy of neurodevelopmental outcome prediction in neonates with HIE across the full spectrum of outcomes.
In addition to demonstrating that brain MRI does have predictive power for the full spectrum of outcomes in neonates with HIE, our approach identified the structures and features within those structures that drove the predictions. This may provide valuable insight into our understanding of the outcomes associated with different patterns of injury in the developing brain. Notably, the top predictors of expressive language outcomes came from the amygdala, and all but one of the predictors were from the DGM structures. The first of these may suggest an important role for the amygdala in this domain in neonates; the second is possibly identifying the importance of the connectivity between the DGM structures and areas associated with expressive language in adults, for example, Broca's area. Also of note, the hippocampus was one of the top predictors of receptive language outcomes. Injuries in the hippocampus have been associated with cognitive deficits,42 however, to the best of our knowledge, they have not been associated with receptive language deficits in the previous literature. As for motor outcome analyses, unsurprisingly, the top predictors included components of the DGM region but notably, features of the amygdala and hippocampus were also among the predictors, for gross motor and fine and composite motor, respectively.
Traditionally, the evaluation of brain injuries identified through MRI scans has been dependent on the subjective assessments made by radiologists. This method poses challenges related to consistency and reliability among different raters and even the same rater over time, leading to potential discrepancies and conflicting results. Moreover, certain brain injuries are so subtle that they might be overlooked or be undetectable by the human eye. We have addressed these issues by using radiomics measures that extract features directly from MRI data without human involvement. The features are derived from the size and shape of the labels, the image intensity histogram, the relationships between image voxels, gray-tone similarities and differences, and mathematically defined patterns, for example, fractals. Most of these radiomics features are invisible to the human eye but computationally detectable. Furthermore, our use of an elastic-net model allowed for models that incorporate a large number of features but eliminated those features which do not contribute to the predictions. This method produces models that go beyond visual judgments of the severity of injury in different regions of the brain. The models produced by our iterative elastic-net regression approach found the best set of predictors for each structure, then combined them, and iterated to find the best combination of predictors, eliminating collinear predictors at each stage.
Our study has several limitations that should be considered when interpreting the results. First, the data were acquired at a single center, and was based on that center's institutional criteria for diagnosis and for the use of therapeutic hypothermia. In line with the global therapeutic drift toward utilizing hypothermia in infants who exhibit “mild” encephalopathy,20 newborns from across the full spectrum of severity of HIE were included in the present study. In our study population, across domains, on average, approximately 63% of patients had normal brain MRIs, 20% had predominantly white-matter/watershed predominant injuries, 9% had predominantly deep gray-matter injuries, and 8% had near-total injury, that is, injuries to the white matter, cortex, and deep gray-matter. We believe that inclusion of a broad spectrum of injury patterns demonstrates the ability of our approach to prognosticate across the full spectrum of severity. However, a determination of the reliability of our results requires replication in large samples acquired at other centers with potentially variable patient populations and clinical practices. It should also be noted that the predictive analyses were potentially negatively impacted by missing data in the laboratory and clinical measures. The use of multiple imputations may have provided reasonable mitigation for this issue; however, we acknowledge this as a limitation. However, although imputation may introduce bias, we only imputed missing laboratory and clinical measures and not outcome measures, and comparison of the imputed and actual values revealed the differences to be small and so unlikely to be clinically meaningful. Relatedly, a number of infants were excluded from the analysis because we were unable to acquire artifact-free MRI data from them. To the extent that these excluded infants differed from the included infants, this may have biased our results. Our analyses may have also been negatively impacted by the use of different MRI scanners with different field strengths, even though the scanner model was included as a variable. Future studies should attempt to eliminate this variability in the data. The suboptimal slice thickness (3 mm, with 3.3 mm spacing) used in the protocol for the T2-weighted data might have also negatively impacted the analyses. This limitation necessitated acquiring good quality scans in all 3 orientations, using super-resolution up-sampling, and averaging to construct a T2-weighted scan of the same resolution as the T1-weighted scan. However, it should be noted that despite this limitation, the majority of the radiomics features that elastic-net used as predictors were taken from the T2-weighted data; thus, super-resolution up-sampling seems to produce reasonable results. Recent improvements to MR scanners allow the acquisition of the desired 3D T2-weighted scan directly and doing so would not only eliminate the need to perform this super-resolution up-sampling but may also yield superior results. Finally, we were also limited by using only structural MRI data. Use of additional modalities, for example, diffusion-weighted data, may allow for improved accuracy.43, 44
In conclusion, we have demonstrated that machine learning, using radiomics and geometric measures, has the potential to predict 18-month outcomes in infants with perinatal HIE across all domains, and across the full spectrum of outcomes. To contribute to the broader medical and neuroimaging communities, we provide our labeled multi-contrast population-specific neonatal brain MRI template and the scripts necessary to use it to obtain the measures of the brain, and brain structures, and to produce the predictions of outcomes. However, we note that future studies with external cohort validation are needed to evaluate the generalizability of our findings. Last, future studies need to compare our automated prognostication approach to standard methods for clinical prognostication.
Acknowledgments
Funding for this research was provided by the TD Bank Group Charity Classic Golf Tournament. Drs Mehmet N. Cizmeci and Linh G. Ly received support from the Dr. Karen Pape Program in Neuroplasticity for neuroprognostication and neurodevelopmental research. Our thanks to the Neonatal Neurodevelopmental Follow-Up Clinic team for their efforts to capture our outcome data. Also, our thanks to Vladimir S. Fonov and Jussi Tohka for their guidance.
Author Contributions
J.D.L., M.N.C., and B.T.K. contributed to the conception and design of the study. J.D.L., A.A.M., M.S., H.M.B., A.D., K.R., and L.G.L. contributed to the acquisition and analysis of data. J.D.L., M.N.C., and B.T.K. contributed to drafting the text or preparing the figures.
Potential Conflicts of Interest
The authors have no conflicts of interest to declare.
Open Research
Data Availability
Our multi-contrast population-specific neonatal brain MRI template and the labels for the deep gray-matter structures can be found here: https://gin.g-node.org/johndlewis/HIE/Template/ ; the scripts used to process the data can be found here: https://gin.g-node.org/johndlewis/HIE/Tools; and the linear regression model can be found here: https://gin.g-node.org/johndlewis/HIE/Models/.


