SOAT1 exacerbates tumor progression by promoting YAP signaling activation and attenuating endoplasmic reticulum stress
Fan Wang and Qianyu Li have contributed equally to this work.
Abstract
Metabolic reprogramming is a hallmark of malignancy, with profound alterations in cellular metabolism driving cancer progression. However, the precise mechanisms by which these metabolic changes promote tumor growth remain poorly understood. Here we mined metabolic activity at single-cell resolution as well as bulk-RNA levels, and found that cholesterol biosynthesis is obviously upregulated in breast cancer, particularly triple-negative breast cancer. We identified sterol O-acyltransferase 1 (SOAT1) was highly expressed in triple-negative breast cancer (TNBC) with poor progression and prognosis. Functional studies demonstrated that SOAT1 suppression—either through genetic knockdown or pharmacological inhibition—effectively curbed cancer cell proliferation and migration, induced cell cycle arrest, and significantly inhibited the in vivo growth of breast cancer xenografts. Similar effects were observed in prostate cancer models. Mechanistically, targeting SOAT1 disrupted cholesterol metabolic homeostasis, leading to inactivation of the YAP signaling pathway and induction of endoplasmic reticulum (ER) stress. Collectively, our findings highlight the critical role of SOAT1 in TNBC progression through modulation of the YAP pathway and ER stress, and propose a novel therapeutic strategy for TNBC by targeting cholesterol metabolism.
1 INTRODUCTION
Breast cancer (BRCA) patients make up as much as 36% of all cancer cases and is the most frequently diagnosed malignancy among women worldwide.1 Among BRCA subtypes, triple-negative breast cancer (TNBC) is particularly aggressive, characterized by early onset, high metastatic potential, and poor clinical outcomes, including higher relapse rates and lower survival rates.2 TNBC is defined by the absence of estrogen receptor (ER), progesterone receptor (PR), and human epidermal growth factor receptor 2 (HER2) expression, which renders it unresponsive to conventional endocrine therapies and HER2-targeted treatments.3 Due to its unique biological features and limited therapeutic options, there is an urgent need to identify novel molecular targets and develop effective treatment strategies for TNBC.4
Cholesterol metabolism plays a critical role in cancer biology. Cancer cells, driven by their high proliferative capacity, exhibit elevated cholesterol levels to support membrane synthesis, signal transduction, and energy production.5 Excess cellular cholesterol is stored in lipid droplets (LDs) as cholesteryl esters (CEs). Accumulating evidence suggests that high LDs and CEs content was associated with increased tumor aggressiveness and poor prognosis in various cancers, including BRCA.6 Both exogenous and endogenous CEs have been shown to promote mammary tumor growth by activating the AKT/mTOR signaling pathway, a key regulator of cell survival and proliferation.7 Additionally, 27-hydroxycholesterol (27HC), a cholesterol metabolite, has been implicated in cancer progression. Chronic exposure to 27HC enhances lipid uptake and biosynthesis, upregulates the ferroptosis inhibitor GPX4, and promotes metastatic potential by increasing cancer cell resilience during migration.8 These findings underscore the importance of cholesterol metabolism in cancer progression and highlight its potential as a therapeutic target. Sterol O-acyltransferase (SOAT), an enzyme localized in the endoplasmic reticulum, catalyzes the esterification of cholesterol into CEs, thereby regulating intracellular cholesterol homeostasis.5 The SOAT family consists of two isoforms: SOAT1, which is ubiquitously expressed across human tissues, and SOAT2, which exhibits tissue-specific expression.9, 10 Emerging studies have identified SOAT1 as an oncogene in multiple cancer types, where it promotes tumor growth and metastasis by modulating cholesterol metabolism.9 However, its role in BRCA, particularly in TNBC, remains poorly understood.
The Hippo/YAP signaling pathway is a critical regulator of organ size, tissue homeostasis, and tumorigenesis.11 This pathway consists of a kinase cascade that ultimately controls the nuclear translocation of transcriptional coactivators YAP and TAZ. In the nucleus, YAP/TAZ drives the expression of genes involved in cell proliferation, survival, and stemness, contributing to cancer progression.12 Aberrant activation of YAP signaling has been observed in various malignancies, including BRCA, where it promotes tumor growth, metastatic relapse, and therapy resistance.13, 14 Despite its established role in cancer, the mechanisms underlying YAP pathway dysregulation in BRCA, particularly in the context of cholesterol metabolism, remain elusive.
In this study, we demonstrate that cholesterol biosynthesis is significantly upregulated in BRCA, with the highest levels observed in TNBC, correlating with poor prognosis. We identify SOAT1, a key enzyme in cholesterol esterification, as highly expressed in TNBC, where it drives tumor cell proliferation and migration. Mechanistically, SOAT1 exerts its tumor-promoting effects partly through activation of the YAP signaling pathway. Furthermore, we show that SOAT1 inhibition disrupts cholesterol homeostasis, leading to endoplasmic reticulum (ER) stress and apoptosis. These findings provide new insights into the role of SOAT1 in regulating the Hippo/YAP pathway and propose a novel therapeutic strategy for TNBC targeting cholesterol metabolism.
2 RESULTS
2.1 Cholesterol biosynthesis is activated in TNBC and positively associates with tumor malignant progression
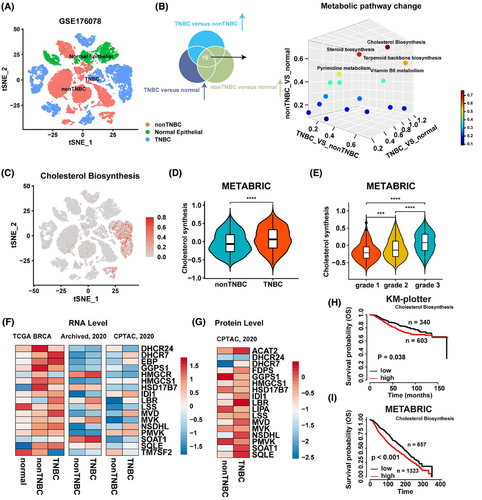
To explore the metabolic landscape of BRCA, we first quantified the activity of all 86 metabolic pathways in breast tumor cells using scMetabolism, an R package designed for single-cell metabolic activity analysis.15 Comparative analysis of these pathways revealed that cholesterol biosynthesis was significantly enriched in TNBC (Figures 1A–C and S1A). To validate these findings, we compared cholesterol biosynthesis pathway activity between TNBC and non-TNBC using publicly available BRCA mRNA sequencing data. Consistent with the single-cell data, cholesterol biosynthesis was markedly elevated in TNBC samples from the METABRIC cohort (Figure 1D). Furthermore, we observed a positive correlation between cholesterol biosynthesis activity and tumor grade in BRCA from the METABRIC cohort (Figure 1E). We next examined the expression levels of key enzymes involved in cholesterol biosynthesis and found that many of these enzymes were significantly upregulated at the RNA level in TNBC samples from the TCGA, Archived, and CPTAC databases (Figure 1F). A similar trend was observed at the protein level (Figure 1G). Patients with elevated cholesterol biosynthesis activity exhibited poor prognosis in both the KM-plotter and METABRIC cohorts (Figures 1H,I and S1B). Additionally, Gene Set Enrichment Analysis (GSEA) revealed that gene sets associated with invasive BRCA were significantly enriched in patients with high cholesterol biosynthesis activity, whereas gene sets downregulated in invasive BRCA were enriched in patients with low cholesterol biosynthesis activity (Figure S1C). Collectively, our analysis of single-cell and bulk RNA transcriptomic data indicates that BRCA, particularly TNBC, exhibits enhanced cholesterol biosynthesis, and elevated cholesterol biosynthesis is associated with poorer patient prognosis.
2.2 Upregulation of SOAT1 in breast cancer correlates with poorer prognosis and more aggressive tumor progression especially in TNBC
To investigate the genetic landscape of cholesterol biosynthesis enzymes in BRCA, we analyzed somatic mutations and copy number variations (CNVs) in the TCGA-BRCA cohort. Our findings revealed that genetic alterations were predominantly characterized by CNV gains, with relatively low mutation frequencies across the enzymes studied (Figure 2A). Focusing on genes with a mutation frequency of 5% or higher, we observed that BRCA patients with genetic alterations specifically in SOAT1 exhibited significantly shorter disease-specific survival compared to those without such alterations (Figures 2B and S2A). This suggests a potential functional role for SOAT1 genetic alterations in BRCA progression. Expanding our analysis to the TCGA pan-cancer cohorts, we found that SOAT1 genetic alterations were primarily driven by CNV gains, with the most significant amplifications occurring in cholangiocarcinoma, hepatocellular carcinoma, and BRCA, respectively (Figure S2B).
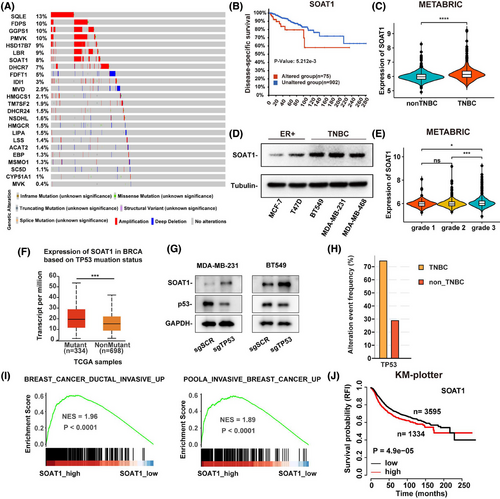
SOAT1, which catalyzes the conversion of free cholesterol into CEs,16 showed upregulated expression in BRCA, particularly in TNBC (Figures 2C and S2C,S2D). This upregulation was consistently observed at the protein level in TNBC cell lines compared to other BRCA cell lines (Figure 2D). Furthermore, analysis of the METABRIC cohort revealed higher SOAT1 expression in tumors with advanced grades (Figure 2E). To elucidate the mechanisms underlying SOAT1 upregulation in TNBC, we analyzed TCGA breast cancer data and found significantly higher SOAT1 mRNA expression in TP53-mutant tumors compared to wild-type tumors (Figure 2F). This finding was corroborated by our experimental results showing that TP53 knockout in MDA-MB-231 and BT549 cells led to a substantial increase in SOAT1 protein levels (Figure 2G). The higher frequency of TP53 mutations in TNBC patients compared to non-TNBC patients (Figure 2H) further supports the potential role of TP53 mutations in driving SOAT1 upregulation in TNBC. GSEA revealed that gene sets associated with invasive BRCA were significantly enriched in patients with high SOAT1 expression (Figure 2I). Moreover, high SOAT1 expression was associated with poorer overall survival in BRCA patients (Figure 2J).
Our comprehensive analysis also demonstrated that SOAT1 was upregulated at both RNA and protein levels across various cancer types (Figure S2E,S2F), suggesting a broad tumor-promoting role for SOAT1 in cancer biology. Collectively, these findings highlight the significance of SOAT1 upregulation in BRCA development, particularly in TNBC, and underscore its potential as a therapeutic target in breast cancer.
2.3 SOAT1 depletion inhibits TNBC cell proliferation and migration in vitro
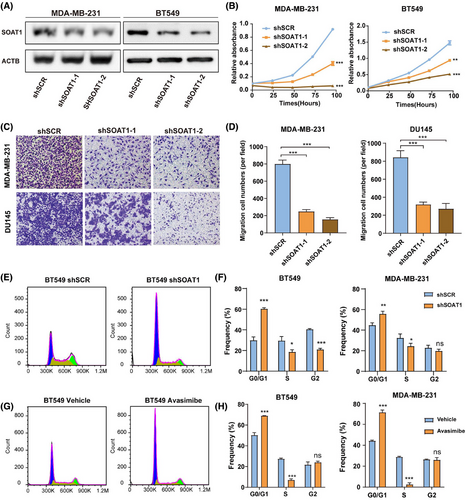
To further investigate the functional role of SOAT1 in BRCA, we established two TNBC cell lines with stable SOAT1 knockdown (Figures 3A and S3A) and conducted comprehensive functional assays. Our experimental results revealed that SOAT1 silencing significantly inhibited TNBC cell proliferation (Figure 3B). Furthermore, SOAT1 depletion markedly impaired tumor cell migration capacity, as demonstrated by the reduced number of migrating cells in both SOAT1-knockdown MDA-MB-231 and DU145 cell lines (Figure 3C,D). The inclusion of DU145 cells, a prostate cancer cell line, was aimed at expanding the understanding of SOAT1's potential broad-spectrum effects across various cancer types. Additionally, cell cycle analysis demonstrated that the fraction of cells in the S phase was markedly reduced, and the fraction in G0/G1 was increased following either the knockdown of SOAT1 or treatment with the SOAT1 inhibitor avasimibe in TNBC cells (Figures 3E–H and S3A–B). These collective findings demonstrate that SOAT1 plays a crucial role in promoting TNBC cell proliferation and migration, suggesting its potential as a therapeutic target for TNBC treatment.
2.4 SOAT1 knockdown suppresses TNBC tumor growth in vivo
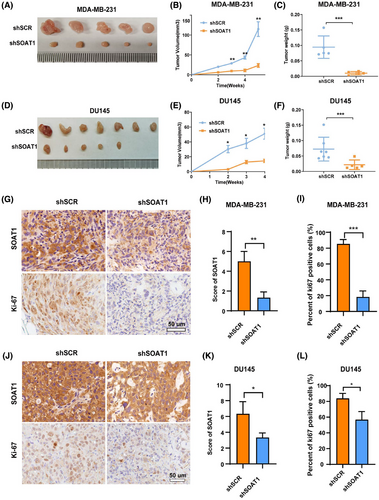
To investigate the role of SOAT1 in breast cancer progression in vivo, we established xenograft models using SOAT1-knockdown MDA-MB-231 cells and corresponding control cells. Knockdown of SOAT1 significantly inhibited tumor growth in mice (Figure 4A). Our results demonstrated that SOAT1 depletion significantly inhibited tumor growth in mice, as evidenced by reduced tumor volume and weight in xenografts derived from SOAT1-knockdown TNBC cells compared to control groups (Figure 4A–C). To validate these findings, we extended our investigation using DU145 cells, which consistently showed similar tumor growth inhibition upon SOAT1 knockdown (Figure 4D–F). Further histological analysis revealed a significant reduction in Ki67 proliferation index in SOAT1-knockdown xenografts, confirming the antiproliferative effect of SOAT1 depletion in vivo (Figure 4G–L). These compelling in vivo findings collectively demonstrate that SOAT1 functions as a crucial tumor-promoting factor in TNBC progression.
2.5 SOAT1 depletion reduces the expression and nuclear translocation of YAP protein in TNBC
To elucidate the molecular mechanisms underlying SOAT1-mediated breast cancer progression, we first analyzed gene set alterations between BRCA patients with high and low SOAT1 expressions. GSEA revealed significant enrichment of YAP signaling signatures in both high-SOAT1 expressing BRCA patients (Figures 5A and S4A) and TNBC patients compared to non-TNBC groups (Figure S4B), consistent with their elevated cholesterol synthesis and SOAT1 expression levels. Moreover, SOAT1 silencing or pharmacological inhibition using avasimibe led to decreased YAP protein expression and increased phosphorylated YAP (p-YAP) levels (Figure 5B–D), suggesting SOAT1's role in regulating YAP signaling pathway activity. Notably, avasimibe treatment also elevated p-MOB1 expression (Figure 5D), indicating potential activation of the upstream Hippo pathway.
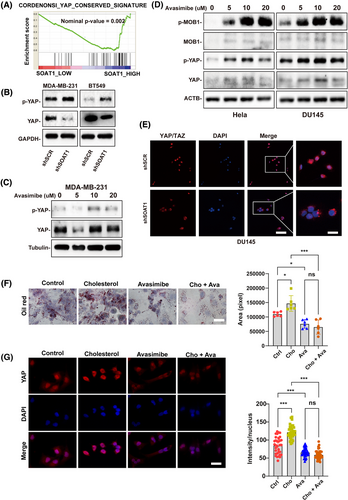
To further validate these findings, we performed immunofluorescence (IF) and immunohistochemistry (IHC) analyses, which demonstrated that SOAT1 depletion significantly reduced YAP nuclear localization (Figure 5E). This positive correlation between SOAT1 and YAP expression was consistently observed in prostate cancer (Figure S4C, S4D) and liver cancer (Figure S4E, S4F) tissue microarrays, suggesting a conserved mechanism across cancer types. Bioinformatics analysis of TCGA and CPTAC datasets confirmed positive correlations between SOAT1 and YAP1/TAZ mRNA expression in BRCA (Figure S4G, S4H), as well as in liver (LIHC) and prostate (PRAD) cancers (Figure S4I, S4J). Functional studies revealed that cholesterol treatment induced lipid accumulation in MDA-MB-231 cells, which was effectively reversed by avasimibe treatment (Figure 5F). Importantly, cholesterol-enhanced YAP nuclear translocation was significantly attenuated by avasimibe (Figure 5H), providing direct evidence for the cholesterol-SOAT1-YAP regulatory axis. Collectively, these findings demonstrate that SOAT1 promotes YAP signaling in TNBC through inhibiting YAP phosphorylation and enhancing its nuclear translocation.
2.6 SOAT1 activates the YAP/TAZ signaling pathway in TNBC
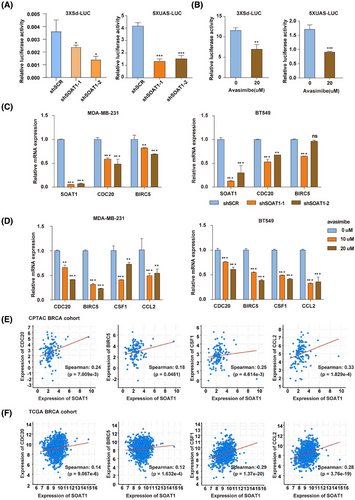
Given the observed role of SOAT1 in promoting YAP nuclear accumulation in TNBC, we sought to determine whether SOAT1 directly activates YAP signaling. Using 3xSd and 5xUAS reporter system as established indicators of YAP signaling activity,17, 18 we found that SOAT1 knockdown significantly reduced reporter activity (Figure 6A). This effect was recapitulated by pharmacological inhibition of SOAT1 using avasimibe (Figure 6B), confirming the functional relationship between SOAT1 and YAP signaling. To further validate the SOAT1-YAP signaling axis in BRCA, we examined the expression of canonical YAP downstream targets, including CDC20, BIRC5, CSF1, and CCL2, following SOAT1 manipulation. Both genetic silencing of SOAT1 and pharmacological inhibition with avasimibe resulted in significant downregulation of these YAP target genes in TNBC cells (Figure 6C and D). The clinical relevance of these findings was supported by positive correlations between SOAT1 expression and YAP target genes in both CPTAC-BRCA and TCGA-LIHC datasets (Figures 6E,F and S5A,S5B). These comprehensive findings demonstrate that SOAT1 functionally activates the YAP/TAZ signaling pathway in TNBC, establishing a novel cholesterol-mediated oncogenic signaling axis that contributes to breast cancer progression.
2.7 Targeting SOAT1 promotes ER stress and cell apoptosis by regulating cholesterol metabolism
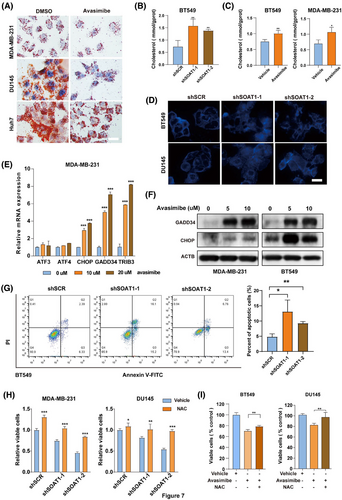
It has been reported that yap is necessary for unfolded protein response and endoplasmic reticulum expansion, which help alleviate ER stress.19 Additionally, dysregulated cholesterol metabolism has been linked to ER stress and apoptosis.20 Based on these findings, we hypothesize that SOAT1 silencing exacerbates ER stress and induces cell death. Oil Red O staining revealed a significant reduction in lipid droplets in cells subjected to SOAT1 silencing or avasimibe treatment (Figures 7A and S5C). Moreover, SOAT1 knockdown resulted in an increase in intracellular cholesterol levels in tumor cells (Figures 7B and S5D), a phenomenon also observed after avasimibe treatment (Figures 7C and S5E). Notably, SOAT1 knockdown altered the distribution of intracellular cholesterol, with a decrease in cholesterol at the cell membrane and an increase in intracellular cholesterol content (Figure 7D). These results suggest that targeting SOAT1 disrupts cholesterol homeostasis in tumor cells. Furthermore, key genes involved in the UPR signaling pathway, including CHOP, GADD34, and TRIB3, were significantly upregulated in MDA-MB-231 and BT549 cells following avasimibe treatment (Figures 7E and S5F). Compared to control cells, the protein levels of GADD34 and CHOP were notably elevated in the avasimibe-treated MDA-MB-231 and BT549 cells (Figure 7F). As expected, SOAT1 inhibition significantly increased apoptosis rates in BT549 cells (Figure 7G). Interestingly, a substantial increase in cell viability was observed following combined treatment with a reactive oxygen species (ROS) scavenger NAC and SOAT1 inhibition (Figures 7H,I, and S5G). Taken together, these findings indicate that SOAT1 inhibition induces cholesterol accumulation and an increase in intracellular free cholesterol, leading to ER stress and apoptosis.
3 DISCUSSION
Metabolic reprogramming is a hallmark of malignancy, crucial for tumor cells to adapt their metabolic processes to meet the heightened energy and biosynthesis demands required for tumor progression. Additionally, this reprogramming allows tumor cells to overcome various stresses such as hypoxia, nutrient deficiencies, and immune system attacks.21 Despite significant advances in understanding the distinct metabolic characteristics of tumors compared to adjacent non-malignant tissues, the metabolic phenotypes and potential targeted antitumor therapies remain underexplored. In this study, using single-cell sequencing data, we systematically analyzed and compared metabolic alterations in normal epithelial cells, non-TNBC, and TNBC tumor cells. Our findings revealed that cholesterol biosynthesis was markedly upregulated in BRCA, especially in TNBC, and correlates with tumor progression and poor prognosis. Targeting SOAT1, a key enzyme in cholesterol esterification, inhibited TNBC growth both in vitro and in vivo. This phenomenon has also been observed in hepatocellular carcinoma and prostate cancer, suggesting that SOAT1 could be a promising target for cancer therapy.
While previous studies have shown that cholesterol and its metabolites play a role in promoting tumorigenesis22 and that hypercholesterolemia increases the risk of breast cancer,23 single-cell sequencing analyses of metabolic pathways altered in different types of BRCA have not been extensively conducted. In this study, we utilized both single-cell sequencing gene expression data and whole transcriptome data to investigate the altered metabolic pathways in BRCA. Among 86 metabolic pathways examined, cholesterol biosynthesis was significantly upregulated in TNBC, correlating with poor prognosis. Notably, mutations and high expression of SOAT1 were associated with a poor prognosis in BRCA. Knockdown or pharmacological inhibition of SOAT1 disrupted cellular cholesterol metabolism, increased intracellular free cholesterol levels, induced ER stress, and promoted apoptosis, ultimately suppressing cancer progression. These findings highlight that inhibiting SOAT1 may be particularly effective in cancers with robust cholesterol metabolism, especially in TNBC.
Furthermore, previous studies have shown that YAP activity is regulated by ER stress, with prolonged ER stress leading to the production of the GADD34/PP1 complex, which inhibits YAP and promotes apoptosis.19 Our current study adds a new dimension by identifying SOAT1 as a regulator of YAP signaling. We found that SOAT1 activated the YAP pathway by inhibiting YAP phosphorylation and enhancing YAP nuclear translocation. Notably, SOAT1 protein levels were positively correlated with YAP protein levels and YAP signaling. YAP is a well-established oncogenic pathway,13 but no effective inhibitor for the YAP signaling pathway has been developed. Our work reveals that SOAT1 activates YAP signaling in tumor cells and human cancer tissues, providing a potential target for inhibiting YAP signaling. In contrast to directly targeting components of the YAP pathway, SOAT1 represents a more attractive upstream pharmacologic target. The SOAT1 inhibitor avasimibe has already been tested in clinical trials for cardiovascular diseases, making it a viable and cost-effective option for cancer clinical trials.
In conclusion, our study provides experimental evidence that SOAT1 is highly expressed in TNBC and is associated with more aggressive tumor progression and worse patient prognosis. SOAT1 plays a critical role in maintaining cholesterol metabolism homeostasis, attenuating ER stress, and preventing apoptosis. Both pharmacological and genetic inhibition of SOAT1 can suppress tumor progression. Furthermore, our findings suggest a novel strategy for TNBC therapy by targeting cholesterol metabolism and its interaction with the YAP signaling pathway.
4 MATERIALS AND METHODS
4.1 Cell culture
All cell lines involved in this article, including MDA-MB-231, BT549, PC3, DU145, Huh7 and LM3, were all originally purchased from ATCC and reserved in our laboratory. Cells were cultured in DMEM media (Gibco 11965092) supplemented with 10% FBS.
4.2 In vitro migration assay
For migration experiment, cells were collected and resuspended with basal medium, with the concentration adjusted to 10⁵ cells/mL. A 100 µL of cell suspension was seeded into the upper chamber of transwell plates (Costar, 3422). The lower chamber was filled with 500 µL of medium containing 10% FBS. After 8 h, cells on the upper surface of the chamber were gently removed with cotton wool. Then, the inserts were fixed with 4% paraformaldehyde (Sangon Biotech, E672002-0500), stained with 0.2% crystal violent (Sangon Biotech, A600331-0025) and examined under a microscope.
4.3 Quantitative PCR
Cells were lysed using Trizol reagent (Invitrogen, 15596026CN). Total RNA was precipitated with isopropanol (Sangon Biotech, A600918-0500). The cDNA was obtained through reverse transcription with PrimeScript RT reagent Kit (Takara, RR037Q) and then subjected to q-PCR analysis by using SYBR Green Realtime PCR Master Mix (QPK-201T; Toyobo). Primers are described in detail in Table 1. Analysis was conducted on three independent experiments.
| Primers for Q-PCR | |
|---|---|
| SOAT1-F | CCACTGGTCCAGATGAGTTTAG |
| SOAT1-R | GGGAACATGCAGAGTACCTTT |
| CDC20-F | GCACAGTTCGCGTTCGAGA |
| CDC20-R | CTGGATTTGCCAGGAGTTCGG |
| BIRC5-F | AGGACCACCGCATCTCTACAT |
| BIRC5-R | AAGTCTGGCTCGTTCTCAGTG |
| CSF1-F | TGGCGAGCAGGAGTATCAC |
| CSF1-R | AGGTCTCCATCTGACTGTCAAT |
| CCL2-F | CAGCCAGATGCAATCAATGCC |
| CCL2-R | TGGAATCCTGAACCCACTTCT |
| ATF3-F | CCTCTGCGCTGGAATCAGTC |
| CHOP-F | GGAAACAGAGTGGTCATTCCC |
| CHOP-R | CTGCTTGAGCCGTTCATTCTC |
| ATF3-R | TTCTTTCTCGTCGCCTCTTTTT |
| ATF4-F | ATGACCGAAATGAGCTTCCTG |
| ATF4-R | GCTGGAGAACCCATGAGGT |
| TRIB3-F | AAGCGGTTGGAGTTGGATGAC |
| TRIB3-R | CACGATCTGGAGCAGTAGGTG |
| GADD34-F | ATGATGGCATGTATGGTGAGC |
| GADD34-R | AACCTTGCAGTGTCCTTATCAG |
| ACTB-F | AAACTGGAACGGTGAAGGTG |
| ACTB-R | GTGGCTTTTAGGATGGCAAG |
| Primers for shRNA | |
|---|---|
|
shSOAT1-1 (Forward primer) |
CCGGTGGTCCATGACTGGCTATATTCTCGAGAATATAGCCAGTCATGGA CCATTTTTG |
| shSOAT1-2 (Forward primer) |
CCGGGAACGTGCCTCGGGTACTAAACTCGAGTTTAGTACCCGAGGCAC GTTCTTTTTG |
4.4 Filipin III staining
Cells were fixed using paraformaldehyde and permeabilized with 0.5% Triton X-100 (YESEN, 20107ES20) for 15 min at RT. After washing with PBS for three times, cells were incubated with 100 µg/mL Filipin III (MCE, HY-N6718) for 3 h at room temperature. Filipin III fluorescent staining was detected under a fluorescence microscope.
4.5 Oil Red O staining
Oil Red O staining was performed according to the instructions provided in the kit (Nanjing Jiancheng Bioengineering Research Institute, Oil Red O Stain Kit, D027-1-1). In brief, the sections were directly stained with reagent 1 for 15 min, and then stained with reagent 2 for 5 min. After mounting, they were observed under a microscope and photographed.
4.6 Cell cycle distribution
For cell cycle analysis, cells were treated with vehicle or avasimibe for 48 h, or transduced with shSCR or shSOAT1 for 72 h. Then they were collected and fixed with cold 70% ethyl alcohol for 30 min. After washed with PBS for 2–3 times, 200 µL PI (50 µg/mL) was used to resuspend cells. Samples were analyzed by C6 flow cytometer.
4.7 Apoptosis assays
Annexin V-FITC/PI Apoptosis Detection Kit (YESEN, 40302ES50) was used to perform apoptosis assays according to manufacturer's instructions. Briefly, cells transduced with shSCR or shSOAT1 were collected and resuspend with 100 µL of 1× Binding Buffer. Then 5 µL of Annexin V-FITC and 10 µL of PI were added. The samples were detected by flow cytometry within 1 h. The data were analyzed using the FlowJo software.
4.8 Western blot
RIPA buffer (Thermo Scientific, 89901) was used to lyse cultured cells. 10–30 µg proteins were separated by 10% SDS-PAGE. Then they were transferred to PVDF membranes (Millipore, IPVH00010). After being blocked for 1 h in 5% nonfat milk at RT, the membranes were incubated with corresponding primary antibodies overnight at 4°C. The next day, membranes were incubated with the corresponding secondary antibody conjugated to horseradish peroxidase. Then ECL (Thermo Scientific, 34080) was used to determine immunoreactivity.
4.9 Immunohistochemistry
The sections were soaked in xylene solution three times, 10 min each time. They were sequentially hydrated in ethanol of 100%, 100%, 95%, 85%, and 75% for 3 min each respectively. Followed by washing with water for 3–5 min, sections were soaked in 3% hydrogen peroxide for 10 min. Next, antigen retrieval was performed using citrate buffer (Sangon Biotech, E673001-0100). After cooling, sections were blocked with 10% goat serum for 1 h at RT and then incubated with anti-SOAT1 (Santa Cruz Biotechnology, sc-69836), anti-Ki-67 (Proteintech, 27309-1-AP) or anti-YAP (sigma, SAB2108066) antibodies overnight at 4°C. Sections were incubated with the corresponding secondary antibody for 1 h at RT, followed by DAB staining (Vector). Depending on the proportion of tumor cells with specific staining, the score for staining extent ranged from 0 to 4. The proportions of corresponding positive cells are as follows: 0%–1%, 1%–5%, 6%–25%, 26%–75%, and 76%–100%. The staining intensity is scored from 0 to 2, representing negative, weakly positive, and strongly positive respectively. Staining extent and intensity were multiplied together to calculate a score ranging from 0 to 8, with low scores (0–4) and high scores (6–8).
4.10 Xenograft experiments
A total of 5 × 10⁶ of MDA-MB-231 or DU145 cells transfected with shSOAT1 or a control plasmid were injected subcutaneously into the flanks of BALB/c nude mice (SLAC). The tumor volume was measured with a caliper once a week from the second week after inoculation. Tumor volumes were calculated based on the formula: V = (L × W2)/2 (L and W standing for length and width of tumor respectively). Mice were sacrificed either when tumors reached a volume of 2 cm3 or in case of bleeding. All procedures were carried out with the approval of the ethics committee of Ren Ji Hospital, the School of Medicine of Shanghai Jiao Tong University (RJ20220720).
4.11 Data availability
No new sequencing data were generated. The data mentioned in the article can all be downloaded in the public database. METABRIC, Archived, CPTAC datasets were obtained from cBioportal (https://www.cbioportal.org/). TCGA_BRCA dataset was retrieved from UCSC Xena (https://xenabrowser.net/datapages/). The single-cell RNA sequencing data of breast cancer were downloaded from the GEO database, with the accession number: GSE176078.
4.12 Statistical analysis
All statistical diagrams were performed using GraphPad Prism 6.0 or R software (version 3.6.3). Unless otherwise noted, differences among groups were analyzed by a two-tailed Student's t-test. Survival data was evaluated by means of Log-rank test. All values were presented as mean ± standard deviation (SD). *p < 0.05, ** p < 0.01, *** p < 0.001.
AUTHOR CONTRIBUTIONS
Yanfeng Liu, Wei-Qiang Gao, Fan Wang, and Qianyu Li designed the study and revised the manuscript. Fan Wang, Qianyu L, Yifei Qian, and Yu Tong performed the experiments. Songling Li, Wenyun Guo, Zijun Zhu, and Linfeng Li downloaded and analyzed public data. Fan Wang and Qianyu Li organized pictures and wrote the manuscript.
ACKNOWLEDGMENTS
This work was supported by the Natural Science Foundation of China (grant nos. 82073190 and 82272684 to Yanfeng Liu; grant no. U23A20441 to Wei-Qiang Gao); National Key Research and Development Program of China (grant nos. 2023YFC1404101 and 2022YFA1302704 to Wei-Qiang Gao).
CONFLICT OF INTEREST STATEMENT
The authors declare no conflict of interest.


