

Journal list menu

 Issue
IssuePediatrics International: Volume 62, Issue 6
661-765June 2020
Export Citations
Download PDFs
ISSUE INFORMATION
Issue Information
- Pages: 661-662
- First Published: 23 June 2020
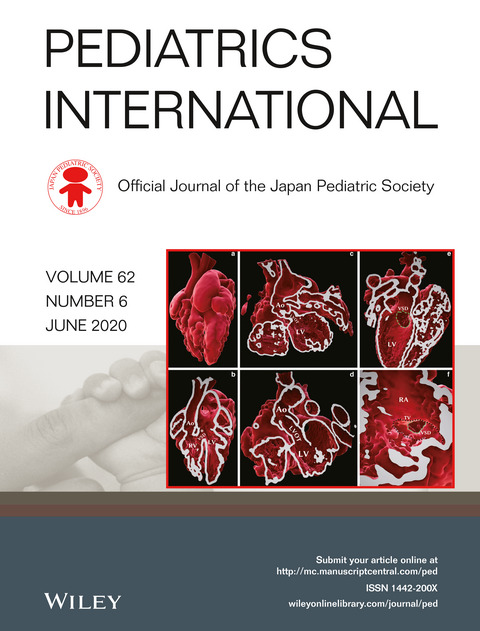
Cover image: 3DCG models for each case. For all cases, the contrast CT scans were 0.5 mm-thick slices and were made within 10 min under spontaneous breathing. Only in the second case was the electrocardiogram synchronized, without any heart-rate controls. (a–b) Case 1. A 1-day-old boy who weighed 2,860 g and was 49 cm tall. (a) Left-anterior oblique overview of the heart. (b) Cross section in case 1. The VSD was located between the left ventricle (LV) and the right ventricle (RV). The asterisk shows the outflow conus muscular portion interrupting the route from the LV to the aorta (Ao) through VSD. (c–d) Case 2. A 2-year-old boy who weighed 8.3 kg and was 73 cm tall. (c) Cross section on the diastole along the long axis of the LVOT. The LVOT is narrowed by a subaortic mass projecting from the interventricular septum. (d) Cross section on the systole. Unlike in the diastole, LVOT is widened. Case 3: a 2-day-old boy who weighed 2,626 g and was 50 cm tall. (e) Cross section seen from lower behind. Looking through the LV cavity, VSD locates close to the outflow tract (broken line). (f) Cross section seen from the right upper corner. Looking from the right atrial cavity (RA), VSD is recognized through the tricuspid valve annulus (TV). This mimics the intra-operative surgeon's view. All letters and broken lines were added to the original images. See A three-dimensional computer graphics tool for congenital heart diseases by Nogimori et al. in pages 738–740. Article link here
ORIGINAL ARTICLES
Allergy/Immunology/Rheumatology
Washing with water alone versus soap in maintaining remission of eczema
- Pages: 663-668
- First Published: 04 March 2020
Endocrinology/Metabolism
Influence of post-disaster evacuation on childhood obesity and hyperlipidemia
- Pages: 669-676
- First Published: 21 January 2020
Infectious diseases
Utilization and efficacy of palivizumab for children with Down syndrome
- Pages: 677-682
- First Published: 21 January 2020
Antimicrobial prescription patterns in a tertiary-care pediatric unit in Thailand
- Pages: 683-687
- First Published: 19 January 2020
Neonatology
Organ blood flow in response to infusion of arginine vasopressin in premature fetal sheep
- Pages: 688-693
- First Published: 09 January 2020
Validity of stress assessment using heart-rate variability in newborns
- Pages: 694-700
- First Published: 20 January 2020
Nephrology/Urology
Desmopressin response in nocturnal enuresis showing concentrated urine
- Pages: 701-704
- First Published: 17 February 2020
Nutrition/Gastroenterology
Celiac disease and hematological abnormalities in children with recurrent aphthous stomatitis
- Pages: 705-710
- First Published: 19 January 2020
Pediatric Surgery
Analysis of predictive factors for perforated appendicitis in children
- Pages: 711-715
- First Published: 19 January 2020
Public Health
Factors associated with sleep duration among pupils
- Pages: 716-724
- First Published: 03 February 2020
Others
Association of methylphenidate use and traditional and cyberbullying in adolescents with ADHD
- Pages: 725-735
- First Published: 05 February 2020
CLINICAL NOTES
Two-incision technique for the subcutaneous implantable cardioverter defibrillator
- Pages: 736-738
- First Published: 19 May 2020
A three-dimensional computer graphics tool for congenital heart diseases
- Pages: 738-740
- First Published: 29 May 2020
Pediatric endoscopy training in a community hospital in Japan
- Pages: 740-741
- First Published: 19 May 2020
Double recurrence of double cancers: Rhabdomyosarcoma and secondary AML
- Pages: 742-744
- First Published: 04 June 2020
Hepatocellular carcinoma with glycogen storage disease type 1a
- Pages: 744-745
- First Published: 24 April 2020
131I-MIBG therapy with WT-1 peptide for refractory neuroblastoma
- Pages: 746-747
- First Published: June 2020
Magnetic foreign bodies in the hypopharynx: Usefulness of video laryngoscopy
- Pages: 748-749
- First Published: 03 June 2020
High prevalence of cholestasis at a tertiary neonatal intensive care unit
- Pages: 749-751
- First Published: June 2020
A retrospective study of 2 or 3 mg/kg/day propranolol for infantile hemangioma
- Pages: 751-753
- First Published: 03 June 2020
Successful treatment of tumor necrosis factor inhibitor-resistant cutaneous polyarteritis nodosa with tocilizumab
- Pages: 753-755
- First Published: 08 June 2020
Changes in laboratory findings in Parechovirus-A infection in nine neonates and infants
- Pages: 755-758
- First Published: 23 June 2020
PHOTOS IN PEDIATRICS
A Pediatrician's Alert: Misdiagnosis of Mixed Localized Scleroderma in a Child
- Pages: 759-761
- First Published: 23 June 2020
LETTER TO THE EDITOR
Improving the feasibility of academic writing by pediatric residents
- Page: 762
- First Published: 23 June 2020
ERRATUM
ANNOUNCEMENTS
Sign up for email alerts
Tools
Official English Journal of Japan Pediatric Society![]()
More from this journal
- Call for Papers
- Author tips: Get read, shared & cited
- School Health Promotion in Japan and its Contribution to Asia and Africa (Updated February 2022)
- The Japan Children's Cancer Group (Updated April 2018)
- Kawasaki Disease (Updated October 2023)
- How much do we know about intractable disease? (Updated March 2016)
- For Reviewers
- Open Science
- Video Gallery

Click here to view the latest trending articles from Pediatrics International