Impact of type 2 diabetes mellitus on short-term and long-term outcomes of patients with esophageal squamous cell cancer undergoing resection: a propensity score analysis
Abstract
Background
The association between type 2 diabetes mellitus (T2DM) and the risk of esophageal cancer remains unclear. The present study aimed to evaluate the impact of T2DM on short-term outcomes and long-term survival in patients with esophageal squamous cell cancer (ESCC).
Methods
The present retrospective study included 862 patients diagnosed with ESCC between January 2001 and December 2010. Among them, 280 patients had T2DM. A 1:1 propensity score-matched cohort consisting of 280 patients with and 280 without T2DM was selected from the 862 patients. The associations between T2DM and clinicopathologic characteristics were assessed using the χ2 or Fisher's exact test. Survival of ESCC patients with and without T2DM was calculated by using the Kaplan–Meier method and compared by using the Cox regression model between the two groups.
Results
The occurrence rate of anastomotic leakage was significantly higher in patients with T2DM than in those without T2DM (P < 0.001). In the subgroup with weight loss rate ≤ 5.05%, ESCC patients with T2DM had a significant longer overall survival than did those without T2DM (P = 0.003), whereas in the subgroup with weight loss rate > 5.05%, the patients without T2DM showed a longer survival (P = 0.001). Univariate and multivariate analysis results showed that T2DM was not an independent prognostic factor for patient survival.
Conclusions
Type 2 diabetes mellitus is not an independent prognostic factor in patients with ESCC. However, the combination of T2DM with severe weight loss would be a predictor of poor prognosis.
Background
Esophageal cancer is the fifth most common cancer in China, with 287,600 patients newly diagnosed each year, and the fourth most frequent cause of cancer-related deaths, accounting for 210,900 deaths each year [1]. In Asian countries, more than 90% of esophageal cancers are esophageal squamous cell carcinomas (ESCC) [2]. Surgery remains the predominant modality in the management of esophageal cancer [3].
Over the past two decades, the markedly increased morbidity of type 2 diabetes mellitus (T2DM) in most countries has suggested a possible association between diabetes mellitus and cancer [4]. T2DM patients have shown an increased incidence of several cancers, including pancreatic cancer [5], liver cancer [6, 7], colorectal cancer [8], gastric cancer [9], and renal cancer [10]. In contrast, a decreased incidence of prostate cancer has been observed in diabetic patients, suggesting a protective effect of diabetes [11]. However, the effect of T2DM on the prognosis of patients with several types of cancer, including lung cancer, remains unclear [12, 13].
Over the past two decades, the association between T2DM and the risk of esophageal cancer has been examined in different population- and hospital-based settings, but these studies have yielded inconsistent results [14, 15]. A recent meta-analysis reported by Huang et al. [16] has supported the hypothesis that men with diabetes may have a modestly increased risk of esophageal cancer. To date, however, the prognostic significance of T2DM in ESCC has not yet been determined. In the present study, we therefore evaluated the effect of T2DM on the prognosis of ESCC patients who underwent curative surgery.
Patients and methods
Study design
The study included patients with histologically proven ESCC who underwent conventional open esophagectomy with 2-field lymphadenectomy at the First Affiliated Hospital of Sun Yat-sen University, the Second Hospital of Lanzhou University, or Sun Yat-sen University Cancer Center between January 2001 and December 2010. Patients were excluded if they (1) had received preoperative or/and postoperative chemotherapy and/or radiotherapy; (2) presented with synchronous primary tumors and/or had previous malignant diseases; (3) underwent R1 or R2 resection; or (4) underwent subtotal/total gastrectomy or had other complications, including hyperthyroidism or active tuberculosis.
A diagnosis of diabetes mellitus is based on a patient's history of diabetes mellitus and/or the use of antidiabetic mediations in the hospital medical record (all diabetes diagnoses should be made on the basis of classification and diagnosis of Diabetes released in 2015) [17]. Blood sugar levels were rigorously controlled by insulin injections during the perioperative period.
To minimize the effect of potential confounders on selection bias, propensity score-matching analysis was performed. Factors related to combined treatment were entered into the propensity model; these factors included age, sex, smoking status, drinking status, weight loss rate, body mass index (BMI), tumor location, tumor grade, pT category, pN category, pathological tumor/node/metastasis (pTNM) stage, and complications. Patients with and without T2DM were matched one-to-one using the optimal matching method. The adjusted comparisons by propensity scores were based on data from the patients with T2DM. After adjustment for these factors, overall survival (OS) rates, baseline characteristics, and were re-analyzed to explore the prognostic factors for the patients with and without T2DM.
Preoperative evaluation included a complete history, a physical examination, complete blood cell counts, serum biochemistry, chest X-rays, barium swallow test, computed tomography (CT) scans of the chest and abdomen, ultrasonic esophagoscopy, and mandatory cardio-pulmonary assessments.
Follow-up
Postoperative follow-up and CT scans were performed every 3 months during the first year, every 6 months during the next 2 years, and once every year thereafter. Contrast CT scans of the lower neck, thorax, and upper abdomen, including the liver and adrenal glands, were routinely performed.

weight2: body weight measured before leaving the hospital.
Because few reports have defined weight loss rate, this parameter was empirically divided into four categories: 0, > 0 to ≤ 5%, > 5% to ≤ 10%, and > 10%.
Complications were estimated from clinical, laboratory, and imaging data. The pTNM stage of each patient was defined according to the criteria of the American Joint Committee on Cancer staging system (2010).
Statistical analysis
All statistical analyses were performed using the SPSS 19.0 software package (IBM, Chicago, IL, USA). OS was defined as the time from the date of surgery to the date of death or final clinical follow-up. All patients lost to follow-up or being alive at the last follow-up were censored. Associations between T2DM and clinicopathologic characteristics were assessed using the χ2 or Fisher's exact test. Survival rates were calculated with Kaplan–Meier curves and compared with log-rank tests. Univariate and multivariate cox regression analyses were controlled for the variables mentioned above. A two-sided P value < 0.05 was considered statistically significant. Receiver operating characteristic (ROC) curve was constructed using Medcalc 12.0 (Medcalc Company, Brussels, Belgium). Propensity score-matched analysis was performed using R software (TIBCO, Silicon Valley, CA, USA).
Results
Patient characteristics
Between January 2001 and December 2010, a total of 2489 patients with ESCC underwent open esophagectomy at the three institutions. The study cohort consisted of 862 patients with ESCC who underwent surgery as primary therapy; 638 (74.0%) of them were male (Fig. 1). Before propensity score matching, the mean age of all patients was 60.1 ± 9.2 years. The median weight loss rate and BMI of these patients were 0.0% (range, 0–18.8%) and 22.06 kg/m2 (range, 14.98–32.96 kg/m2), respectively. After propensity score matching, mean age was 61.8 ± 9.0 years, the median weight loss rate was 3.1% (range, 0–18.8%), and the median BMI was 22.75 kg/m2 (range, 14.98–32.96 kg/m2). The characteristics of the 280 matched T2DM and non-T2DM patients are shown in Table 1. All further statistical analyses were performed on this population.
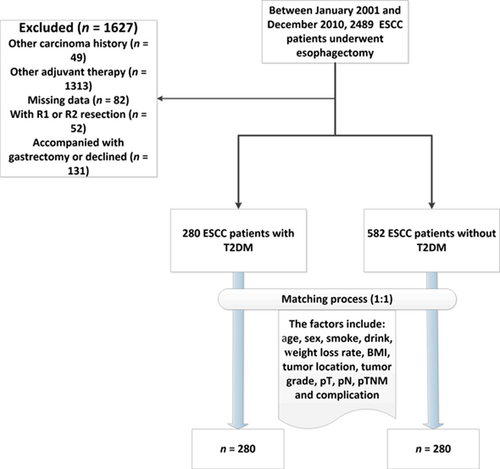
The flow diagram of patient selection. ESCC esophageal squamous cell cancer, T2DM type 2 diabetes mellitus, pT pathological tumor, pN pathological node, pTNM pathological tumor/node/metastasis, BMI body mass index
| Characteristic | Before matching | After matching | ||||||
|---|---|---|---|---|---|---|---|---|
| No. of cases (%) | With T2DM (%) | Without T2DM (%) | P valuea | No. of cases (%) | With T2DM (%) | Without T2DM (%) | P valuea | |
| Age (years) | 0.012 | 0.499 | ||||||
| ≤ 45 | 48 (5.6) | 4 (1.4) | 44 (7.6) | 13 (2.3) | 4 (1.4) | 9 (3.2) | ||
| 46–59 | 370 (42.9) | 112 (40.0) | 258 (44.3) | 225 (40.2) | 112 (40.0) | 113 (40.4) | ||
| ≥ 60 | 444 (51.5) | 164 (58.6) | 280 (48.1) | 322 (57.5) | 164 (58.6) | 158 (56.4) | ||
| Sex | 0.024 | 0.330 | ||||||
| Female | 224 (26.0) | 92 (32.9) | 132 (22.7) | 195 (34.8) | 92 (32.9) | 103 (36.8) | ||
| Male | 638 (74.0) | 188 (67.1) | 450 (77.3) | 365 (65.2) | 188 (67.1) | 177 (63.2) | ||
| Smoking status | < 0.001 | 0.798 | ||||||
| Yes | 362 (42.0) | 160 (57.1) | 202 (34.7) | 317 (56.6) | 160 (57.1) | 157 (56.1) | ||
| No | 500 (58.0) | 120 (42.9) | 380 (65.3) | 243 (43.4) | 120 (42.9) | 123 (43.9) | ||
| Drinking status | 0.060 | 0.754 | ||||||
| Yes | 638 (74.0) | 224 (80.0) | 414 (71.1) | 445 (79.5) | 224 (80.0) | 221 (78.9) | ||
| No | 224 (26.0) | 56 (20.0) | 168 (28.9) | 115 (20.5) | 56 (20.0) | 59 (21.1) | ||
| Weight loss rate | 0.705 | 0.976 | ||||||
| 0 | 474 (55.0) | 144 (51.4) | 330 (56.7) | 292 (52.1) | 144 (51.4) | 148 (52.9) | ||
| > 0% to ≤ 5% | 152 (17.6) | 56 (20.0) | 96 (16.5) | 102 (36.4) | 56 (20.0) | 46 (16.4) | ||
| > 5% to ≤ 10% | 182 (21.1) | 60 (21.4) | 122 (21.0) | 126 (22.5) | 60 (21.4) | 66 (23.6) | ||
| > 10% | 54 (6.3) | 20 (7.2) | 34 (5.8) | 40 (7.1) | 20 (7.1) | 20 (7.1) | ||
| BMI (kg/m2) | 0.006 | 0.409 | ||||||
| < 18.5 | 76 (8.8) | 8 (2.9) | 68 (11.7) | 34 (6.0) | 8 (2.9) | 26 (9.3) | ||
| ≥ 18.5 to < 25.0 | 622 (72.2) | 208 (74.3) | 414 (71.1) | 393 (70.2) | 208 (74.3) | 185 (66.1) | ||
| ≥ 25.0 | 164 (19.0) | 64 (22.8) | 100 (17.2) | 133 (23.8) | 64 (22.9) | 69 (24.6) | ||
| Tumor location | 0.052 | 0.590 | ||||||
| Upper | 58 (6.7) | 20 (7.1) | 38 (6.5) | 34 (6.0) | 20 (7.1) | 14 (5.0) | ||
| Middle | 560 (65.0) | 160 (57.2) | 400 (68.7) | 337 (60.2) | 160 (57.1) | 177 (63.2) | ||
| Lower | 244 (28.3) | 100 (35.7) | 144 (24.8) | 189 (33.8) | 100 (35.7) | 89 (31.8) | ||
| Tumor grade | 0.206 | 0.992 | ||||||
| G1 | 232 (26.9) | 80 (28.6) | 152 (26.1) | 148 (26.4) | 80 (28.6) | 68 (24.3) | ||
| G2 | 386 (44.8) | 120 (42.8) | 266 (45.7) | 264 (47.2) | 120 (42.9) | 144 (51.4) | ||
| G3 | 244 (28.3) | 80 (28.6) | 164 (28.2) | 148 (26.4) | 80 (28.5) | 68 (24.3) | ||
| pT category | 0.231 | 0.236 | ||||||
| T1 | 48 (5.6) | 8 (2.9) | 40 (6.9) | 18 (3.2) | 8 (2.9) | 10 (3.6) | ||
| T2 | 232 (26.9) | 76 (27.1) | 156 (26.8) | 163 (29.1) | 76 (27.1) | 87 (31.1) | ||
| T3 | 582 (67.5) | 196 (70.0) | 386 (66.3) | 379 (67.7) | 196 (70.0) | 183 (65.3) | ||
| pN category | 0.284 | 0.870 | ||||||
| N0 | 476 (55.2) | 144 (51.4) | 332 (57.1) | 285 (50.9) | 144 (51.4) | 141 (50.4) | ||
| N1 | 242 (28.1) | 80 (28.6) | 162 (27.8) | 172 (30.7) | 80 (28.6) | 92 (32.8) | ||
| N2 | 124 (14.4) | 52 (18.6) | 72 (12.4) | 96 (17.1) | 52 (18.6) | 44 (15.7) | ||
| N3 | 20 (2.3) | 4 (1.4) | 16 (2.7) | 7 (1.3) | 4 (1.4) | 3 (1.1) | ||
| pTNM stage | 0.161 | 0.947 | ||||||
| Stage I | 46 (5.3) | 8 (2.9) | 38 (6.5) | 20 (3.6) | 8 (2.9) | 12 (4.3) | ||
| Stage II | 450 (52.2) | 140 (50.0) | 310 (53.3) | 273 (48.7) | 140 (50.0) | 133 (47.5) | ||
| Stage III | 366 (42.5) | 132 (47.1) | 234 (40.2) | 267 (47.7) | 132 (47.1) | 135 (48.2) | ||
| Complication | ||||||||
| None | 718 (83.3) | 216 (77.1) | 502 (86.3) | 0.018 | 458 (81.8) | 216 (77.1) | 242 (86.4) | 0.004 |
| Anastomotic leakage | 82 (9.5) | 48 (17.1) | 34 (5.8) | 0.001 | 60 (10.7) | 48 (17.1) | 12 (4.3) | < 0.0001 |
| Pneumonia | 32 (3.7) | 8 (2.9) | 24 (4.1) | 0.515 | 22 (3.9) | 8 (2.9) | 14 (5.0) | 0.192 |
| Othersb | 30 (3.5) | 8 (2.9) | 22 (3.8) | 0.624 | 20 (3.6) | 8 (2.9) | 12 (4.3) | 0.363 |
| Total | 862 | 280 | 582 | 560 | 280 | 280 | ||
- ESCC esophageal squamous cell carcinoma, T2DM type 2 diabetes mellitus; Non-DM patients without type 2 diabetes mellitus; BMI body mass index, pT pathological tumor, pN pathological node, pTNM stage pathological tumor/node/metastasis
- a Chi square test or Fisher's exact test
- b Other complications include surgical wound infection, chyle leakage, cardiac complications, and cerebral infarction
Patient characteristics by T2DM
Of the 862 patients, 280 (32.5%) had T2DM and 582 (67.5%) did not. These two groups were well matched in weight loss rate, tumor location, tumor grade, pT category, pN category, and pTNM stage. However, the patients with T2DM were significantly older (P = 0.012), had higher percentage of smoking (P < 0.001), had a significantly higher percentage of female (P = 0.024), had a significantly higher BMI (P = 0.006), had significantly higher probability of no complications (P = 0.018), and had higher rates of postoperative anastomotic leakage (P = 0.001) than the patients without T2DM. After propensity score matching, all characteristics in the two groups were well matched, expect for the probability of no complication (P = 0.004) and postoperative anastomotic leak (P < 0.001) (Table 1).
Overall survival and T2DM
The median and mean OS were 45.5 and 39.0 months, respectively. The 1-, 3-, and 5-year OS rates for the entire patient cohort were 86.6%, 53.2%, and 30.2%, respectively (Fig. 2a). Log-rank test showed that the OS rate tended to be higher in ESCC patients with T2DM than in those without T2DM, but the difference between them was not significant (P= 0.563, Fig. 2b).
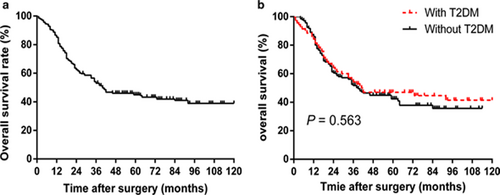
The Kaplan–Meier overall survival curves for a the entire cohort of patients with esophageal squamous cell cancer and b esophageal cancer patients with and without type 2 diabetes mellitus (T2DM)
The modeled area under curve (AUC) for weight loss rate was 0.593 (P < 0.001, 95% confidence interval [CI] 0.551–0.634; Fig. 3). The diagnostic value of the weight loss rate was significantly associated with AUC, with the cutoff points for weight loss rate being 5.05%; the sensitivity and specificity of cutoff points were 0.616 and 0.595, respectively.
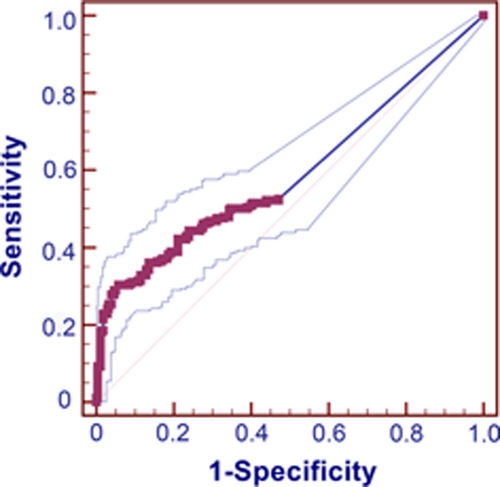
The area under receiver operating characteristic (ROC) curves for weight loss rate in patients with esophageal squamous cell cancer
Subgroup analysis of patients with low weight loss rate (≤ 5.05%) showed that survival was significantly longer in patients with T2DM than in those without T2DM (P= 0.003, Fig. 4a). In contrast, analysis of patients with high weight loss rate (> 5.05%) showed that survival was significantly shorter in patient with T2DM than in those without T2DM (P= 0.001, Fig. 4b).
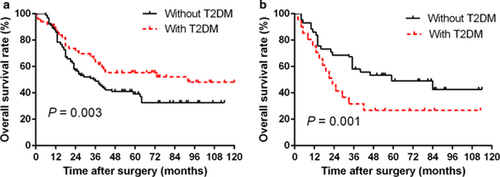
Overall survival curves for the esophageal cancer patients with weight loss rate ≤ 5.05% (a) and > 5.05% (b), retrospectively, according to the presence or absence of type 2 diabetes mellitus
Univariate and multivariable analyses
Univariate analysis showed that T2DM was not significantly associated with patient survival. In contrast, sex (hazard ratio [HR] 0.769; P = 0.030), weight loss rate (HR 1.168; P = 0.005), tumor grade (HR 1.489; P < 0.001), pT category (HR 1.642; P < 0.001), pN category (HR 1.820; P< 0.001), and pTNM stage (HR 2.270; P < 0.001) were significantly associated with the survival of patients with ESCC (Table 2). In multivariate analysis, only tumor grade (HR 1.373; P< 0.001) and pN category (HR 1.474; P= 0.001) were significantly associated with patient survival (Table 2).
| Characteristic | Univariate analysis | Multivariate analysis | ||||
|---|---|---|---|---|---|---|
| HR | 95% CI | P value | HR | 95% CI | P value | |
| Age (years) | ||||||
| ≤ 45 vs. 46–59 vs. ≥ 60 | 1.002 | 0.990–1.015 | 0.720 | – | – | – |
| Sex | ||||||
| Female vs. male | 0.769 | 0.607–0.975 | 0.030 | 0.865 | 0.680–1.101 | 0.239 |
| Smoking status | ||||||
| Yes vs. no | 1.176 | 0.944–1.465 | 0.149 | – | – | – |
| Drinking status | ||||||
| Yes vs. no | 1.195 | 0.922–1.548 | 0.178 | – | – | – |
| Weight loss rate | ||||||
| 0 vs. > 0% to ≤ 5.0% vs. > 5.0% to ≤ 10.0% vs. > 10.0% | 1.168 | 1.047–1.302 | 0.005 | 1.118 | 1.000–1.251 | 0.060 |
| BMI (kg/m2) | ||||||
| < 18.5 vs. ≥ 18.5 to < 25.0 vs. ≥ 25.0 | 0.970 | 0.779–1.207 | 0.784 | – | – | – |
| Tumor location | ||||||
| Upper vs. middle vs. lower | 0.932 | 0.767–1.134 | 0.483 | – | – | – |
| Tumor grade | ||||||
| G1 vs. G2 vs. G3 | 1.489 | 1.271–1.745 | < 0.001 | 1.373 | 1.164–1.621 | < 0.001 |
| pT category | ||||||
| T1 vs. T2 vs. T3 vs. T4 | 1.642 | 1.308–2.062 | < 0.001 | 1.257 | 0.982–1.611 | 0.070 |
| pN category | ||||||
| N0 vs. N1 vs. N2 vs. N3 | 1.820 | 1.594–2.079 | < 0.001 | 1.474 | 1.181–1.839 | 0.001 |
| pTNM stage | ||||||
| Stage I vs. stage II vs. stage III | 2.270 | 1.832–2.813 | < 0.001 | 1.237 | 0.872–1.754 | 0.233 |
| Complications | ||||||
| None vs. anastomotic leakage vs. pneumonia vs. others | 1.118 | 0.961–1.299 | 0.148 | – | – | – |
| T2DM | ||||||
| With T2DM vs. without T2DM | 0.896 | 0.719–1.116 | 0.326 | – | – | – |
- ESCC esophageal squamous cell carcinoma, BMI body mass index, T2DM type 2 diabetes mellitus, pT pathological tumor, pN pathological node, pTNM stage pathological tumor/node/metastasis, HR hazard ratio, 95% CI 95% confidence interval, – no comparison
Discussion
The present study found no significant difference in OS between the ESCC patients with T2DM and those without T2DM. Analysis of the subgroup of patients with weight loss rate ≤ 5.05% showed that OS was significantly longer in patients with T2DM than in those without T2DM, whereas analysis of the subgroup with weight loss rate > 5.05% showed that OS was significantly shorter in patients with T2DM than in those without T2DM.
Although the underlying impact of T2DM on ESCC prognosis is unclear, several possible mechanisms have been proposed. Metabolic abnormalities associated with diabetes, such as insulin resistance, compensatory hyperinsulinemia, and elevated levels of bioactive insulin-like growth factor and/or chronic inflammation, can stimulate cancer cell mitogenesis, proliferation, invasion, and metastasis, enhancing tumorigenesis and progression [19]. Hyperinsulinemia has been shown to increase bioavailable estrogen and testosterone [20], sex hormones that play a role in the development of ESCC [21]. In addition, early evidence suggests that some treatments of diabetes may affect cancer risk [19]. For example, exposure to metformin was reported to be significantly associated with prolonged survival in patients with various types of cancer, including thyroid cancer [22], colorectal cancer [23], laryngeal squamous cell cancer [24], melanoma [25], and pancreatic cancer [26]. Delayed gastric emptying is frequent in patients with diabetes, increasing the likelihood of gastric/esophageal reflux, a risk factor for ESCC [27–29]. However, the association between T2DM and ESCC remains complicated and ambiguous, including a need for additional studies.
The present study showed that T2DM was associated with several clinical factors of patients with ESCC. In accordance with the previous studies [30, 31], we found that T2DM was more likely to occur in older patients, women, patients with a history of smoking, and patients with a high BMI. Our findings also demonstrated that the rate of anastomotic leakage was almost threefold higher in patients with T2DM than in those without T2DM. One of the adverse consequences of hyperglycemia is wound healing delay, which may lead to anastomotic leakage [31].
Interestingly, survival benefits seen in patients with T2DM have been reported to depend on more frequent and regular consultations, resulting in an earlier diagnosis [11]. However, because of the drawbacks of our clinical follow-up data, we could not compare the frequencies of consultations between the two groups of patients.
Despite the potential contributions of T2DM to survival benefits in patients with ESCC, the effect of T2DM on metabolism cannot be ignored. Nutritional support remains a cornerstone in the management of ESCC and has been shown to ameliorate patients’ tolerance of treatment, quality of life, and long-term outcomes. The combination of ESCC and T2DM may present great challenges to patients in a multitude of nutrition-related areas. Severe weight loss, which may result from dysphagia, cancer-related cachexia, and/or uncontrolled diabetes mellitus, is a prognostic factor in patients with ESCC [32]. Based on these considerations, a logical and plausible interpretation of our findings was that severe weight loss may mask the negative prognostic effect of T2DM in patients with ESCC.
Despite showing the impact of T2DM on the prognosis of ESCC patients, the present study had several limitations. First, our study was a retrospective study, and the number of patients was relatively small, particularly in subgroup analyses, which increases the likelihood of spurious associations. Second, this study did not evaluate the usage of anti-diabetic drugs and the frequency of consultations because of incomplete clinical data. Therefore, additional investigations, especially multi-center prospective randomized controlled trials with adequate statistical power are required to determine whether and how T2DM affects the survival of patients with ESCC.
Conclusions
Type 2 diabetes mellitus was not found to be an independent prognostic factor of OS in patients with ESCC. However, the combination of T2DM and severe weight loss may be used as a predictor of poor prognosis.
Abbreviations
-
- BMI
-
- body mass index
-
- EC
-
- esophageal cancer
-
- ESCC
-
- esophageal squamous cell cancer
-
- HR
-
- hazard ratio
-
- T2DM
-
- type 2 diabetes mellitus
-
- OS
-
- overall survival
-
- pT
-
- pathological tumor
-
- pN
-
- pathological node
-
- pTNM
-
- pathological tumor/node/metastasis
-
- 95% CI
-
- 95% confidence interval
-
- CT
-
- computed tomography
-
- ROC
-
- receiver operating characteristic
Authors’ contributions
Contributions: (I) conception and design: WY, JHH; (II) administrative support: ZHZ, JPL; (III) provision of study materials or patients: WY, YQM; (IV) collection and assembly of data: WY, MJL; (V) data analysis and interpretation: WY, WZF. All authors read and approved the final manuscript.
Acknowledgements
Not applicable.
Competing interests
The authors declare that they have no competing interests.
Availability of data and materials
The datasets used and/or analyzed during the current study available from the corresponding author on reasonable request.
Consent publication
Not applicable.
Ethics approval and consent to participate
The study was approved by Ethics Committee of the Sun-Yat Sen University, Guangzhou and Lanzhou University, Lanzhou.
Funding
There is not any funding for supporting this study.


