A Predictive Model for Acute Kidney Injury Based on Leukocyte-Related Indicators in Hepatocellular Carcinoma Patients Admitted to the Intensive Care Unit
Abstract
Background: This study aimed to develop and validate a straightforward clinical risk model utilizing white blood cell (WBC) counts to predict acute kidney injury (AKI) in critically sick patients with hepatocellular carcinoma (HCC).
Methods: Data were taken from the Medical Information Mart for Intensive Care-IV (MIMIC-IV) database for the training cohort. Data for an internal validation cohort were obtained from the eICU Collaborative Research Database (eICU-CRD), while patients from our hospital were utilized for external validation. A risk model was created utilizing significant indicators identified through multivariate logistic regression, following logistic regression analysis to determine the primary predictors of WBC-related biomarkers for AKI prediction. The Kaplan–Meier curve was employed to evaluate the prognostic efficacy of the new risk model.
Results: A total of 1628 critically sick HCC patients were enrolled. Among these, 23 (23.2%) patients at our hospital, 84 (17.9%) patients in the eICU-CRD database, and 379 (35.8%) patients in the MIMIC-IV database developed AKI. A unique risk model was developed based on leukocyte-related indicators following the multivariate logistic regression analysis, incorporating white blood cell to neutrophil ratio (WNR), white blood cell to monocyte ratio (WMR), white blood cell to hemoglobin ratio (WHR), and platelet to lymphocyte ratio (PLR). This risk model exhibited robust predictive capability for AKI, in-hospital mortality, and ICU mortality across the training set, internal validation set, and external validation set.
Conclusion: This risk model seems to have practical consequences as an innovative and accessible tool for forecasting the prognosis of critically ill HCC patients, which may, to some degree, aid in identifying equitable risk assessments and treatment strategies.
1. Introduction
Acute kidney injury (AKI) frequently occurs in hospitalized individuals. The intensive care unit (ICU) exhibited a higher rate of AKI compared to the general population. Mandelbaum et al. [1] reported that stage I AKI occurred in 57% of critically sick patients, with a death incidence of 13.9% among those who developed AKI, compared to 6.2% in those who did not. Nisula et al. [2] reported that 17 Finnish ICUs had a 39.3% incidence of AKI. Individuals with AKI incur care costs around ten times more, alongside an elevated chance of developing chronic kidney disease (CKD) and heightened morbidity and mortality rates [3–5].
Hepatocellular carcinoma (HCC), a highly prevalent cancer, constitutes 8.2% of global cancer-related deaths [6]. A prior study indicated that individuals with HCC often experienced AKI. A substantial cohort study of a Danish population revealed that 33% of HCC patients experienced AKI within 1 year [7]. Moreover, patients with HCC who experienced AKI exhibited a poorer prognosis compared to those without AKI. Following hepatectomy for HCC, Lim et al. [8] found that patients with AKI exhibited significantly elevated mortality and major morbidity rates (37% and 69%) compared to those without AKI (6% and 22%). Consequently, the identification of biomarkers for the early detection of AKI is crucial for the prompt provision of suitable clinical care for HCC patients in ICU environments.
AKI prediction is a pressing concern for critically ill patients. AKI has been associated with many biomarkers, such as neutrophil gelatinase-associated lipocalin (NGAL), cystatin C, and kidney injury molecule-1 (KIM-1) [9]. However, due to their high cost, acquiring these predictors proved challenging. Some severity scores have been utilized in predicting AKI. Nonetheless, these scoring methods exhibit inadequate specificity and sensitivity and have not been implemented in clinical environments [10]. Consequently, a risk model that is easily accessible and demonstrates robust predictive ability is essential for AKI prediction in critically sick patients.
Numerous researchers have determined that predicting AKI in ICU environments using markers related to white blood cells (WBCs) is straightforward. The preoperative systemic immune-inflammation index (SII) has been identified as a unique, independent predictor of postoperative AKI in patients with HCC [11]. The predictive capabilities of the WBC-related indicators-based risk model for AKI prediction in critically ill HCC patients remain unexamined. This study aimed to develop an AKI prediction model for HCC patients in ICU environments by using leukocyte-related indicators.
2. Methods
2.1. Data Source
The data of this study were extracted from the Medical Information Mart for Intensive Care IV database (MIMIC-IV) [12], the eICU Collaborative Research Database (eICU-CRD) [13] and the Renmin Hospital of Wuhan University. The Declaration of Helsinki was followed when conducting the study. Due to the data used in this study were extracted from public databases, it was exempt from the requirement for informed consent from patients and approval of the ethics review committee. We were given authorization to take information out of the eICU-CRD and MIMIC-IV databases [14].
2.2. Study Population
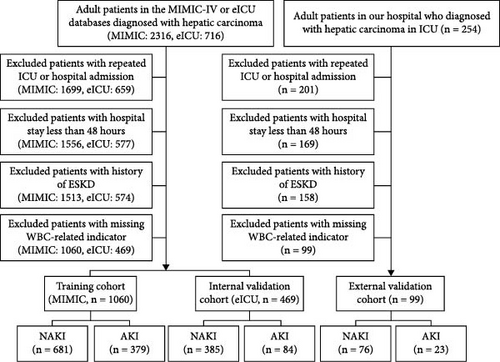
We extracted adult HCC patients from the eICU-CRD database, MIMIC-IV, and the ICU of Renmin Hospital of Wuhan University using ICD-9 and ICD-10 diagnosis codes, covering the period from January 2021 to July 2022. AKI was diagnosed according to KDIGO-AKI criteria based on serum creatinine levels within the initial 48 h after ICU admission [15]. Patients deemed ineligible possess one of the following conditions: Patients with less than 48 h in the hospital, recurrent ICU or hospital admissions, end-stage renal disease (ESRD), and those with absent values for WBC-related indicators had all missing values for WBC-related indicators completely deleted. The eICU-CRD database provided the internal validation cohort, whilst the MIMIC-IV database constituted the training cohort. Furthermore, data obtained from our hospital served as external validation (Figure 1).
2.3. Clinic Variables and Outcomes
The retrieved variables include demographics, vital signs, laboratory tests, scoring systems, complications, comorbidities, and drug usage. All data were gathered within 24 h of ICU admission. The specific variables were presented in Table 1. The principal outcome was AKI, determined according to the KDIGO guidelines for serum creatinine levels within 48 h. The secondary outcomes encompassed the severity of AKI, duration from ICU admission to new AKI onset, persistence of AKI, progression of AKI, utilization of continuous renal replacement therapy (CRRT), administration of vasopressors, application of mechanical ventilation, use of diuretics, incidence of acute heart failure, acute respiratory failure, acute hepatic failure, sepsis, length of ICU stay, length of hospital stay, in-hospital mortality, and ICU mortality. AKI progression, AKI recovery, and persistent AKI were identified according to the prior findings [16]. New AKI was identified in patients who did not exhibit AKI within the initial 48 h of ICU admission but subsequently acquired AKI during their continued ICU stay.
| Characteristics | Training set (n = 1060) | Internal validation set (n = 469) | ||||
|---|---|---|---|---|---|---|
| No AKI (n = 681) | AKI (n = 379) | p Value | No AKI (n = 385) | AKI (n = 84) | p Value | |
| Age, years old | 65.9 ± 12.2 | 65.7 ± 11.7 | 0.833 | 63.9 ± 12.0 | 63.6 ± 12.8 | 0.803 |
| Gender, male (n, %) | 378 (55.5) | 269 (71.0) | <0.001 | 177 (46.0) | 42 (50.0) | 0.583 |
| Weight (kg) | 74.6 ± 18.4 | 82.7 ± 21.4 | <0.001 | 80.4 ± 22.0 | 82.2 ± 24.4 | 0.495 |
| Ethnicity (n, %) | — | — | 0.264 | — | — | 0.608 |
| White | 489 (71.8) | 254 (67.0) | — | 281 (73.0) | 60 (71.4) | — |
| Black | 81 (11.9) | 53 (14.0) | — | 79 (20.5) | 16 (19.0) | — |
| Others | 111 (16.3) | 72 (19.0) | — | 25 (6.5) | 8 (9.5) | — |
| Comorbidities (n, %) | — | — | — | — | — | — |
| Myocardial infarction | 61 (9.0) | 28 (7.4) | 0.443 | 15 (3.9) | 8 (9.5) | 0.059 |
| Congestive heart failure | 101 (14.8) | 63 (16.6) | 0.494 | 27 (7.0) | 8 (9.5) | 0.573 |
| Hypertension | 246 (36.1) | 135 (35.6) | 0.923 | 172 (44.7) | 37 (44.0) | 1.000 |
| Diabetes | 163 (23.9) | 110 (29.00 | 0.081 | 104 (27.0) | 4 (4.8) | 0.610 |
| Chronic kidney disease | 87 (12.8) | 63 (16.6) | 0.103 | 27 (7.0) | 4 (4.8) | 0.610 |
| Other liver disease | 196 (28.8) | 188 (49.6) | <0.001 | 39 (10.1) | 8 (9.5) | 1.000 |
| CCI, points | 10.0 ± 2.6 | 10.0 ± 2.6 | 0.875 | 7.8 ± 3.8 | 7.7 ± 3.2 | 0.771 |
| Drugs usage (n, %) | — | — | — | — | — | — |
| ACEI/ARB | 96 (14.1) | 54 (14.2) | 1.000 | 64 (16.6) | 14 (16.7) | 1.000 |
| β blockers | 288 (42.3) | 185 (48.8) | 0.047 | 145 (37.7) | 31 (36.9) | 0.996 |
| Calcium channel blockers | 71 (10.4) | 63 (16.6) | 0.005 | 35 (9.1) | 12 (32.1) | 0.701 |
| Score system, points | — | — | — | — | — | — |
| SOFA | 4.9 ± 2.3 | 9.1 ± 4.2 | <0.001 | 4.6 ± 1.5 | 5.8 ± 2.3 | <0.001 |
| OASIS | 31.1 ± 7.8 | 36.7 ± 9.3 | <0.001 | 21.7 ± 9.6 | 25.0 ± 10.4 | 0.009 |
| APSIII | 48.6 ± 21.3 | 73.7 ± 27.6 | <0.001 | 45.0 ± 21.8 | 54.7 ± 27.1 | <0.001 |
| SAPSII | 41.2 ± 11.9 | 53.9 ± 15.5 | <0.001 | — | — | — |
| Vital signs | — | — | — | — | — | — |
| MAP (mmHg) | 82.8 ± 16.4 | 76.7 ± 18.6 | <0.001 | 85.1 ± 20.0 | 88.7 ± 16.5 | 0.123 |
| Heart rate (bpm) | 97.4 ± 20.3 | 97.7 ± 22.4 | 0.856 | 84.4 ± 20.6 | 96.1 ± 21.1 | 0.487 |
| RR (bpm) | 20.0 ± 5.6 | 21.0 ± 6.8 | 0.006 | 20.1 ± 6.2 | 19.7 ± 6.3 | 0.660 |
| SpO2 (%) | 96.5 ± 4.1 | 96.2 ± 3.9 | 0.253 | 96.8 ± 3.0 | 96.7 ± 3.2 | 0.716 |
| Laboratory values | — | — | — | — | — | — |
| White blood cell, ×109/L | 11.6 ± 4.9 | 11.5 ± 4.8 | 0.764 | 11.5 ± 4.3 | 12.7 ± 5.3 | 0.206 |
| Hemoglobin (g/dL) | 10.1 ± 2.1 | 10.4 ± 2.2 | 0.023 | 10.6 ± 2.3 | 11.0 ± 2.7 | 0.135 |
| Platelet, ×109/L | 206.6 ± 101.1 | 196.1 ± 98.9 | 0.236 | 213.3 ± 103.5 | 205.9 ± 100.6 | 0.642 |
| Albumin (g/dL) | 3.1 ± 0.6 | 2.8 ± 0.6 | <0.001 | 2.9 ± 0.7 | 2.4 ± 0.8 | <0.001 |
| Bilirubin (mmol/L) | 2.3 ± 1.3 | 4.1 ± 1.6 | <0.001 | 2.5 ± 1.4 | 3.6 ± 1.7 | 0.038 |
| Anion gap (mEq/L) | 14.8 ± 3.9 | 15.4 ± 4.8 | 0.021 | 11.5 ± 5.1 | 12.3 ± 5.1 | 0.225 |
| Bicarbonate (mEq/L) | 23.0 ± 4.6 | 22.2 ± 4.7 | 0.013 | 23.2 ± 5.2 | 23.2 ± 5.2 | 0.962 |
| BUN (mg/dL) | 24.6 ± 9.2 | 30.7 ± 11.8 | <0.001 | 25.6 ± 11.9 | 36.0 ± 10.9 | <0.001 |
| Creatinine (mg/dL) | 1.1 ± 0.5 | 1.5 ± 0.6 | <0.001 | 1.2 ± 0.4 | 1.6 ± 0.5 | <0.001 |
| Potassium (mmol/L) | 4.2 ± 0.7 | 4.4 ± 0.9 | <0.001 | 4.3 ± 0.8 | 4.3 ± 0.9 | 0.703 |
| Sodium (mmol/L) | 136.3 ± 5.6 | 135.9 ± 5.2 | 0.239 | 135.0 ± 6.4 | 135.8 ± 5.5 | 0.309 |
- Note: Bold indicates a p-value less than 0.05.
- Abbreviations: AKI, acute kidney injury; APSIII, acute physiology score III; BUN, blood urea nitrogen; CCI, Charlson comorbidity index; MAP, mean arterial pressure; OASIS, oxford acute severity of illness score; RR, respiratory rate; SAPSII, simplified Acute Physiology Score II; SIRS, systemic inflammatory response syndrome; SOFA, sequential organ failure assessment; SpO2, saturation of peripheral oxygen.
2.4. Statistical Analysis
All analyses were conducted using R (version 4.1.0). A statistically significant difference was established as p < 0.05. A novel AKI prediction risk model (risk score = 1.22 × WNR + 1.03 × lg(WMR) + 0.97 × WHR + 0.87 × lg(PLR)) was derived from the outcomes of a multivariate logistic regression analysis. The optimal cutoff value for the novel risk model was determined utilizing the receiver operating characteristic curve (ROC). Based on the optimal cutoff value, the high-risk and low-risk groups were established. The clinical utility of the risk model was evaluated by decision curve analysis (DCA). Furthermore, univariate and multivariate logistic regressions were conducted to assess the risk model for predicting diverse clinical outcomes. The forest plot displayed subgroup analysis. Waterfall plots were employed to demonstrate the relationship between risk scores and clinical outcomes [17]. We adhered to the methodologies outlined by Huang et al. [18] and Cai et al. [19].
3. Results
3.1. Characteristics
Finally, 1628 critically ill HCC patients were enrolled. AKI occurred in 23 (23.2%) patients in our hospital, 379 (35.8%) patients in the MIMIC-IV database, and 84 (17.9%) patients in the eICU-CRD database. Patients were divided into two groups: those with and those without AKI. The baseline characteristics were depicted in Table 1 and Supporting Information Table S1.
3.2. A Novel Risk Model Was Established Based on White Blood Cell-Related Indicators
The logistic regression analysis was performed to identify the potential predictors for AKI and the WNR, WMR, WHR, and platelet to lymphocyte ratio (PLR) were included (Table 2), hence, the prediction risk model was as follows: 1.22 × WNR + 1.03 × lg(WMR) + 0.97 × WHR + 0.87 × lg(PLR).
| Univariate | Multivariate | |||||
|---|---|---|---|---|---|---|
| β | OR (95% CI) | p | β | OR (95% CI) | p | |
| WNR | 1.154 | 3.17 (2.52–3.99) | <0.001 | 1.220 | 3.39 (2.66–4.32) | <0.001 |
| WMR | 0.021 | 1.02 (1.01–1.03) | <0.001 | — | — | — |
| Lg (WMR) | 1.303 | 3.68 (2.30–5.90) | <0.001 | 1.031 | 2.81 (1.48–5.32) | 0.002 |
| WLR | 0.019 | 1.02 (1.01–1.03) | <0.001 | — | — | — |
| Lg (WLR) | 0.985 | 2.68 (1.83–3.91) | <0.001 | 0.020 | 1.02 (0.51–2.04) | 0.955 |
| WER | 0.004 | 1.00 (1.00–1.01) | <0.001 | — | — | — |
| Lg (WER) | 0.275 | 1.32 (1.11–1.56) | <0.001 | −0.186 | 0.83 (0.65–1.46) | 0.653 |
| WBR | 0.005 | 1.01 (1.00–1.01) | <0.001 | — | — | — |
| Lg (WBR) | 0.759 | 2.14 (1.62–2.81) | <0.001 | 0.274 | 1.32 (0.86–2.00) | 0.201 |
| WHR | 0.808 | 2.24 (1.84–2.74) | <0.001 | 0.970 | 2.64 (1.97–3.54) | <0.001 |
| NLR | 0.026 | 1.03 (1.02–1.04) | <0.001 | 0.011 | 1.01 (0.98–1.04) | 0.176 |
| PLR | 0.001 | 1.00 (1.00–1.00) | <0.001 | — | — | — |
| Lg (PLR) | 0.593 | 1.81 (1.34–2.45) | <0.001 | 0.870 | 2.39 (1.56–3.64) | <0.001 |
| MLR | 0.061 | 1.06 (0.99–1.13) | 0.052 | — | — | — |
| SII | 0.011 | 1.01 (1.00–1.02) | 0.013 | — | — | — |
| Lg (SII) | 0.321 | 1.38 (1.12–1.70) | 0.002 | −0.128 | 0.88 (0.60–1.30) | 0.522 |
- Note: Bold indicates a p-value less than 0.05.
- Abbreviations: AKI, acute kidney injury; OR, odds ratio; NLR, neutrophil to lymphocyte ratio; 95%CI, 95% confidence index; MLR, monocyte to lymphocyte ratio; PLR, platelets to lymphocyte ratio; SII, systemic immune-inflammation index; WBC, white blood count; WBR, WBC to basophils ratio; WER, WBC to eosinophils ratio; WHR, WBC to hemoglobin ratio; WLR, WBC to lymphocyte ratio; WMR, WBC to monocyte ratio; WNR, WBC to neutrophil ratio.
3.3. The Novel Model’s Performance in Acute Kidney Injury Prediction
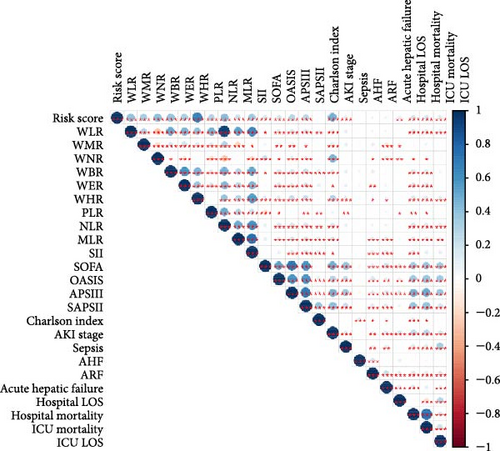
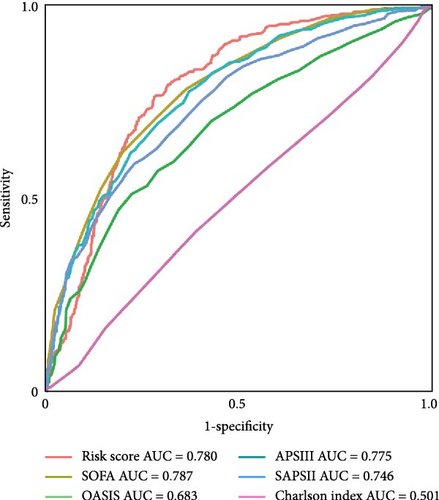
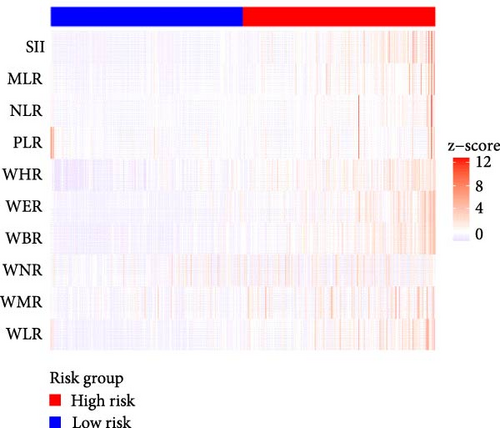
Figure 2A demonstrates a substantial correlation between the risk score and WBC-related markers, severity scores, and clinical outcomes in the training set. The findings indicated that the WBC-related risk model (AUC: 0.780) exhibited a robust predictive capability for AKI in comparison to the SOFA score (AUC: 0.787) and APSIII score (AUC: 0.775). Furthermore, our risk model demonstrated superior AKI prediction ability compared to the OASIS score (AUC: 0.683, Figure 2B), SAPSII score (AUC: 0.746, Figure 2B), and Charlson index (AUC: 0.501, Figure 2B) within the training set. ROC analysis was used to ascertain the best cut-off value for the WBC-related indicators-based risk model, then categorizing participants into low-risk (≤ 6.37) and high-risk (> 6.37) groups based on this value. Table 3 demonstrated the variation in serum creatinine levels prior to and subsequent to the diagnosis of AKI. The findings indicated that the high-risk group exhibited elevated serum creatinine levels at ICU admission, at the initial AKI diagnosis, at 48 h post-diagnosis, and showed positive alterations in serum creatinine within the training set. In the internal validation set, the high-risk group had elevated serum creatinine levels at ICU admission, at the first AKI diagnosis, and 48 h post-AKI diagnosis in comparison to the low-risk group (p < 0.05, Table 3).
| Variables | High-risk group | Low-risk group | p Value |
|---|---|---|---|
| In training set | — | — | — |
| Serum creatinine at ICU admission, mean ± SD | 1.58 ± 0.71 | 1.41 ± 0.65 | 0.046 |
| Serum creatinine at ICU admission, median (IQR) | 1.30 (1.90, 1.88) | 1.10 (0.80, 1.60) | — |
| Serum creatinine at first AKI diagnosis, mean ± SD | 2.36 ± 1.56 | 2.00 ± 0.92 | 0.041 |
| Serum creatinine at first AKI diagnosis, median (IQR) | 1.80 (1.30, 3.10) | 1.60 (1.10, 2.40) | — |
| Serum creatinine at 48 h after AKI diagnosis, mean ± SD | 2.65 ± 1.30 | 2.10 ± 1.15 | <0.001 |
| Serum creatinine at 48 h after AKI diagnosis, median (IQR) | 1.90 (1.40, 3.30) | 1.60 (1.20, 2.60) | — |
| Positive changes of serum creatinine (n) (%) | 150 (51.4) | 43 (49.4) | — |
| ΔSerum creatinine, mean ± SD | 0.87 ± 0.69 | 0.41 ± 0.28 | <0.001 |
| Negative or static change of serum creatinine (n) (%) | 142 (48.6) | 44 (50.6) | — |
| ΔSerum creatinine, mean ± SD | −0.41 ± 0.30 | −0.43 ± 0.26 | 0.689 |
| In internal validation set | — | — | — |
| Serum creatinine at ICU admission, mean ± SD | 1.83 ± 0.96 | 1.46 ± 0.69 | 0.046 |
| Serum creatinine at ICU admission, median (IQR) | 1.35 (0.99, 2.17) | 1.24 (0.83, 1.94) | — |
| Serum creatinine at first AKI diagnosis, mean ± SD | 2.52 ± 1.19 | 1.85 ± 0.94 | 0.015 |
| Serum creatinine at first AKI diagnosis, median (IQR) | 2.28 (1.51, 2.92) | 1.79 (1.09, 2.64) | — |
| Serum creatinine at 48 h after AKI diagnosis, mean ± SD | 2.10 ± 0.98 | 1.51 ± 0.73 | 0.002 |
| Serum creatinine at 48 h after AKI diagnosis, median (IQR) | 1.79 (1.21, 2.92) | 1.44 (0.81, 2.08) | — |
| Positive changes of serum creatinine (n) (%) | 21 (50.0) | 17 (40.5) | — |
| ΔSerum creatinine, mean ± SD | 0.90 ± 1.12 | 0.55 ± 0.61 | 0.256 |
| Negative or static change of serum creatinine (n) (%) | 21 (50.0) | 25 (59.5) | — |
| ΔSerum creatinine, mean ± SD | −0.54 ± 0.46 | −0.44 ± 0.58 | 0.526 |
- Note: Bold indicates a p-value less than 0.05.
- Abbreviations: AKI, acute kidney injury; ICU, intensive care unit; IQR, interquartile range; SD, standard deviation.
Table 4 illustrates that, in comparison to the low-risk group, the high-risk group exhibited a greater proportion of patients with AKI, varying severity of AKI, new instances of AKI, persistent AKI, and progression of AKI, alongside a higher incidence of patients requiring continuous renal replacement therapy (CRRT), vasopressors, mechanical ventilation, acute respiratory failure, acute hepatic failure, sepsis, in-hospital mortality, and mortality in the intensive care unit (ICU). Moreover, the high-risk group exhibited an extended duration between ICU admission and AKI, as well as prolonged ICU and hospital stays in the training set (p < 0.05, Table 4). The internal and external validation sets yielded comparable results (p < 0.05, Supporting Information Table S2).
| Outcomes | Low-risk group | High-risk group | Effect size | p Value |
|---|---|---|---|---|
| N | 575 | 485 | — | — |
| Primary outcome | — | — | — | — |
| AKI | 87 (15.1) | 292 (60.2) | 1.051 | <0.001 |
| Secondary outcomes | — | — | — | — |
| AKI severitya | — | — | 1.053 | <0.001 |
| Stage I | 53 (60.9) | 162 (55.5) | — | — |
| Stage II | 21 (24.1) | 71 (24.3) | — | — |
| Stage III | 13 (14.9) | 59 (20.2) | — | — |
| Days between ICU admission and AKIa | 0.98 ± 0.47 | 1.02 ± 0.45 | 0.688 | <0.001 |
| New AKIb | 48 (9.8) | 30 (15.5) | 1.062 | <0.001 |
| Persistent AKIa | 55 (63.2) | 240 (82.2) | 1.076 | <0.001 |
| AKI progressiona | 26 (29.9) | 128 (43.8) | 1.061 | <0.001 |
| Usage of CRRT | 11 (1.9) | 32 (6.6) | 0.234 | <0.001 |
| Usage of vasopressor | 162 (28.2) | 213 (43.9) | 0.332 | <0.001 |
| Usage of mechanical ventilation | 190 (33.0) | 195 (40.2) | 0.149 | 0.019 |
| Usage of diuretic | 209 (53.7) | 278 (57.3) | 0.269 | 0.072 |
| Acute heart failure | 41 (7.1) | 31 (6.4) | 0.029 | 0.724 |
| Acute respiratory failure | 75 (13.0) | 90 (18.6) | 0.152 | 0.017 |
| Acute hepatic failure | 31 (5.4) | 45 (9.3) | 0.150 | 0.020 |
| Sepsis | 307 (53.4) | 324 (66.8) | 0.277 | <0.001 |
| Length of ICU stay | 1.92 (1.08, 3.72) | 2.55 (1.51, 4.44) | 0.113 | 0.068 |
| Length of hospital stay | 8.40 (5.60, 14.60) | 10.00 (6.10, 16.80) | 0.134 | 0.029 |
| In-hospital mortality | 128 (22.3) | 189 (39.0) | 0.403 | <0.001 |
| ICU mortality | 72 (12.5) | 138 (28.5) | 0.369 | <0.001 |
- Note: Bold indicates a p-value less than 0.05.
- Abbreviations: AKI, acute kidney injury; CRRT, continues renal replacement therapy; ICU, intensive care unit.
- aExcluded patients without the incidence of AKI.
- bExcluded patients with the incidence of AKI.
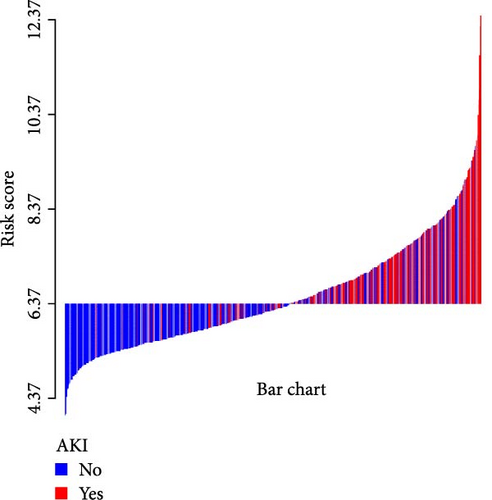
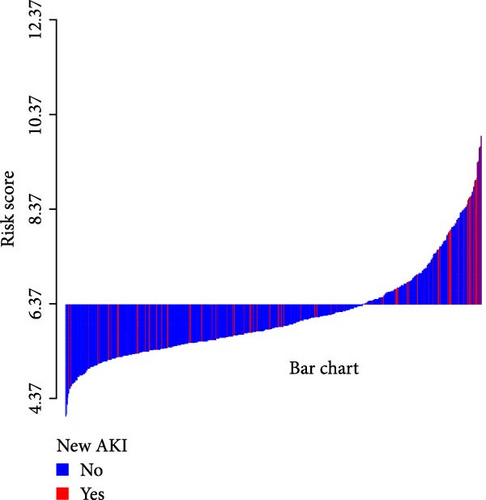
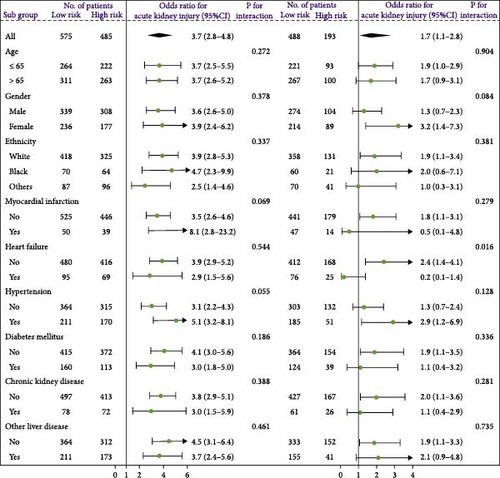
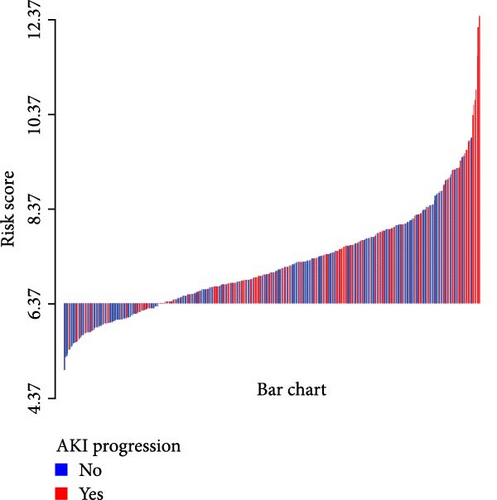
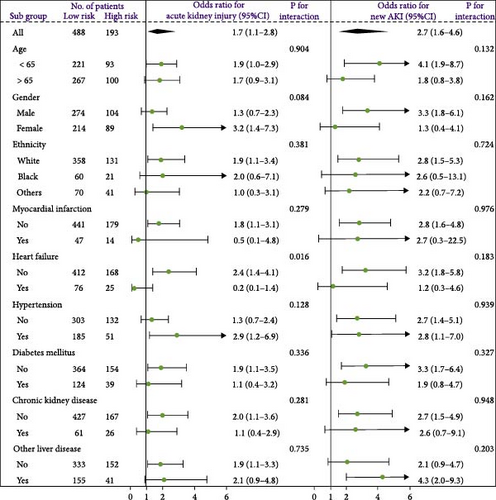
A waterfall plot was employed to assess the relationship between the risk score and the clinical outcome. A higher risk score correlates with an increased incidence of AKI, the emergence of new AKI cases, development of AKI, and a greater prevalence of persistent AKI, as demonstrated in Figures 3 and 4. Moreover, in nearly all subgroups within the training set of the predetermined subgroup analysis, patients classified as high risk exhibited a greater likelihood of AKI, new-onset AKI, progression of AKI, and persistent AKI compared to those in the low-risk category (Figures 3C, and 4C). The internal validation set yielded comparable results (Supporting Information Figure S1). The high-risk cohort of critically sick HCC patients had an elevated risk of AKI, new-onset AKI, persistent AKI, and progression of AKI. The crude odds ratios (ORs) for AKI, new AKI, persistent AKI, and AKI progression were 3.68 (95% CI, 2.82–4.79, p < 0.001, Table 5), 1.69 (95% CI, 1.03–2.76, p = 0.037, Table 5), and 2.69 (95% CI, 1.58–4.56, p < 0.001, Table 5), respectively. Moreover, in alignment with the results from the training set, patients classified in the high-risk group exhibited an elevated risk of AKI, new AKI, persistent AKI, and AKI progression in both the internal and external validation sets, despite adjustments for multiple variables (Supporting Information Table S3). The results demonstrated that our innovative WBC-related indicators risk model shown effective performance in predicting AKI.

| Methods | OR (95%CI) | p Value |
|---|---|---|
| For AKI | — | — |
| Unadjusted | 3.68 (2.82–4.79) | <0.001 |
| Adjusted for model I | 3.97 (2.01–5.24) | <0.001 |
| Adjusted for model II | 4.03 (2.89–5.63) | <0.001 |
| Adjusted for model III | 3.60 (2.52–5.14) | <0.001 |
| For new AKIa | — | — |
| Unadjusted | 1.69 (1.03–2.76) | 0.037 |
| Adjusted for model I | 1.78 (1.08–2.94) | 0.024 |
| Adjusted for model II | 1.88 (1.06–3.33) | 0.032 |
| Adjusted for model III | 2.15 (1.05–4.42) | 0.037 |
| For persistent AKIb | — | — |
| Unadjusted | 2.69 (1.58–4.56) | <0.001 |
| Adjusted for model I | 2.79 (1.63–4.78) | <0.001 |
| Adjusted for model II | 3.13 (1.82–6.04) | <0.001 |
| Adjusted for model III | 3.74 (1.87–7.49) | <0.001 |
| For AKI progressionb | — | — |
| Unadjusted | 1.83 (1.10–3.06) | 0.021 |
| Adjusted for model I | 2.21 (1.23–4.97) | 0.008 |
| Adjusted for model II | 2.20 (1.16–4.14) | 0.015 |
| Adjusted for model III | 2.15 (1.05–4.42) | 0.037 |
- Note: Model I adjusted for age, gender, weight, and ethnicity. Model II adjusted for model I plus comorbidities and Charlson comorbidity index, score system, interventions, and drug usage. Model III adjusted for model II plus vital signs and laboratory results except for white blood count. Bold indicates a p-value less than 0.05.
- Abbreviations: AKI, acute kidney injury; OR, odds ratio; 95%CI, 95% confidence index.
- aExcluded patients with the incidence of AKI.
- bExcluded patients without the incidence of AKI.
3.4. The Novel Model’s Performance in ICU Mortality and In-Hospital Mortality Prediction
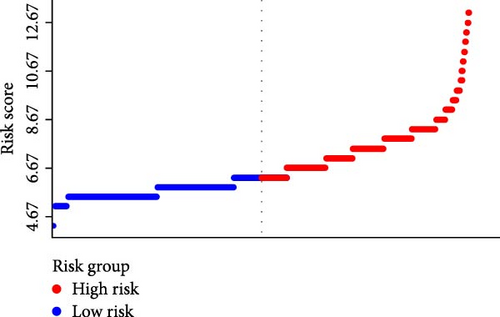
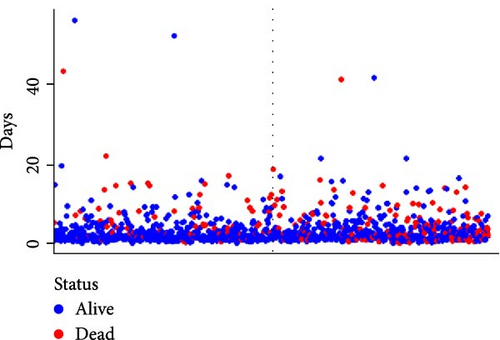
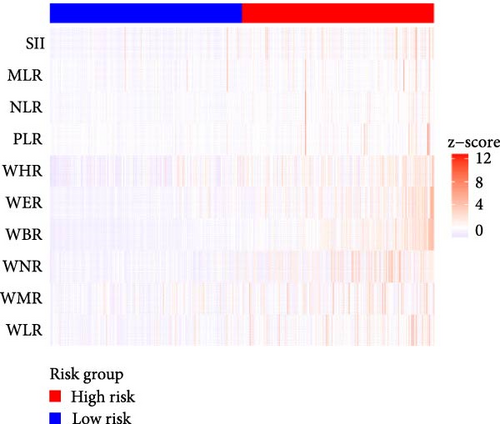
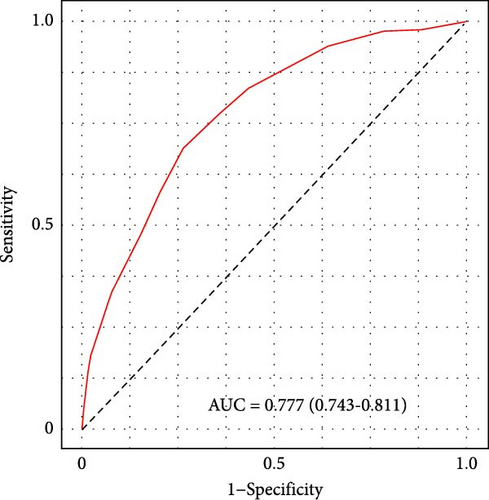
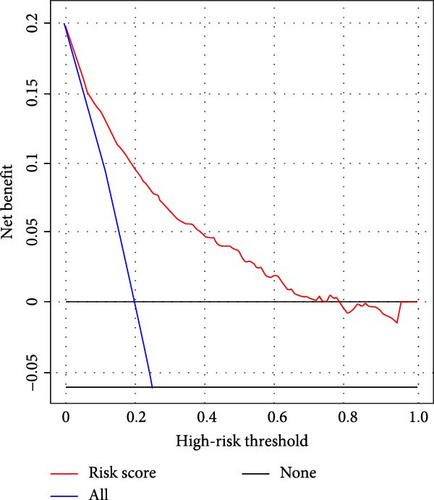
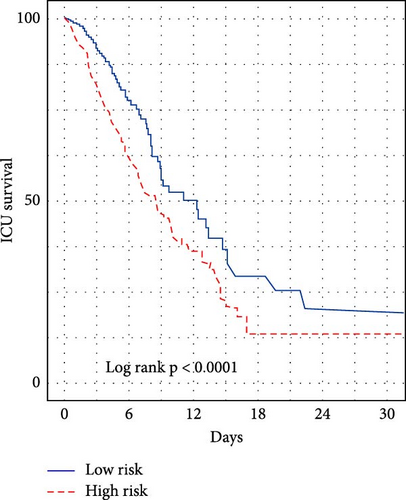
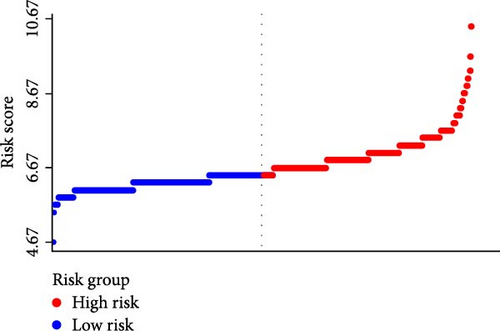
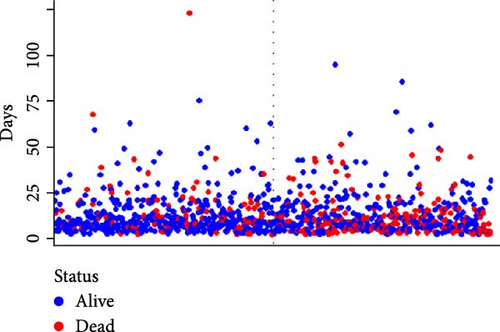
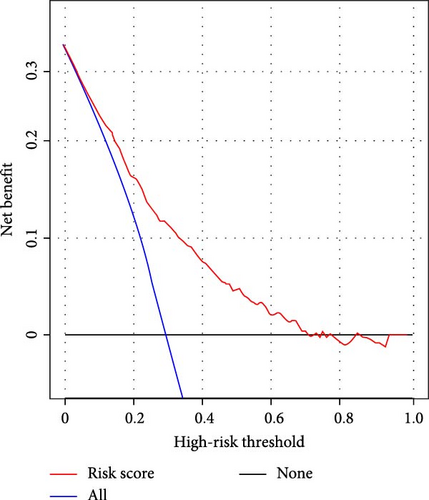
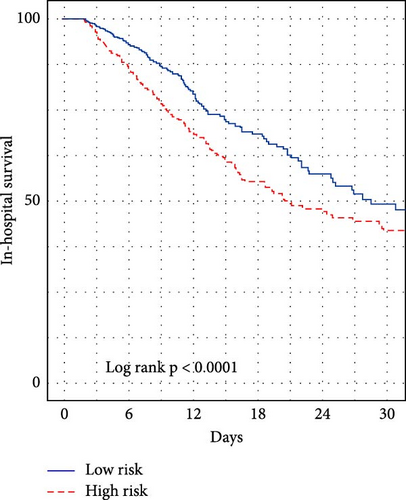
We subsequently evaluated the efficacy of the unique WBC-related indicators-based risk model in predicting ICU mortality and in-hospital mortality in critically ill HCC patients, excluding AKI prediction. A crude OR of 1.88 (95% CI, 1.41–2.51, p < 0.001) for ICU mortality and 1.52 (95% CI, 1.21–1.90, p < 0.001) for in-hospital mortality was seen in the high-risk group, with the connection persisting robustly after adjusting for multiple risk factors in the training set (Table 6). The findings from both the internal and external validation cohorts corroborated the claims of the training set (Supporting Information Table S4). Additionally, ROC analysis was conducted to evaluate the predictive efficacy of the risk score in comparison to the SOFA score, OASIS score, APSIII score, SAPSII score, and Charlson index regarding ICU mortality and in-hospital mortality. The findings demonstrated that the innovative risk score displayed superior predictive capability for in-hospital mortality relative to the SOFA score, OASIS score, APSIII score, SAPSII score, and Charlson index (Supporting Information Figure S2). Figures 5A–C and 6A–C demonstrate that the likelihood of ICU death and in-hospital mortality escalates with higher risk scores. Figures 5D and 6D indicate that the area under the curve (AUC) for the risk score predicting ICU mortality was 0.777 (95% CI, 0.743–0.811) and 0.721 (95% CI, 0.688–0.754), respectively. The risk model demonstrated clinical utility in forecasting ICU and in-hospital mortality, as indicated by DCA (Figures 5E, 6E). Furthermore, in nearly all subgroups within both the internal and external validation sets, the pre-defined subgroup analysis indicated that high-risk patients exhibited a greater likelihood of ICU death and in-hospital mortality compared to their low-risk counterparts (Supporting Information Figure S3). Furthermore, Kaplan–Meier curve analysis indicated that the prognosis for the high-risk group was inferior to that of the low-risk group (Figures 5F and 6F). Patients from both the internal and external validation sets exhibited comparable outcomes (Supporting Information Figure S4 and S5), thereby corroborating the predictive efficacy of the novel risk model for ICU and in-hospital mortality.

| Methods | HR (95% CI) | p Value |
|---|---|---|
| For ICU mortality | — | — |
| Unadjusted | 1.88 (1.41–2.51) | <0.001 |
| Adjusted for model I | 1.91 (1.43–2.55) | <0.001 |
| Adjusted for model II | 1.86 (1.24–2.32) | 0.012 |
| Adjusted for model III | 1.75 (1.29–2.39) | 0.034 |
| For in-hospital mortality | — | — |
| Unadjusted | 1.52 (1.21–1.90) | <0.001 |
| Adjusted for model I | 1.87 (1.51–2.89) | <0.001 |
| Adjusted for model II | 2.19 (1.33–2.52) | 0.011 |
| Adjusted for model III | 2.02 (1.18–4.33) | 0.037 |
- Note: Model I adjusted for age, gender, weight, and ethnicity. Model II adjusted for model I plus comorbidities and Charlson comorbidity index, HAS-BLED score, score system, interventions, and drug usage. Model III adjusted for model II plus vital signs and laboratory results except for white blood count. Bold indicates a p-value less than 0.05.
- Abbreviations: AKI, acute kidney injury; HR, hazard ratio; 95%CI, 95% confidence index.
4. Discussion
The AKI-prediction model utilizing leukocyte-related factors has not been thoroughly investigated in critically sick HCC contexts. This study focused on leukocyte-related factors and created an innovative risk model including indicators such as WNR, WMR, WHR, and PLR. We evaluated the predictive accuracy of a novel risk model for AKI in patients with HCC admitted to the ICU, comparing it to established risk scoring models (SOFA, OASIS, APS III, SAPS II, and Charlson index). The results indicated that the novel risk model effectively predicted AKI. Moreover, individuals classified in the high-risk group had an elevated likelihood of AKI, new-onset AKI, persistent AKI, and progression of AKI compared to those in the low-risk group. We additionally evaluated the risk model’s ability to predict both ICU and in-hospital mortality. The results indicated that our risk model demonstrated a robust history in forecasting AKI, as well as ICU and inpatient mortality. Our leukocyte-related indicators model was employed to develop a risk estimator that assesses the probability of AKI in high-risk patients with critically ill HCC.
A common side effect of HCC patients is AKI. After liver transplantation, 19.26% of HCC patients had AKI, according to Chen’s research [20]. 11.0% of HCC patients having transarterial chemoembolization, according to Sohn et al., [21] suffered AKI. Following hepatectomy for HCC, 15% of patients experienced AKI, according to Lim et al. [8]. In this study, AKI occurred in 23.2% of patients at our institution, 35.8% of patients from the MIMIC-IV database, and 17.9% of patients from the eICU-CRD database. Due to the presence of HCC patients in ICU settings, the incidence of AKI was higher than previously documented. It is unclear what potential mechanisms may be at play when critically ill HCC patients cause AKI. AKI brought on by HCC may be explained by hepatorenal syndrome (HRS). Patients’ reversible AKI is described by HRS. The sympathetic nervous system (SNS) and the renin–angiotensin-aldosterone system (RAAS) are overactive as a result of severe HCC, which also causes vasoconstriction, structural damage to the kidney, intravascular hypovolemia, necrosis, and apoptosis of tubular cells, which ultimately results in a complete decline in the GFR [22, 23].
Additionally, it was discovered that in patients with HCC, AKI, and AKI progression, the inflammatory response was a significant predictor of disease progression and prognosis [24, 25]. Systemic immune-inflammation index (SII), an inflammatory biomarker, was found to be a reliable predictor of postoperative AKI in HCC patients in a prior study [11]. However, prior research with relation to critically ill HCC-associated AKI had a limited understanding of the prognostic capacity of WBCs as an overall notion of inflammatory markers. The goal of the current investigation was to identify possible WBC-related indicators and then incorporate these factors into a risk model to forecast AKI associated with critically sick HCC. A WBC-related indicators-based risk model for prognosis prediction has been published in earlier investigations. Preoperative WHR, WMR, and PLR have already been linked to bladder cancer prognosis by Gao et al. [26] A risk model based on WHR, WMR, and PLR has also demonstrated high prognosis predictive ability. Another study looked into using WBC-related indicators to predict AKI in critically ill ischemic stroke patients. The findings showed that the risk model built using WLR, WBR, WHR, and neutrophil to lymphocyte ratio (NLR) performed well at predicting AKI in these patients. The current study discovered that WNR, WMR, WHR, and PLR were independent predictors for AKI prediction, and WNR, WMR, WHR, and PLR were merged to create a novel risk model. This finding is consistent with other reports [27]. In addition, except for predicting AKI, the novel WBC-related indicators risk model also exhibited good mortality predictive performance.
As is well known, systemic inflammation plays a crucial role in the occurrence and metastasis of cancer. Research over the past decade has confirmed that systemic inflammatory markers can predict the prognosis and postoperative recurrence of various tumors, including HCC. Various inflammatory cells, such as neutrophils, platelets, and monocytes, have also been shown to be associated with the prognosis of HCC [28, 29]. Several studies have verified that NLR, PLR, and lymphocyte to monocyte ratio (LMR) are predictive factors for HCC prognosis prediction [30]. Moreover, inflammation is associated with AKI. And leukocyte-related biomarkers were reported to predict AKI in different disease conditions [31, 32]. Hence, the potential mechanism by which inflammatory response may lead to AKI in HCC, and the use of leukocyte-related indicators risk model to predict AKI in HCC is reasonable, but further research is needed to confirm this result in the future.
This study presented multiple limitations. The retrospective nature of the study led to insufficient clinical data, which hindered the inclusion of numerous patients and introduced potential selection bias. Second, we could not obtain specific essential information concerning the type and treatment of the HCC. Third, the use of diuretics can lead to inaccuracies in urine volume data; therefore, the urine standard was not utilized in the diagnosis of AKI. The overall incidence rate of AKI may decrease as a consequence. We evaluated the changes in WBC-related variables solely after ICU admission, excluding the hospital stay period. Static measurement of WBC-related variables may fail to accurately reflect the inflammatory and immunological status of patients without dynamic monitoring. Given the absence of high-quality prognosis prediction tools for critically ill HCC patients, our innovative risk model may aid clinicians in developing accurate risk assessments and treatment strategies. While the models developed through logistic regression and Cox regression are adequate, it is advisable to explore alternative modeling techniques, such as support vector machines (SVM) or XGBoost, to enhance predictive performance.
5. Conclusions
A novel prognostic predictive risk model was developed in this study, utilizing WBC-related indicators, including WNR, WMR, WHR, and PLR. The risk model demonstrated effective performance in predicting acute kidney injury and mortality. We assert that additional research, particularly large prospective studies, should corroborate our findings.
Ethics Statement
As this study was an analysis of the public databases, approval of the Institutional Review Board (IRB) was completely exempted. And the ethical approval statement and the need for informed consent were waived for this manuscript.
Consent
All authors consent for publication.
Conflicts of Interest
The authors declare no conflicts of interest.
Author Contributions
Study conception and design: Xiulan Peng and Yahong Cai; acquisition of the data: Yahong Cai and Huan Huang; analysis and interpretation of the data: Yahong Cai, Haifeng Fu, Wei Wu, and Lifeng Hong. All authors were involved in drafting the manuscript. All the authors approved the final version for publication. Xiulan Peng, Yahong Cai, Huan Huang, and Haifeng Fu are contributed equally and are Co-first authors.
Funding
This study was supported by the Natural Science Foundation of Hubei Province (2022CFB376).
Acknowledgments
None AI software have been used to prepare the manuscript.
Supporting Information
Additional supporting information can be found online in the Supporting Information section.
Open Research
Data Availability Statement
The datasets used are available from the corresponding author on reasonable request.


