Potentials of Chitin Nanofiber for Postharvest Quality of Banana
Abstract
Bananas are perishable fruit with a limited shelf life. Postharvest treatments can help reduce the loss experienced after harvesting. This study investigated the effect of different concentrations of chitin nanofiber (CNF) on the postharvest quality and shelf life of bananas. The green mature banana fruits were coated with three concentrations of CNF (0.1%, 0.3%, and 0.5%), while the untreated fruits were served as control. Following treatments, fruits were stored in ambient conditions at 29 ± 2°C and 85 ± 5% relative humidity (RH). To identify the effectiveness of CNF, weight loss, firmness, color, total soluble solids (TSS), titratable acidity (TA), vitamin C, disease incidence, and disease severity were measured. Though CNF 0.1% coating reduced disease severity and retained vitamin C of banana, CNF 0.3% significantly decreased weight loss and disease incidence and increased firmness of fruit compared to the control. CNF 0.3% also resulted in the lowest TA and delayed fruit ripening. Moreover, the shelf life of bananas was extended by 2.34 days with the application of CNF 0.3%. Therefore, the application CNF 0.3% is recommended for preserving postharvest qualities.
1. Introduction
Bananas (Musa sapientum L.), also known as a crop for sweet desserts, are one of the most valuable fruits in the world [1]. Annually, 150 million tons of bananas are produced globally in the tropics and subtropics, positioning their production between those of tomatoes (174 million tons) and apples (83 million tons) [2]. Bananas are highly nutritive and provide high energy (89 Kcal 100 g−1) [3]. Bangladesh ranked 23rd in global banana production in 2020, with a total output of 0.082 M tons from approximately 0.05 million hectares in 2018–2019 [2]. It is consumed more often than any other fruit as it is the only fruit available all year round [4]. Additionally, it contains phosphorus, iron, carotene, riboflavin, niacin, ascorbic acid, crude fiber, protein, fat, ash, and carbs [5].
Worldwide consumption of bananas is increasing because of high nutrient content. However, bananas are climacteric, ripen rapidly after harvest, and perish quickly [6, 7]. Faulty postharvest management, high temperature, and relative humidity augment the loss [8]. Bangladesh experienced an annual postharvest loss of bananas at 24.62% [9], while developed nations had a loss rate ranging from 5% to 25% [10].
Generally, the ethylene production pattern in bananas is different from other climacteric fruits. At the beginning of the climacteric period, bananas exhibit a sharp increase in ethylene production [11, 12], and the ripening fruits also automatically trigger more ethylene production [13]. Uneven ripening causes significant weight loss and poor color development [14]. These physiological characteristics may enhance deterioration along with a reduction of the storage life of bananas. However, the storage life of bananas can be prolonged if ripening is not initiated by ethylene exposure [15]. A number of strategies have been proposed to preserve postharvest quality and extend shelf life of bananas, such as edible coatings [4], chemical treatments [16, 17], salicylic acid [18], controlled atmosphere (CA) storage [19], modified atmosphere (MA) packaging [20], and low-temperature storage [21]. However, many treatments have disadvantages such as CA and MA storages being expensive [22, 23], chemicals being hazardous to the environment and human health [15], and low temperatures not being able to prevent water loss or the reduction in organic acid concentrations with prolonged storage [24]. Therefore, attempts should be made to develop safe and ecofriendly technology to reduce postharvest spoilage of bananas. Recently, chitin nanofiber (CNF) has been applied to fresh fruits as a natural edible coating to preserve quality and extend shelf life at postharvest. CNF is the nanofibrilation of chitin with diameters less than 100 nm and an aspect ratio of fibers more than 100 [25, 26]. It has effective mechanical [27] and biomedical properties [24]. While chitin is insoluble, the water-soluble CNF is a commonly accepted substitute in agricultural applications [28, 29]. Although studies have assessed the effects of chitosan, a chitin derivative, on the quality of mango, banana, dragon fruit, strawberry, and tomato at postharvest [30, 31], there is no research regarding the use of CNF for the postharvest quality of bananas. Therefore, the purpose of this research is to evaluate the effectiveness of CNF coating on bananas’ postharvest quality and storage life.
2. Materials and Methods
2.1. Experimental Site and Materials
Experiments were carried out using bananas Musa sapientum L. cv. Jin at Horticulture Laboratory, Agrotechnology Discipline, Khulna University, Khulna, in May 2023. Banana “Jin” is a popular cultivar in Khulna region, and it was collected from a commercial orchard near Khulna University. Bunches of this variety are pendent; each contains 6–8 hands with 12–16 curved fingers, having a short pedicel, prominent nipple, and medium thick pericarp with fine texture and aroma [32]. Disease-free, physiologically mature, and uniform bananas were selected. They were collected early in the morning and transported to the Khulna University’s Horticulture Laboratory in an air-cooled vehicle. A digital temperature–humidity recorder (Thermo, Germany) was used to record the storage room’s temperature and relative humidity. The experiment was conducted in ambient conditions, and the temperature of the storage room ranged from 28.5°C to 30.9°C with an average of 29.97°C. The relative humidity during storage ranged from 80% to 89%, with a mean of 84.85% (Appendix I).
2.2. Experimental Design, Preparation, and Application of Treatments
The single-factor experiment was conducted in a completely randomized design (CRD) along with four concentrations of CNF (0%, 0.1%, 0.3%, and 0.5%) and three replications, 10 fruits per replication. Thus, 120 fruits were used in the experiments. CNF was extracted from the shells of black tiger shrimp (Peneus monodon). The shells were converted into smaller particles using a laboratory-scale grinder (Bangladesh). Particles were sieved by passing through 10–35 meshes, and 0.5–2 mm particles were collected. The crushed shells were treated with 7% HCl for 24 h at room temperature, and the step was repeated to remove the minerals completely [27, 33]. The demineralized shells were dipped in 4% NaOH solution in a beaker and heated at 80°C for 6 h, and the procedure was repeated to remove the proteins. The suspension was depigmented by 50% ethanol [27, 33]. The purified wet chitin was dispersed in water to 1% (wt.) slurry and subjected to a high-speed blender (Vita-Mix Blender, Entrex, Ltd., Tokyo, Japan) at 37,000 rpm for 10 min. Lastly, the aqueous suspension was passed through a grinder (MKCA6-5 J, Masuko Sangyo, Saitama-ken, Japan) at 1500 rpm for 10 cycles. The grinding treatment was performed with a clearance gauge of −2.5 (corresponding to a 0.25-mm shift) from a zero position. The dispersion was collected and stored in a refrigerator at 10°C. The suspension of CNFs was subjected to oven drying at 105°C for 12 h after replacement from water to ethanol, and the obtained sheets were coated with an approximately 2 nm layer of platinum by an ion sputter coater (JFC-1600, JEOL Ltd.) and observed with a field emission scanning electron microscope (FESEM) (JSM-6700F, JEOL Ltd., Tokyo, Japan). The required concentrations (0.1%, 0.3%, and 0.5%) of CNF were prepared by adding more distilled water. Each set of bananas was placed on newspaper separately, and solutions were sprayed on the fruits to coat them uniformly through a hand sprayer except for control. On each date (days after treatment, DAT, such as 3, 5, and 7) of chemical measurements, 12 fruits were sampled from four treatments (i.e., three fruits per treatment).
2.3. Determination of Physical and Chemical Properties
The physical attributes, such as fruit firmness, color, and weight loss, were measured every day, and the chemical attributes, such as total soluble solids (TSS), titratable acidity (TA), and vitamin C, were measured on DATs 3, 5, and 7. One fruit was chemically analyzed from every replication for each DAT. Thus, three bananas (out of 10) were spent on the chemical measurements.
2.3.1. Firmness
The firmness of bananas was assessed according to Hassan [34] following the rating scale of 1–6, where 1 represents mature hard, 2 is sprung, 3 is between sprung and eating ripe, 4 is eating ripe, 5 represents overripened, and 6 means totally unfit for consumption.
2.3.2. Fruit Color
The skin color of the banana was measured using color coordinates L∗, a∗, b∗, chroma (C∗), and hue angle (h°) from each fruit’s opposite side in the Chroma Meter CR-410. Chromaticity L∗ indicates the lightness of the fruit color ranging from 0 (black) to 100 (white). Chromaticity a∗ represents the redness (+a∗) or greenness (−a∗), and chromaticity b∗ indicates the yellow (+b∗) or blue (−b∗) color of fruit skin. Chroma (C∗) was defined as the intensity of color saturation from dull to vivid color (low-to-high values, respectively). For color interpretation, red was at an angle of 0° or 360°, yellow at 90°, green at 180°, and blue at 270°. The values of the hue angle (h°) denotes absorbance or reflection, relate to intrinsic brightness.
2.3.3. Weight Loss (Percent)
2.3.4. TSS
A hand refractometer (SONOX 105) was used to measure the TSS (°Brix) by placing a drop of juice on its prism using the AOAC [35] method, where 10 g of blended banana pulp was diluted with 50 ml of distilled water and filtered with a Whatman filter paper to obtain the juice. The reading of TSS was obtained as °Brix from the direct reading of the refractometer.
2.3.5. TA
2.3.6. TSS:TA Ratio
TSS was divided by the corresponding TA to get the TSS/TA values.
2.3.7. Vitamin C
2.4. Assessment of Disease Incidence (Percent) and Disease Severity (Percent)
Disease severity indicates the proportion of the diseased part of infected fruit and was calculated based on eye estimation. Disease severity was scored as per the method described by Sivakumar et al. [39] using the following scale: 1 = 0% of fruit surface rotten; 2 = 1%–25% of fruit surface rotten; 3 = 26%–50% of fruit surface rotten; 4 = 51%–75% of fruit surface rotten; 5 = 76%–100% of fruit surface rotten.
2.5. Shelf Life (Days)
The shelf life of bananas was assessed by determining the number of days required for them to reach full ripeness while maintaining optimal edibility and marketability. Therefore, it was determined based on physical parameters such as weight loss (less than 10%) and disease severity (less than 12%). From the consumer perspective, these parameters were evaluated visually to determine their marketability, and the shelf life was calculated at the final stage of consumer acceptance.
2.6. Statistical Analyses
A one-way analysis of variance (ANOVA) for a single factor CRD was performed on the data using IBM SPSS Statistics for Windows (Version 27.0.1.0) (IBM Corp. (2020), Armonk, New York, United States). At a 5% level of significance, Tukey’s honestly significance difference (HSD) test was used to compare treatment means using the same software.
3. Results
3.1. Physical and Chemical Attributes of Fruit
3.1.1. Weight Loss
The weight loss (percent) of bananas increased gradually over time and was statistically significant at most DATs (Table 1). As a postharvest treatment, CNF 0.3% coating significantly reduced (p < 0.05) weight loss (%) of bananas than other CNF treatments during the storage period (on DATs 1, 4, 5, and 6). On DAT 1, the weight loss of untreated banana fruits was maximum (2.53%), while the lowest loss was observed in CNF 0.3% treated fruits (1.71%). Similarly, higher weight loss was recorded in control fruits (17.48%, 24.03%, and 32.30%), and bananas coated with CNF 0.3% showed the lowest weight loss (11.06%, 14.48%, and 18.74%) at DATs 4, 5 and 6, respectively. However, CNF treatments had no significant differences between treated and untreated fruits on DAT 2 and DAT 3.
| Treatments | Weight loss (%) | |||||
|---|---|---|---|---|---|---|
| DAT 1 | DAT 2 | DAT 3 | DAT 4 | DAT 5 | DAT 6 | |
| Control | 2.5296ab | 5.8728a | 11.420a | 17.479a | 24.029a | 32.299a |
| CNF 0.1% | 1.9326bc | 6.1854a | 11.216a | 16.252a | 21.811a | 28.131ab |
| CNF 0.3% | 1.7100c | 5.2210a | 8.590a | 11.057b | 14.480b | 18.737c |
| CNF 0.5% | 2.6475a | 7.8118a | 12.312a | 17.773a | 21.170a | 25.087b |
| p | 0.0284 | 0.0796 | 0.0836 | 0.0371 | 0.0159 | 0.0011 |
- Note: The data represent mean of at least three measurements. The mean values were separated by Tukey’s HSD test at 5% level of probability. The mean is not statistically different among the treatments if a column has similar letter(s).
3.1.2. Fruit Firmness
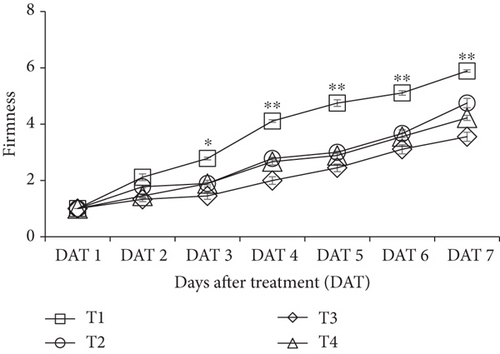
Significant variation (p < 0.05) in fruit firmness was observed between treated and untreated fruits starting at DAT 3 and later storage period. Control fruit (no treatment) lost fruit firmness rapidly compared to the CNF-treated fruits (Figure 1). The slower changes in fruit firmness were recorded for the treatment CNF 0.3% (1.45, 2, 2.45, 3.11, and 3.55), the rapid loss was observed in control (2.78, 4.11, 4.75, 5.11, and 5.89) from DAT 3 to DAT 7, respectively, which indicates the ripening rate of control fruits was faster than CNF 0.3% coated bananas.
3.1.3. Changes in Fruit Skin Color
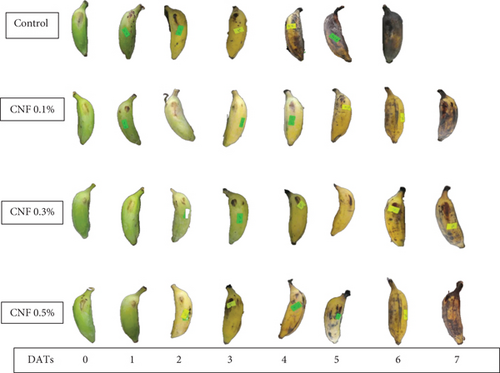
CNF treatments influenced chromaticity color coordinates (Figure 2), for example, lightness (L∗) in bananas, and this color attribute was gradually increased in all CNF-treated fruits from DAT 1 to DAT 5 except for control (Table 2). Increased L∗ value represents the lightness of the yellow color during storage and ripening. The highest value of L∗ was calculated as 60.2 in CNF 0.3% coated banana on DAT 5. However, at DATs 6 and 7, a sudden decrease was observed in L∗. On DAT 7, CNF-treated bananas had statistically similar (p < 0.05) L∗ values, which were 50.8, 53.8, and 50.3 for CNF 0.1%, CNF 0.3%, and CNF 0.5%, respectively, while control fruits exhibited the lowest value (35.3). The a∗ of the banana increased from negative to positive when the storage period increased (Table 2), an indication of greenness reduction. The color attributes a∗ was significant only at DAT 7; the highest a∗ was measured from CNF 0.1% (4.9), and the lowest from the control (2). A gradual increase of b∗ value was observed till DAT 4 during storage (Table 2). However, the value of b∗ started declining significantly at DATs 5, 6, and 7, which indicates the onset of senescence and darkness of the banana peel. The highest retention of b∗ (23.6) was recorded on CNF 0.5% coated banana, whereas the lowest value was observed in the control (15.4) on DAT 7. The C∗ value increased progressively in all CNF-coated fruits from DAT 1 to DAT 4 (Table 2) and began to decline till DAT 7, which means changes in the peel color of the banana from green to yellow. It was statistically significant on DATs 5, 6, and 7 (p < 0.05). On the final day of storage (DAT 7), the CNF 0.5% treated bananas had the maximum C∗ value (23.6), while the lowest (13.1) was recorded for control (Table 2). The hue (h°) angle is the indication of ripening. From DAT 1 to DAT 7, the hue (h°) angle reduced gradually. However, it was significant on DATs 5 and 6 (Table 2).
| Treatments | DAT 1 | DAT 2 | DAT 3 | DAT 4 | DAT 5 | DAT 6 | DAT 7 |
|---|---|---|---|---|---|---|---|
| L∗ | |||||||
| Control | 56.6a | 52.8a | 58.0a | 54.4a | 46.0b | 42.3b | 35.3b |
| CNF 0.1% | 47.1c | 53.1a | 56.8a | 59.3a | 55.1a | 48.7ab | 50.8a |
| CNF 0.3% | 51.1b | 53.6a | 55.7a | 56.9a | 60.2a | 49.7a | 53.8a |
| CNF 0.5% | 47.7bc | 49.7a | 52.6a | 59.3a | 56.0a | 55.2a | 50.3a |
| p | 0.0018 | 0.8977 | 0.5841 | 0.4446 | 0.0018 | 0.0233 | 0.0058 |
| a∗ | |||||||
| Control | −6.4a | −4.5a | 0.9a | 2.9a | 3.5a | 3.2a | 2.0c |
| CNF 0.1% | −10.5a | −5.1a | 0.2a | 1.9a | 3.4a | 3.6a | 4.9a |
| CNF 0.3% | −8.6a | −7.4a | −3.3a | −1.8a | −0.3a | 2.1a | 3.3bc |
| CNF 0.5% | −8.1a | −5.2a | −3.7a | 0.4a | 2.4a | 2.7a | 3.6ab |
| p | 0.26 | 0.74 | 0.32 | 0.36 | 0.12 | 0.25 | 0.012 |
| b∗ | |||||||
| Control | 19.8a | 26.2a | 36.4a | 32.2a | 19.8b | 17.1b | 15.4b |
| CNF 0.1% | 20.1a | 27.5a | 33.7a | 37.6a | 19.8a | 17.5b | 15.7b |
| CNF 0.3% | 19.4a | 24.1a | 28.4a | 29.6a | 25.3a | 19.4b | 18.6b |
| CNF 0.5% | 17.2a | 22.4a | 26.9a | 33.2a | 28.9a | 27.7a | 23.6a |
| p | 0.61 | 0.88 | 0.28 | 0.43 | 0.01 | 0.03 | 0.04 |
| C∗ | |||||||
| Control | 24.3a | 27.6a | 36.4a | 32.4a | 20.4b | 17.9b | 13.1c |
| CNF 0.1% | 22.6a | 28.4a | 33.7a | 38.2a | 30.0a | 17.9b | 19.3b |
| CNF 0.3% | 21.2a | 25.5a | 29.1a | 30.4a | 32.5a | 19.6b | 25.8a |
| CNF 0.5% | 19.1a | 23.1a | 27.6a | 33.3a | 29.1a | 27.8a | 23.9ab |
| p | 0.35 | 0.82 | 0.27 | 0.33 | 0.02 | 0.053 | 0.09 |
| h° | |||||||
| Control | 106.93a | 101.76a | 88.48a | 84.78a | 76.81c | 75.17b | 75.47a |
| CNF 0.1% | 117.73a | 101.78a | 89.56a | 80.22a | 82.81bc | 78.72ab | 76.99a |
| CNF 0.3% | 114.36a | 109.78a | 98.61a | 96.69a | 90.31a | 83.18a | 81.91a |
| CNF 0.5% | 115.42a | 104.43a | 100.26a | 89.28a | 84.63ab | 83.88a | 81.20a |
| p | 0.23 | 0.76 | 0.37 | 0.30 | 0.017 | 0.039 | 0.59 |
- Note: Data presented as mean of three measurements The mean values were separated by Tukey’s HSD test at 5% level of probability. The mean is not statistically different among the treatments for a particular color attribute, for example, L∗ if a column has similar letter(s).
3.1.4. TSS
A gradual increase in TSS was observed throughout the storage period. As a postharvest treatment, CNF 0.1% coating significantly retained the TSS content of bananas compared to the control and other CNF treatments (Table 3). On the third, fifth, and seventh days of storage, CNF coating showed significant differences (p < 0.05) among treated and untreated bananas. In addition, banana fruits coated with CNF 0.1% had the lowest TSS (6.50, 9.16, and 10.83°Brix), whereas the maximum value was recorded for control (13, 20.33, and 25.50°Brix) on DATs 3, 5, and 7, respectively.
| Treatments | DAT 3 | DAT 5 | DAT 7 |
|---|---|---|---|
| Total soluble solid (°Brix) | |||
| Control | 13.00a | 20.33a | 25.500a |
| CNF 0.1% | 6.50c | 9.16c | 10.833c |
| CNF 0.3% | 8.83b | 11.83bc | 14.833b |
| CNF 0.5% | 9.83b | 14.00b | 17.833b |
| p | 0.0001 | 0.0001 | ≤ 0.001 |
| Titratable acidity (%) | |||
| Control | 0.40a | 0.44a | 0.47a |
| CNF 0.1% | 0.37ab | 0.39bc | 0.41b |
| CNF 0.3% | 0.35b | 0.36c | 0.37c |
| CNF 0.5% | 0.38ab | 0.41ab | 0.42b |
| p | 0.033 | 0.002 | 0.0004 |
| TSS: TA | |||
| Control | 32.673a | 46.190a | 54.283a |
| CNF 0.1% | 17.237b | 24.740b | 25.990c |
| CNF 0.3% | 25.290a | 32.557b | 39.330b |
| CNF 0.5% | 26.343a | 34.230b | 42.523b |
| p | 0.0017 | 0.0008 | ≤ 0.001 |
- Note: The data represent mean of at least three measurements. The mean values were separated by Tukey’s HSD test at 5% level of probability. The mean is not statistically different among the treatments if a column has similar letter(s).
3.1.5. Acidity (%TA) and Sugar–Acid Ratio (TSS:TA)
With the increase in the ripening process of bananas, a gradual increase in TA was observed (Table 3) at DATs (3, 5, and 7). Fruits coated with CNF 0.3% had a significant (p < 0.05) decrease in TA throughout the storage period, while control fruits exhibited the maximum increase in TA content. In CNF 0.3% coated banana, TA was recorded as 0.35%, 0.36%, and 0.37% on the 3, 5, and DAT 7, respectively. However, in untreated bananas, a gradual increase was observed (0.40%, 0.44%, and 0.47% at DATs 3, 5, and 7, respectively). This finding suggests that applying CNF 0.3% coating could result in a relatively increased retention of TA in bananas.
The sugar–acid ratio (TSS:TA) of bananas varied significantly (p < 0.05) during storage. The TSS:TA ratio increased at all DATs, irrespective of the treatments. The highest value was obtained from control (54.283), followed by CNF 0.5% (42.523), and the lowest ratio was calculated in fruits treated with CNF 0.1% (25.99) on DAT 7 (Table 3).
3.1.6. Vitamin C
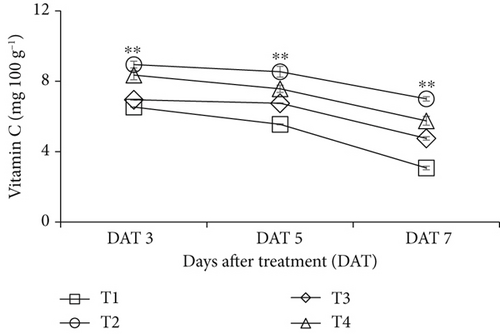
The uncoated bananas exhibited a greater reduction in vitamin C content compared to the CNF-coated bananas (Figure 3). The retention of vitamin C (mg 100 g−1) was lowest in control (6.53, 5.55, and 3.07) and highest in CNF 0.1% treated fruits (8.95, 8.54, and 7.00) on DATs 3, 5, and 7, respectively. However, due to the gradual deterioration of fruits, all treatments showed a decreasing trend in vitamin C content during storage.
3.2. Disease Incidence and Disease Severity
Most bananas showed signs of disease by Day 3, while those treated with 0.3% CNF became infected by Day 4. The disease incidence of bananas varied significantly from DAT 4 to DAT 7; the control sample showed maximum incidence of disease throughout the storage period (Figure 4). On DAT 3, only 6.7% of fruits were infected in the control sample, and a gradual increase was observed on DATs 4, 5, 6, and 7, which was 20%, 43.5%, 50.05%, and 85%, respectively. However, the application of CNF successfully reduced the disease incidence of bananas during storage. Banana fruits coated with CNF 0.3% had the lowest disease incidence (7.75%, 10.4%, 13.35%, and 16.75% at DATs 4, 5, 6, and 7, respectively) (Figure 5). In addition, on the final day of storage (DAT 7), disease incidence was also lower in CNF 0.1%-coated fruits (27.85%) and CNF 0.5%-coated fruits (22.7%).


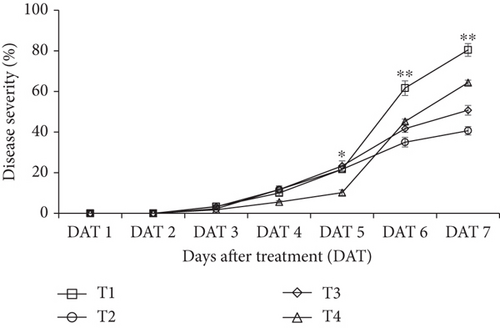
Application of CNF 0.1% coating showed a substantial (p < 0.05) impact on lowering the disease severity of bananas compared to the other CNF treatments (Figure 6). On the first and second day of storage (DAT 1 and DAT 2), the disease severity score for every sample was “1,” indicating that no fruit surface (0%) was rotten. However, the severity commenced from Day 3, although it was not statistically significant. Bananas coated with CNF 0.1% had the lowest disease severity on DATs 6 and 7—35% and 40.65%, respectively—compared to the control. At DAT 7, control fruits showed the highest disease severity (80.45%), which decreased to 50.77% and 64.35% for CNF 0.3% and CNF 0.5%, respectively.
3.3. Shelf Life
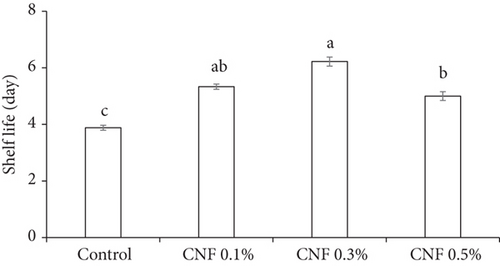
CNF significantly (p < 0.05) prolonged the shelf life of bananas (Figure 7). The highest shelf life was recorded as 6.22 days in CNF 0.3%, followed by CNF 0.1% (5.33 days), while the lowest was found in control (3.88 days). This result leads to the conclusion that CNF 0.3% coating extended the shelf life of bananas by 2.34 days.
4. Discussion
4.1. Physical and Chemical Attributes
4.1.1. Physical Attributes
CNF coating reduced the weight loss of bananas throughout the storage period, as observed by Hossain and Iqbal [4], who reported that chitosan-coated bananas showed less weight loss during the postharvest storage. Similarly, the weight loss of bananas was decreased by chitosan/CNF/nanocurcumin coating [40]. CNF coating may decrease fruit transpiration and, thus, contribute to less weight loss in the present study.
Loss of fruit firmness indicates cell wall degradation due to the changes in pectin substances [41]. Chitosan coating of banana significantly maintained the firmness compared to the control [42], and banana fruits coated with CNF 0.3% were harder than the control in the present investigation. A similar trend of change in firmness was also observed by Hasan et al. [43], when mango fruits coated with chitosan.
Slow color development may indicate a lower respiration rate along with reduced ethylene production, leading to delayed ripening and senescence [44]. CNF 0.3%-coated fruits exhibited slower color development, consistent with our findings. Banana peel color change was also delayed by chitosan coating during storage [45].
The value of lightness (L∗) increased initially and decreased significantly after a certain period. A similar result was also observed by Al-Dairi and Pathare [46] for the “Fard” banana. L∗ value increased in the first days of storage and gradually decreased when mango fruits were treated with nanochitosan [47], which is an indication of ripening and spoilage. Chlorophyll and xanthophyll degradation on the banana fruit peel caused color changes of the banana peel from green to yellow during storage [48]. The a∗ value was more negative in nanochitosan-coated fruits and increased slowly, which is an indication of a greener peel [47]. This finding agrees with our banana peel color (a∗) evaluation. A rise in the value of b∗ was observed at first, and then decreased after a certain period. The b∗ value trend observed in this study has a similarity to the findings of Adi et al. [49] regarding the ripening and storage-related changes in banana color quality. The value of C∗ increased during the initial storage period and declined slowly, as stated by Al-Dairi and Pathare [46]. Our study also reported similar trends. The hue angle (h°) of the banana gradually decreased over time, and the lowest value was obtained on the final day of storage [49], as reported in the present study.
4.1.2. Chemical Attributes
TSS content of bananas showed a substantial increase in the present study due to the breakdown of starch and polysaccharides into simple sugar in the presence of ripening enzymes [50]. Moreover, the dissolution of cell wall polysaccharides, starch deterioration, and water loss may all contribute to an increase in the TSS concentration of bananas [51]. The rise in TSS content observed in this study was comparable to the observation by Nayab and Akhtar [52] and Mubarok et al. [53].
TA of banana increased over time, but application of CNF 0.3% coating showed increased retention of TA compared to other treatments. This finding supports the study of Sikder and Islam [54].
TSS:TA ratio in bananas elevated as ripening continued, especially at higher temperatures [46]. It could result from osmotic pressure-induced water loss and the concentration of sugar in banana pulp tissue [55].
According to Suseno et al. [56], chitosan coating reduced vitamin C loss in bananas, which resonates with our findings. By modifying the internal atmosphere of the storage, CNF coating delayed the physiological and biochemical processes of bananas and restricted the loss of vitamin C [47].
4.2. Disease Incidence and Disease Severity
CNF coating effectively reduced the disease incidence of bananas during storage. Similarly, Hossain and Iqbal [4] reported decreased disease incidences in bananas if coated with chitosan. Citrus fruit treated with chitosan also exhibited a low incidence of diseases [57]. Chitosan has an inhibiting impact on fruit’s tendency to develop disease [58]. Similarly, the antifungal properties of CNF may decrease disease incidence in bananas.
Bananas treated with CNF showed lower disease severity. The result is consistent with the findings of Sikder and Islam [54]. Chitin-based film inhibits food spoilage in tomatoes by inhibiting microbial growth [59]. The application of chitosan was also reported to reduce the postharvest disease of sweet cherry [60].
4.3. Shelf Life
CNF prolongs the shelf life of bananas during storage. As a postharvest treatment, CNF 0.3% coating extended the shelf life of bananas by 2.34 days. Similar findings were also observed by Hossain and Iqbal [4] and Munira et al. [58]. A study by Jayaprakash et al. [59] found that the shelf life of tomatoes can be extended using chitin film.
5. Conclusion
The application of CNF successfully retains the shelf life of bananas. Among the treatments, CNF 0.3% coating prolonged the shelf life by 2.34 days. The CNF 0.3% also reduced weight loss and disease incidence, retained firmness, slowed color development, and increased retention of TA. Though CNF 0.1% coating retained TSS and vitamin C and decreased disease severity, the overall effect of CNF 0.3% was higher than CNF 0.1%. Therefore, CNF 0.3% can be applied to extend shelf life and maintain the quality of bananas. Nonetheless, additional studies are required to validate these findings and establish definitive recommendations for broader application.
Conflicts of Interest
The authors declare no conflicts of interest.
Author Contributions
Shirazoom Munira: methodology, investigation, analysis, writing – preliminary draft. Shamim Ahmed Kamal Uddin Khan: conceptualization, cosupervision. Md. Iftekhar Shams: CNF preparation and supply. Md. Yamin Kabir: supervision, conceptualization, analyzing, writing – draft, review and editing, fund acquisition.
Funding
No funding was received for this manuscript.
Acknowledgments
The authors express their sincere gratitude to the Lab of Horticulture as well as the Agrotechnology Discipline, Khulna University, Bangladesh, for their support during the experimental period.
Open Research
Data Availability Statement
The data that support the findings of this study are available from the corresponding author upon reasonable request.


