Resveratrol and Its Metabolites by Gut Microbiota Inhibit Human and Rat Gonadal 3β-Hydroxysteroid Dehydrogenases: In Vitro Assay, Structure–Activity Relationship, and In Silico Docking Analysis
Abstract
Introduction: Resveratrol and its analogs have potential therapeutic usage. Resveratrol is metabolized to various metabolites by gut microbiota, including dihydroresveratrol, lunularin, pinostilbene, and oxyresveratrol. However, they might have side effects by inhibiting human gonadal 3β-hydroxysteroid dehydrogenase 2 (h3β-HSD2) and rat homolog r3β-HSD1, thereby interfering with steroid biosynthesis.
Methods: Herein, we analyzed the inhibitory strength via in vitro assay, mode of action, structure–activity relationship, and docking simulation of resveratrol analogs on 3β-HSDs. Human KGN cell microsome was used as h3β-HSD2 source, and 90-day-old male Sprague–Dawley rat testicular microsome was used as r3β-HSD1 source. The conversion of pregnenolone to progesterone by 3β-HSDs was analyzed.
Results: IC50 values for h3β-HSD2 were 4,4′-dihydroxystilbene (8.87 μM) > pinostilbene (10.51 μM) > resveratrol (50.04 μM) > lunularin (96.10 μM), while those for r3β-HSD1 were pinostilbene (5.11 μM) > 4,4′-dihydroxystilbene (15.16 μM) > resveratrol (26.58 μM) > lunularin (34.32 μM). Most resveratrol analogs were mixed/competitive inhibitors of both 3β-HSDs. Lipophilicity (LogP) and lowest binding energy determined the inhibitory strength. Docking analysis showed that resveratrol and its analogs bind to the NAD+-/steroid-binding sites of 3β-HSDs.
Conclusion: Resveratrol can inhibit both human and rat gonadal 3β-HSDs, thereby interfering with the metabolism and concentrations of steroid hormones such as progesterone, testosterone, and estradiol.
Practical Application: Consequently, this interference could hold significance for conditions related to hormone imbalances, such as polycystic ovary syndrome and certain cancers. Disorders marked by elevated levels of androgens, like hyperandrogenism, might find therapeutic benefit from interventions aimed at modulating 3β-HSD activity. Hence, resveratrol and its metabolites could present themselves as natural or supplementary treatment options for managing such conditions.
1. Introduction
Resveratrol (RSV, Figure 1(a)) is a widely recognized food additive that functions as a bioactive molecule. It has been demonstrated to confer benefits with regard to lifespan and longevity (see review [1]). Structurally, RSV belongs to the stilbene class and is a polyphenol, and it exists in many plants and foods, such as red wine [2]. When RSV was orally consumed by humans, its effects vary individually, and this is possibly due to various gut microbiota difference [3]. The reduction of stilbene double bond by colon microbiota forms dihydroresveratrol (DHR) [3], which is further catalyzed into lunularin (LUN) after dihydroxylation [3].
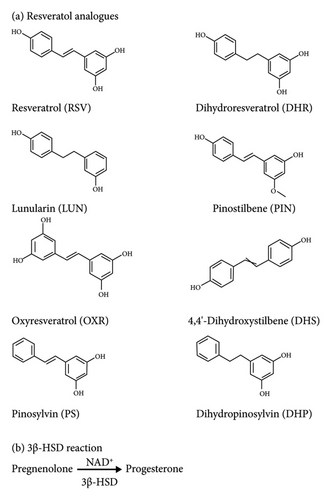
Pinostilbene (PIN, Figure 1(a)) is formed from RSV by O-methyltransferase in the transgenic gut microbiota [4]. Oxyresveratrol (OXR, Figure 1(a)), which is a stilbene from Artocarpus heterophyllus, is believed to be converted from RSV, although the exact pathway has not been identified [5]. There are other stilbenes, including pinosylvin (PS, Figure 1(a)), that mainly exist in white pines. PS can be metabolized by gut microbiota to dihydropinosylvin (DHP, Figure 1(a)) [6, 7]. 4,4′-Dihydroxystilbene (DHS, Figure 1(a)) is a stilbene found in Yucca periculosa [8]. These chemicals have many pharmacological activities, including antidiabetic, antitumor, antioxidative, and anti-inflammatory effects [2, 6, 9]. Although RSV has been found to exert several benefits for therapeutic proposes, the potential side effects of RSV and its analogs on hormone biosynthesis and metabolism have been reported. For example, RSV has been reported to disrupt testosterone biosynthesis in rat Leydig cells by inhibiting rat testicular 3β-hydroxysteroid dehydrogenase 1 (r3β-HSD1) and 3α-HSD as well as 11β-HSD1 (11β-HSD1) [10–12].
3β-HSD is a subfamily of steroidogenic enzymes involved in the biosynthesis of steroid hormones, including progestins, androgens, estrogens, and corticosteroids. Human 3β-HSD type 2 isoform (h3β-HSD2) is reported to be gonadal r3β-HSD1 homolog in human gonads and adrenal cortex [13]. The h3β-HSD2 is a low-affinity NAD+-dependent enzyme, catalyzing the conversion of pregnenolone (P5) to progesterone (P4), thereby playing an important role in the regulation of steroid hormone production (Figure 1(b)). Dysregulation of gonadal 3β-HSD isoforms has been linked to a variety of gonadal and adrenal gland endocrine disorders, such as polycystic ovary syndrome (PCOS) and Cushing’s syndrome [14–16].
To evaluate the potential effects of RSV and its metabolites, we aimed at screening the inhibitory efficacy of RSV and its metabolites by gut microbiota and some related analogs on h3β-HSD2 and exploring mode of action (MOA), structure–activity relationship (SAR), and the underlying mechanism. Rat is an animal model, and its gonads contain the r3β-HSD1 [17]. The objective of this study was to elucidate inhibitory effects of RSV and metabolites on human and rat steroidogenic enzymes, h3β-HSD2, and r3β-HSD1, using KGN cell microsomes and rat testicular microsomes. The novelty of this study was to explore the side effects, MOA, and SARs of these chemicals using in vitro assay and docking simulations. In this study, we also compared the inhibitory efficacy of RSV and metabolites on h3β-HSD2 and r3β-HSD1.
2. Materials and Methods
2.1. Chemicals and Animals
Human granulosa KGN cell line (catalog no. FH1125) was obtained from Fuheng Biotech (Shanghai, China) as a source of h3β-HSD2. Male Sprague–Dawley rats (age of 90 days) were obtained from Shanghai Laboratory Animal Center (Shanghai, China). Rats were kept in cages at the following conditions: 23 ± 2°C, 45%–55% humidity, and 12-h dark°:°12-h light cycle in an SPF room. Then, rats were euthanized by CO2, and testes were collected as the source of r3β-HSD1, under approval by the Experimental Animal Ethics Committee of Wenzhou Medical University (wydw2023-0407). Pregnenolone, progesterone, acetonitrile, forskolin, and NAD+ were obtained from Sigma-Aldrich (St. Louis, MO, USA); RSV, DHR, DHS, and DHP from Mackin (Shanghai, China); LUN from Leyan Bio (Shanghai, China); OXR, PIN, and PS from Aladdin (Shanghai, China); and testosterone-d5 (T-d5, as internal standard, IS) from Zzbio (Shanghai, China).
2.2. Culture of KGN Cells
Human KGN cell contains h3β-HSD2 and can secrete progesterone under the stimulation by forskolin via increasing intracellular cyclic adenosine monophosphate (cAMP) [18]. The passage of KGN cells was P2 to P8. To increase the h3β-HSD2 activity, forskolin, which increases h3β-HSD2 expression, was used as previously described [18]. Briefly, cells were seeded in 8 mL DMEM medium supplemented with 10% fetal bovine serum (FBS, Invitrogen, Shanghai, China) at 37°C, 5% CO2. Cells (80% confluence) were treated with 10 μM forskolin for 24 h, and then, cells were harvested using policeman for the preparation of microsome (containing h3β-HSD2) in 10 mL PBS (pH = 7.2) as below. To test the effect of RSV analogs on progesterone production, chemicals (0–40 μM) were added to 106 KGN cells in 1 mL DMEM and incubated for 24 h, and medium was harvested for the measurement of progesterone as below.
2.3. Preparation of KGN Cell and Rat Testicular Microsomes
KGN cell and rat testicular microsomes were prepared as previously mentioned [19]. Adult male Sprague–Dawley rats (age of 90 days) were used for the collection of testis. In short, the testis was removed after the rat was euthanized using CO2, and the testis was cut into small pieces. KGN cells and rat testes were homogenized in 0.01 M PBS (1:5 w/v) containing 0.25 mM sucrose. Then, the homogenized sample was centrifuged at 700 × g for 30 min. The supernatant was transferred to a high-speed centrifugal tube and centrifuged at 14, 500 × g for 30 min. The supernatant was then transferred to a new ultracentrifuge tube and centrifuged twice at 105, 000 × g for 1.5 h. All of the above operations were performed at 4°C. The microsomal pellet was resuspended in 5 mL PBS buffer by homogenization. The protein content of microsomes was determined by BCA protein kit (Cat# P0010, Beyotime Biotech Inc, Shanghai, China) according to the manufacturer’s instructions. Briefly, the BCA working liquid was prepared by mixing liquid A and liquid B evenly at 50:1. The standard protein stock solution was diluted to 1.0 mg/mL with PBS and added to the 96-well plate at different volumes as the standard curve for protein concentration determination. 2 μL samples were added to other sample wells. PBS was added to the fixed volume of 20 μL. 200 μL BCA working solution was added into each well and placed at 37°C for 30 min. The wavelength at 562 nm was measured. Bovine albumin serum (BSA) was used as the standard. The concentration of protein was calculated from the standard curve.
2.4. Detection of Human h3β-HSD2 and Rat r3β-HSD1 Activity
The h3β-HSD2 or r3β-HSD1 activity was measured as previously mentioned [20]. Briefly, a 100 μL of PBS (0.01 M, pH 7.2) assay system containing pregnenolone, NAD+, and enzyme source (5 μg KGN microsome for h3β-HSD2 or 5 μg rat testicular microsome for r3β-HSD1) in a 1.5 mL tube was reacted at 37°C in a shaking water bath (75 rpm). The following assays were performed: (1) 3β-HSD time-curve assay: 200 nM pregnenolone, 0.2 mM NAD+, and enzyme were mixed, and the mixture was reacted for 0–120 min; (2) Michaelis–Menten kinetics assay: 0–10 μM pregnenolone, 0.2 mM NAD+, and enzyme were mixed, and the mixture was reacted for 120 min; (3) the screening assay for RSV analogs to inhibit 3β-HSDs: 200 nM pregnenolone, 0.2 mM NAD+, 100 μM RSV analog (DMSO as solvent), and enzyme were mixed, and the mixture was reacted for 120 min; (4) half-maximal inhibitory concentration (IC50) determination: 200 nM pregnenolone, 0.2 mM NAD+, enzyme, and 0.1–100 μM RSV analogs were mixed, and the mixture was reacted for 120 min; (5) MOA determination: 0.5–10 μM pregnenolone, 0.2 mM NAD+, 1–100 μM RSV analogs, and enzyme were mixed, and the mixture was reacted for 120 min. At the end of enzymatic reaction, 200 μL acetonitrile containing 10 μL T-d5 was mixed and centrifuged, and 10 μL suspension was injected into an HPLC-MS/MS system to quantitate progesterone.
2.5. HPLC-MS/MS
Acquire HPLC I-class (Waters), BEH C18 column (2.1 × 50 mm, 1.7 μm particle size), and XEVO TQD triple quadrupole mass spectrometer equipped with electrospray ionization sources (Waters, Milford, MA, USA) were used for the progesterone determination as previously described [20]. A gradient program was used, with the mobile phase consisting of solvent A (0.1% formic acid in water) and solvent D (acetonitrile) mixed as follows: 70–30% D (0–0.3 min), 10–90% D (0.3–1.9 min), and 70–30% A (1.9–2.0 min). A subsequent re-equilibration time (1.0 min) was performed before the next injection. The flow rate was 0.40 mL/min, and the injection volume was 10 μL. Column and sample temperatures were maintained at 30°C and 4°C, respectively. In the MRM mode, the unit mass resolution of the mass analyzer was used for detection, and Masslynx 4.1 software (Waters) was used for data acquisition and instrument control. The MRM mode transitions of progesterone and internal substance T-d5 were m/z 315.16 ⟶ 96.92 and m/z 289.07 ⟶ 96.92, respectively. Data were acquired with Masslynx 4.1 software (Waters, USA). The progesterone amount was calculated using the standard curve method with T-d5. The 3β-HSD activity was calculated by the conversion rate (%) of pregnenolone to progesterone and then calculated for velocity (pmol/mg/min).
2.6. Enzyme Assay Analysis
The analyses were performed by GraphPad 8.0 (GraphPad, San Diego, CA, USA) as follows: (1) Michaelis–Menten kinetics was analyzed using a nonlinear regression of velocity (V) versus [pregnenolone, P5] by the equation: V = (Km + [P5])/(Vmax[P5]), to obtain apparent Km and Vmax values; (2) IC50 value was obtained after a nonlinear egression of [inhibitor] versus response (three parameters) using standard slope (Hill slope = −1) by the equation of Y (%) = Bottom + (Top − Bottom)/(1 + 10(X − LogIC50)), where Y is the residual activity (% control) and X is the Log inhibitor concentration; (3) MOA was calculated using a nonlinear regression of Enzyme kinetics-inhibition (mixed model) by the equation v = VmaxApp[P5]/(KmApp + [P5]), where Vmax(App) is the apparent Vmax and Km(App) is the apparent Km, which were obtained from VmaxApp = (Vmax/(1 + ([i]/αKi))) and KmApp = Km(1 + ([i]/Ki))/(1 + ([i]/αKi)), respectively, where [i] is the inhibitor concentration, Ki is the inhibition constant, and α is the factor to determine MOA: (1) α = ∞ (very large) for competitive inhibitor; (2) α is very small but > 0 for uncompetitive inhibitor; (3) α = 1 for noncompetitive inhibitor; (4) α > 1 or α < 1 for mixed inhibitor. Lineweaver–Burk plot was generated by a linear regression to further confirm the MOA.
2.7. In Silico Docking With 3β-HSD
Crystal structures of h3β-HSD2 and r3β-HSD1 were not available. Swiss Homology model of h3β-HSD2 (P26439) and r3β-HSD1 (P22071) was used as protein targets. The h3β-HSD2 (P26439, https://swissmodel.expasy.org/repository/uniprot/P26439) was constructed based on MoeE5 (PDB id: 6kv9.1) in complex with UDP-glucuronic acid and NAD+ [21], and the r3β-HSD1 (P22071, https://swissmodel.expasy.org/repository/uniprot/P22071) was constructed based on the crystal structure of dTDP-D-glucose 4,6-dehydratase (PDB id: 1kew) from Salmonella enterica serovar Typhimurium with thymidine diphosphate bound [22]. The protein structures of h3β-HSD2 and r3β-HSD1were optimized as previously described [23, 24]. ProCheck software was used to verify the anticipated 3D structures by creating the Ramachandran plot [23]. Pregnenolone as substrate was docked with 3β-HSDs to confirm docking structure reliability. The docking was performed using AutoDock 4.0 (Scripps Research Institute, https://autodock.scripps.edu) by a genetic algorithm, and ranking clustering method was used for selecting the best configuration of the inhibitor conformation with the lowest binding energy (ΔG). 3D structure was shown by PyMOL, and 3D superimposed structure was shown by LigPlot as previously described [25]. PLIP software was used for analysis of hydrophobic, π-stacking, and hydrogen bond (HB) as previously described [26]. After analysis, 3β-hydroxy group of pregnenolone forms HBs with key catalytic residues Ser124 and Tyr154 of h3β-HSD2, confirming the structure reliability as previously reported [27]. The 3β-hydroxy group of pregnenolone forms HBs with key catalytic residues Thr125 and Tyr155 of r3β-HSD1.
2.8. Statistical Analysis
Experiments were repeated four times. The enzyme results were analyzed by one-way analysis of variance (ANOVA) and then post hoc Dunnett’s multiple comparisons to compare the significant difference to the control using GraphPad Software 8.0. Bivariate analyses were evaluated using Pearson correlations to measure the potency of the relationship between IC50 values and inhibitors’ features, which were obtained from ZINC database as previously described [28]. The significant differences were expressed as ∗p < 0.05, ∗∗p < 0.01, and ∗∗∗p < 0.001. The data were expressed as mean (SEM, standard error) or mean (SD, standard deviation).
3. Results
3.1. RSV Analogs Inhibit h3β-HSD2
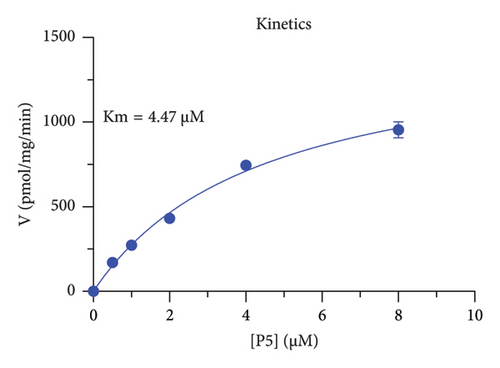
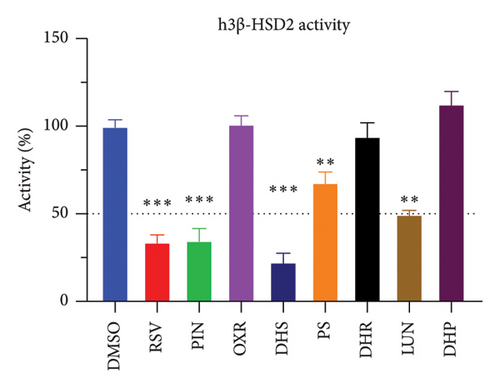
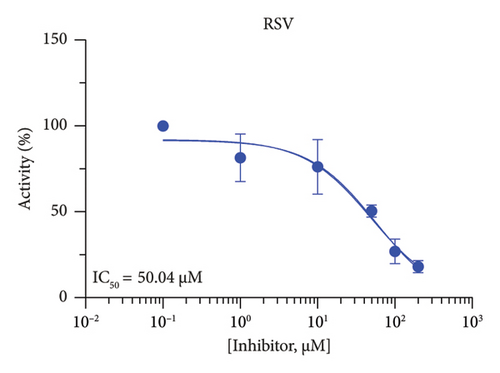
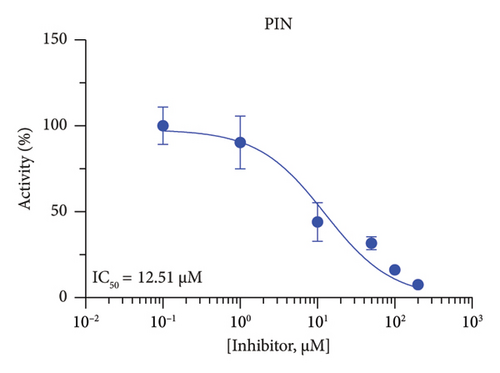
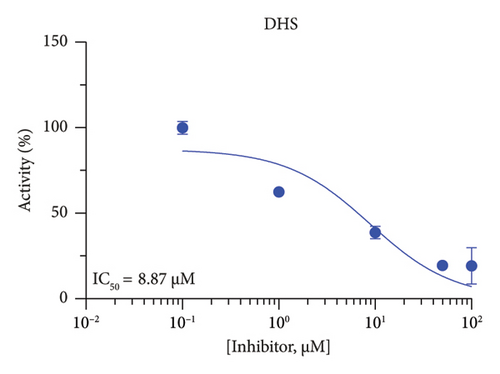
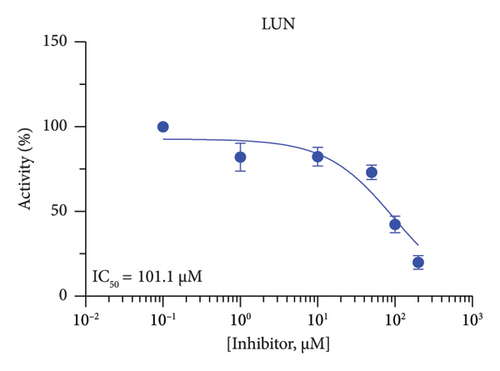
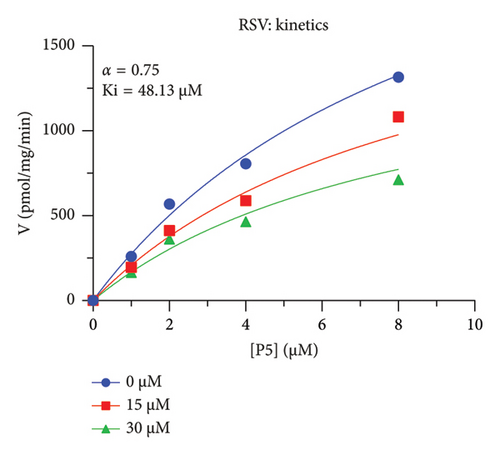
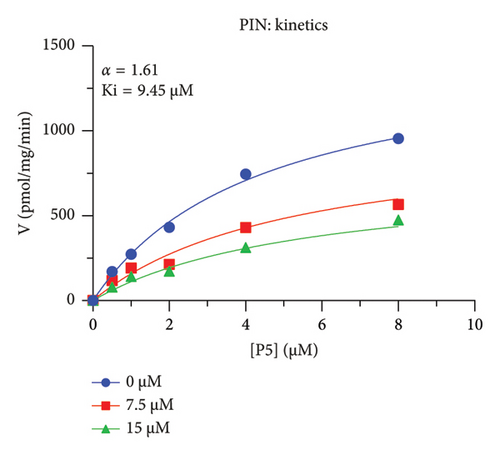
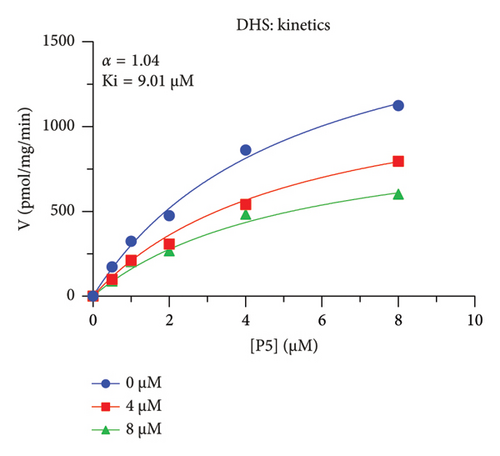
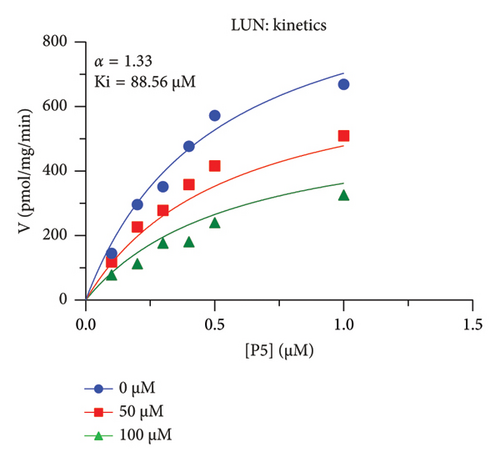
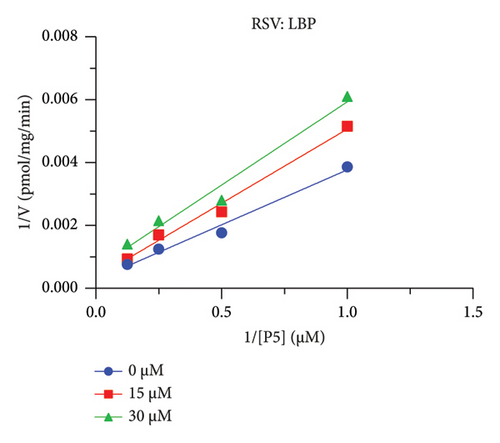
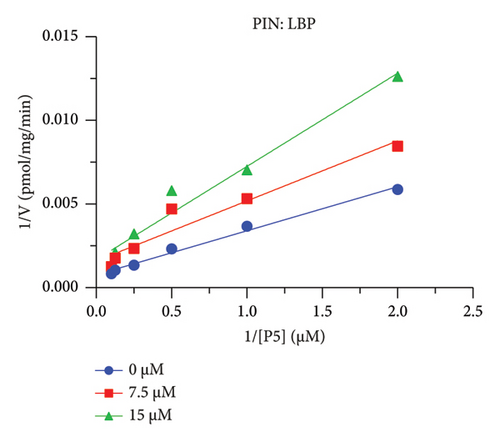
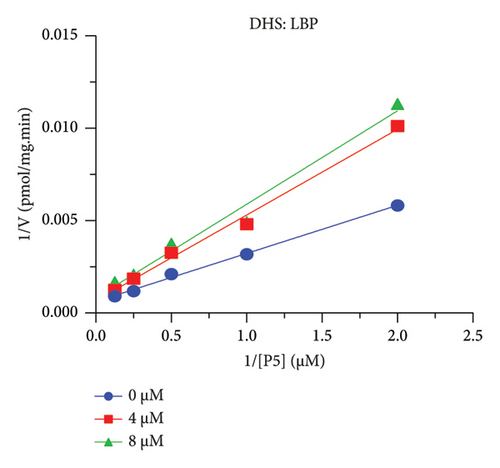
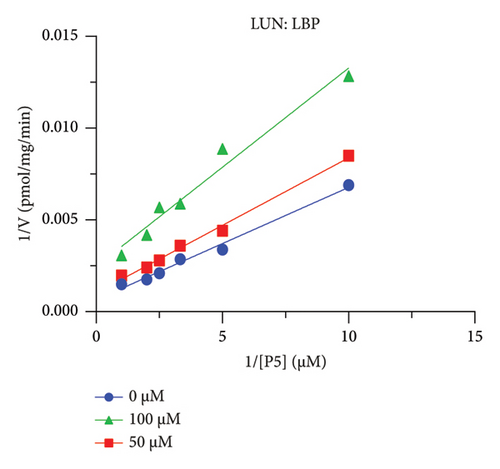
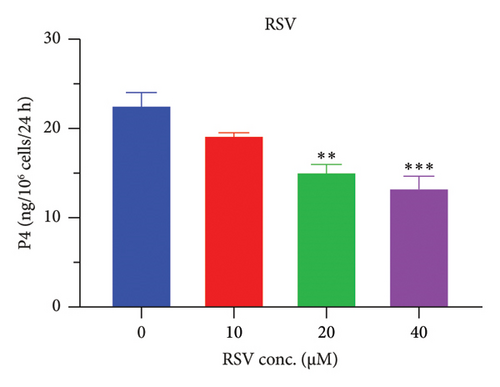
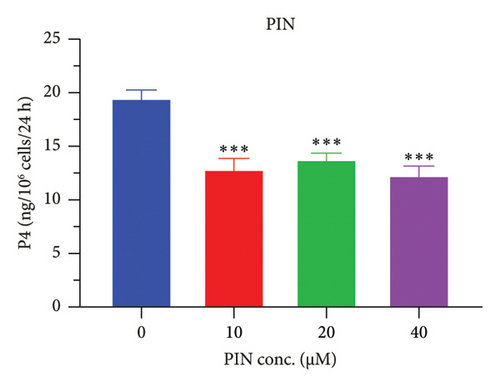
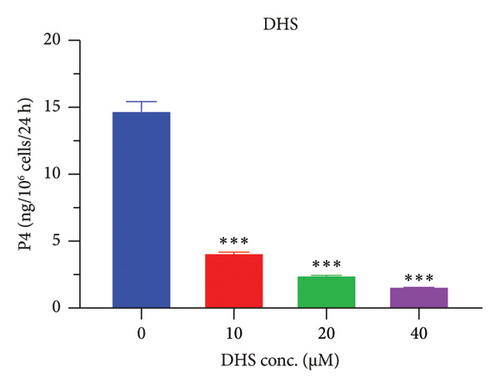
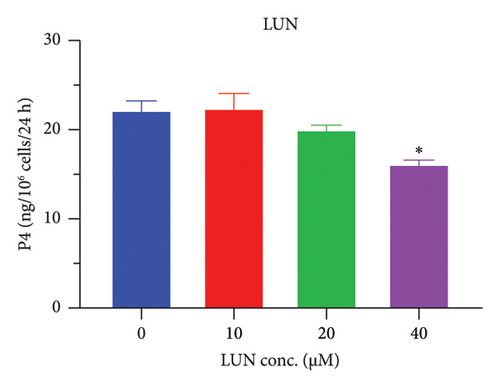
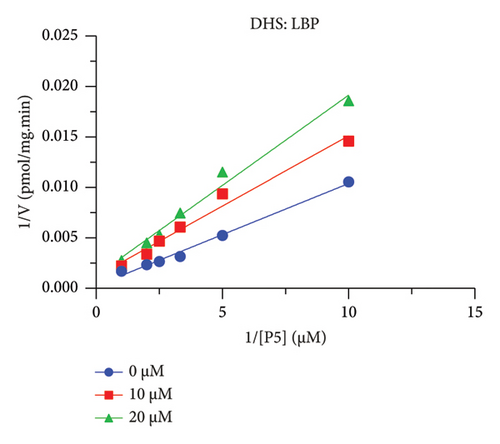
The h3β-HSD2 catalyzes pregnenolone to progesterone by 3β-dehydrogenation and then Δ5,4-isomerization (Figure 1(b)). In this study, we found that its apparent Km was 4.47 ± 0.49 μM, conforming to the reported value range for h3β-HSD2 [17], and its apparent Vmax was 1504 ± 81.47 pmol/mg/min. Eight RSV analogs were screened for their potential effects on h3β-HSD2 (Figure 2(a)). RSV (ANOVA, p < 0.001), PIN (ANOVA, p < 0.001), DHS (ANOVA, p < 0.001), PS (ANOVA, p = 0.002), and LUN (ANOVA, p < 0.001) at a concentration of 100 μM significantly inhibited h3β-HSD2 activity, while OXR, DHR, and DHP had no effects (ANOVA, p > 0.05, Figure 2(b) and Supporting Table S1). The IC50 values of RSV, PIN, DHS, and LUN were 50.04 ± 14.49, 12.51 ± 1.10, 8.87 ± 1.04, and 101.1 ± 17.18 μM, respectively (Table 1 and Figures 2(c), 2(d), 2(e), and 2(f)). Ki values for RSV, PIN, DHS, and LUN were 48.13, 9.45, 9.01, and 88.56 μM, respectively (Figures 3(a), 3(b), 3(c), and 3(d) and Table 1). These results indicate that the inhibitory order is DHS > PIN > RSV > LUN > others. MOA analysis showed that RSV, PIN, DHS, and LUN were mixed inhibitors (Figures 3(a), 3(b), 3(c), 3(d), 3(e), 3(f), 3(g), and 3(h) and Table 1). We analyzed the effects of RSV, PIN, DHS, and LUN on progesterone secretion by KGN cells under forskolin stimulated conditions. Indeed, DHS at ≥ 10 μM (ANOVA, p < 0.001), PIN at 10 μM (ANOVA, p = 0.0016), 20 μM (ANOVA, p = 0.0048), and 40 μM (ANOVA, p = 0.0008), and RSV at 20 μM (ANOVA, p = 0.0022) and 40 μM (ANOVA, p < 0.0004), as well as LUN at 40 μM (ANOVA, p = 0.0120), significantly inhibited progesterone production (Figure 4).
| Compound | IC50 (μM) | Ki (μM) | Cal. Ki (μM) | Mode action (α value) | Energy (kcal/mol) | Binding site |
|---|---|---|---|---|---|---|
| Human 3β-HSD2 | ||||||
| RSV | 50.04 ± 14.49 | 48.13 | 36.40 | Mixed (α = 0.75) | −6.06 | Steroid |
| PIN | 12.51 ± 1.10 | 9.45 | 14.15 | Mixed (α = 1.61) | −6.62 | Steroid |
| DHS | 8.87 ± 1.04 | 9.01 | 8.65 | Mixed (α = 1.04) | −6.91 | Steroid |
| LUN | 101.1 ± 17.18 | 88.56 | 87.46 | Mixed (α = 1.33) | −5.54 | Steroid |
| Rat3β-HSD1 | ||||||
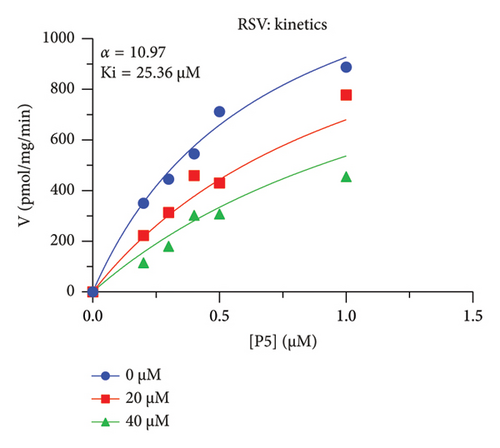
| RSV | 26.58 ± 5.31 | 25.36 | 22.22 | Mixed (α = 10.97) | −6.35 | Steroid |
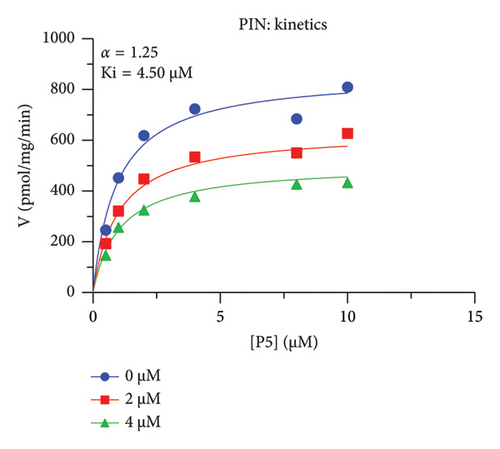
| PIN | 4.60 ± 0.44 | 4.50 | 4.89 | Mixed (α = 1.24) | −7.24 | Steroid |
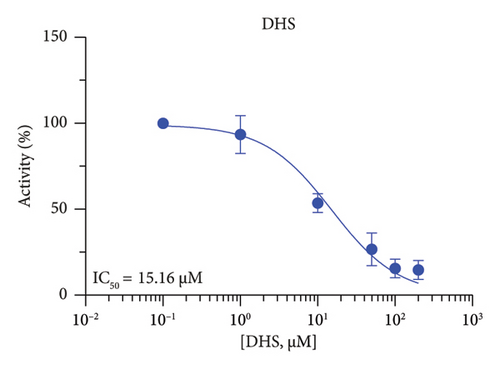
| DHS | 15.16 ± 2.17 | 13.39 | 18.47 | Competitive (α = ∞) | −6.46 | Steroid |
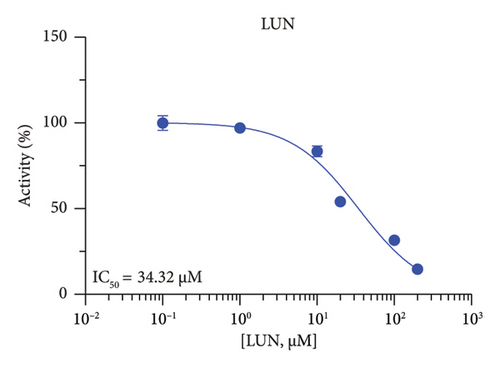
| LUN | 34.32 ± 4.05 | 33.82 | 27.37 | Mixed (α = 4.10) | −6.22 | Steroid |
- Note: Mean ± SEM, n = 4.
3.2. RSV Analogs Inhibit r3β-HSD1
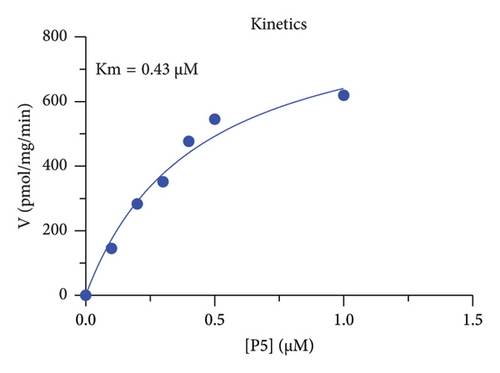
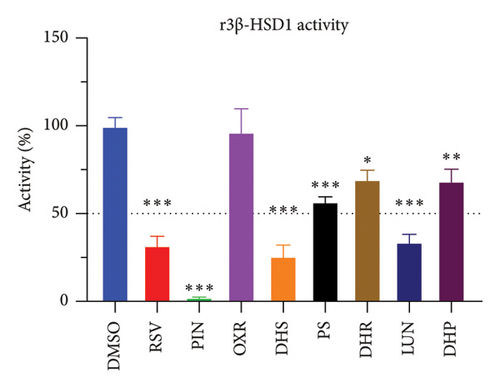
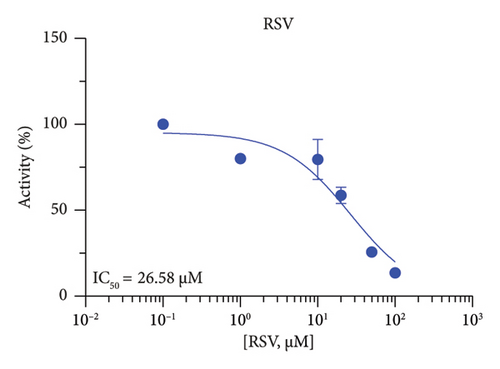
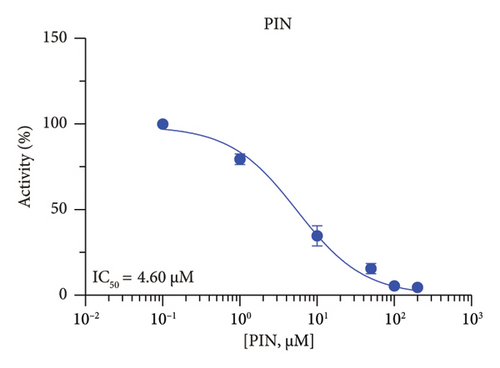
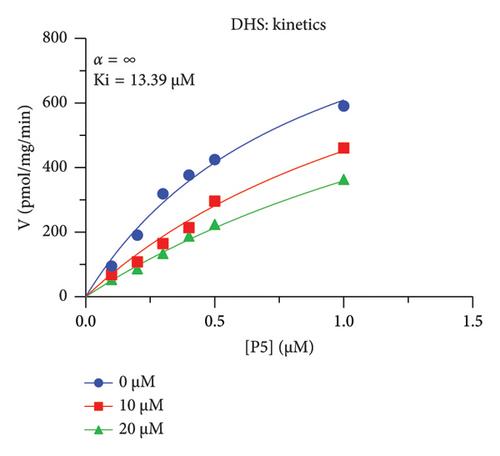
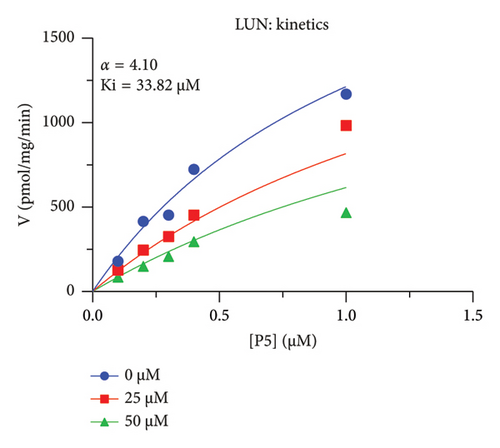
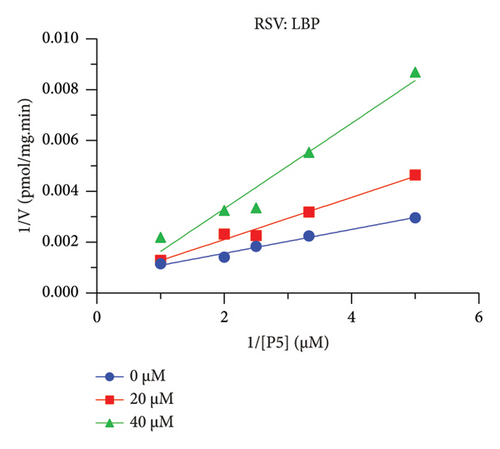
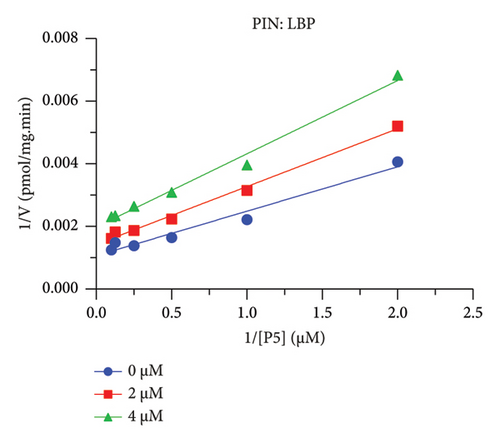
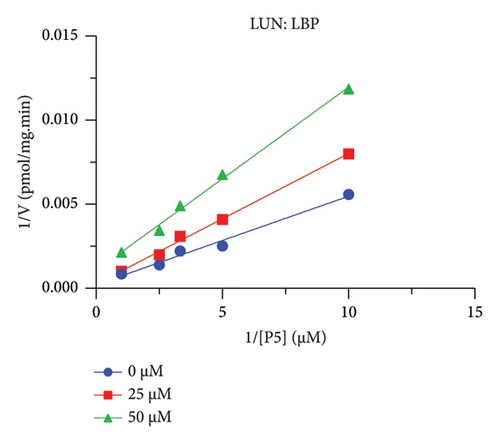
The r3β-HSD1 isoform catalyzes pregnenolone to progesterone by 3β-dehydrogenation and then Δ5,4-isomerization (Figure 1(b)). In this study, we found that its apparent Km was 0.43 ± 0.01 μM, conforming to the reported value range for r3β-HSD1 [17], and its apparent Vmax was 916 ± 86 pmol/mg/min. Eight RSV analogs were screened for their potential effects on r3β-HSD1 (Figure 5(a)). RSV (ANOVA, p < 0.001), PIN (ANOVA, p < 0.001), DHS (ANOVA, p < 0.001), PS (ANOVA, p < 0.001), and LUN (ANOVA, p < 0.001) at a concentration of 100 μM significantly inhibited r3β-HSD1 activity to below 50% of the control, and DHR (ANOVA, p = 0.012) and DHP (ANOVA, p = 0.0096) inhibited the enzyme with residual activity over 50% of the control, while OXR had no effects (ANOVA, p > 0.05, Figure 5(b) and Table S1). The IC50 values of RSV, PIN, DHS, and LUN were 26.58, 4.60, 15.16, and 34.32 μM, respectively (Table 1 and Figures 5(c), 5(d), 5(e), and 5(f)). Ki values for RSV, PIN, DHS, and LUN were 25.36, 4.50, 13.39, and 33.82 μM, respectively (Figures 6(a), 6(b), 6(c), 6(d) and Table 1). These results indicate that the inhibitory order is PIN > DHS > RSV > LUN > others. MOA analysis showed that RSV, PIN, and LUN were mixed inhibitors while DHS was a competitive inhibitor (Figures 6(a), 6(b), 6(c), 6(d), 6(e), 6(f), 6(g), and 6(h) and Table 1).
3.3. In Molecular Docking Analysis of RSV Analogs With h3β-HSD2
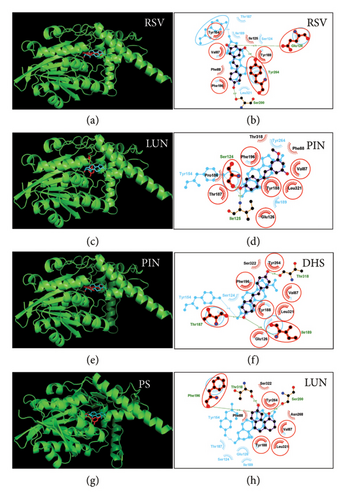
The 3D structures of both h3β-HSD2 and r3β-HSD1 were validated by Ramachandran plots. It showed that a large percentage (over 94%) of the residues of 3β-HSD enzyme are located in favorable regions of the Ramachandran plot, indicating that the polypeptide backbone has a conformation that is energetically favorable. This is important for the overall stability of the enzyme structure (Supporting Figure S1). First, docking of pregnenolone with h3β-HSD2 was analyzed. Pregnenolone forms an HB with the catalytic residue Tyr154 and has hydrophobic interactions with seven residues (Figure S2A). Then, the docking analysis of all RSV analogs was conducted, and they were found to bind to the catalytic domain of h3β-HSD2 (Figure 7). RSV forms HBs with residue Ser200 through 4′-OH, with residue Glu126 through 3′-OH group, and with Tyr264 through the 5′-OH group. It also has hydrophobic interactions with six residues, and the ΔG is −6.06 kcal/mol (Figure 7(b)). PIN forms HBs with residues Ser124 and Ile125 through the 4′-OH group and possesses hydrophobic interactions with 8 residues. It also has a π-stacking bond with Phe196, and the ΔG is −6.62 kcal/mol (Figure 7(d)). DHS forms HBs with residues Thr187 and Ile189 through the 4′-OH group and with residue Thr318 through the 4′-OH group. It possesses hydrophobic interactions with 6 residues, it has π-stacking bonds with Tyr188 and Tyr264, and ΔG is −6.91 kcal/mol (Figure 7(f)). LUN forms HBs with residue Thr318 through the 4′-OH group and with residue Ser200 and Phe196 through the 3′-OH group. It possesses hydrophobic interactions with 6 residues, and a π-stacking bond with Tyr264, and the ΔG is −5.54 kcal/mol (Figure 7(h)).
3.4. In Molecular Docking Analysis of RSV Analogs With r3β-HSD1
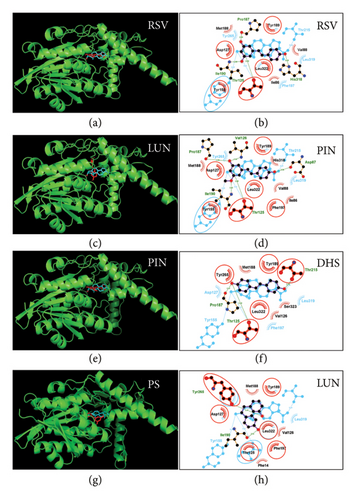
The docking of pregnenolone with r3β-HSD1 was conducted. Pregnenolone forms 3 HBs with the catalytic residues Thr125, Tyr155, and Thr215. It also has hydrophobic interactions with 5 residues (Figure S2B). When the catalytic domain of r3β-HSD1 was compared to that of h3β-HSD2, there was a high degree of similarity (Figure S2C). All RSV analogs were analyzed, and they were found to bind to the catalytic domain of r3β-HSD1 (Figure 8). RSV forms HBs with His318 through the 4′-OH group, Ile190 through the 5′-OH group, and Thr125 and Pro187 through the 5′-OH group. Additionally, it has hydrophobic interactions with 5 residues, resulting in a ΔG of −6.35 kcal/mol (Figure 8(b)). PIN forms HBs with Asp87 through the 4′-OH group, Ile190 through the 3′-OMe group, and Thr125, Pro187, and Val126 through the 5′-OH group. It also exhibits hydrophobic interactions with 4 residues, resulting in a ΔG of −7.24 kcal/mol (Figure 8(d)). DHS forms HBs with Thr215 through the 4′-OH group, and Thr125 and Pro187 through the 4′-OH group. It also has hydrophobic interactions with 4 residues, as well as a π-stacking interaction with Tyr265, resulting in a ΔG of −6.46 kcal/mol (Figure 8(f)). LUN forms HBs with Ile190 through the 4′-OH group and Tyr265 through the 3′-OH group. It exhibits hydrophobic interactions with 6 residues, resulting in a ΔG of −6.22 kcal/mol (Figure 8(h)).
3.5. SAR Analysis for RSV Analogs With h3β-HSD2 and r3β-HSD1
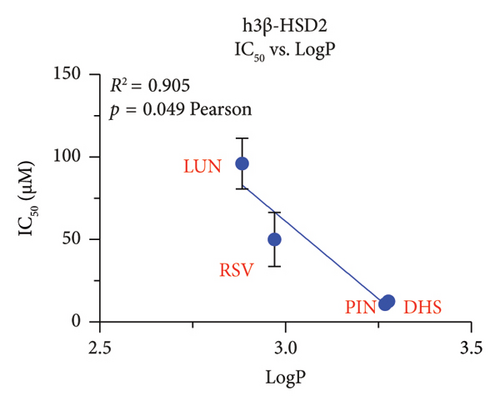
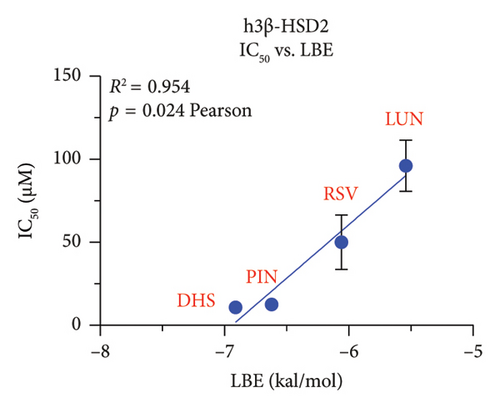
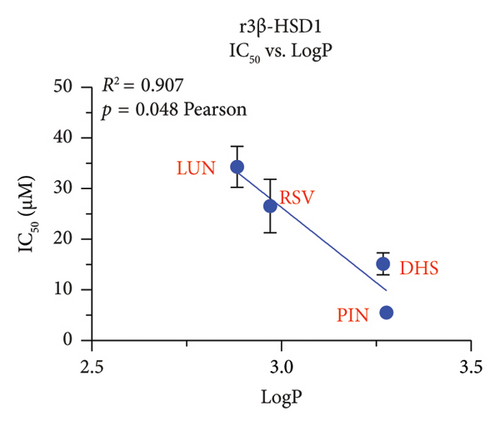
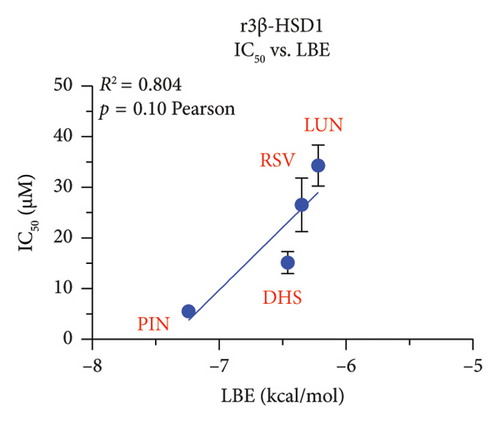
We explored which structural determinants of RSV analogs were correlated with the observed inhibitory IC50 values on human h3β-HSD2. All molecular characteristics (molecular weight, topological polar surface area, total HB donor and acceptor number, LogP, and ΔG) were studied for RSV analogs. No relationship between the molecular weight, the topological polar surface area, and total HB donor and acceptor number, and polar desolvation of RSV analogs and the IC50 values (Figures S3 and S4) were significant, indicating that the inhibitory potency of RSV analogs on h3β-HSD2 and r3β-HSD1 does not depend on molecular weight, topological polar surface area, and total HB donor and acceptor number, as well as polar desolvation. There is an inverse correlation between LogP values and IC50 values (higher LogP values corresponded to lower IC50 values), meaning that as the lipophilicity of the compound (as measured by LogP) increases, the compound becomes more potent as an inhibitor (as indicated by the lower IC50 value). Additionally, a positive correlation was found with ΔG values: higher ΔG values correlated with lower activity (Figure 9).
4. Discussion
Many natural stilbenes including RSV have multiple pharmacological and biological activities [2]. In this study, we identified that RSV and its metabolites by gut microbiota and other stilbenes such as DHS potently inhibited h3β-HSD2 and r3β-HSD1 activity.
In this study, we have determined RSV as the most representative dietary stilbene and its gut microbial-derived metabolites DHR, LUN, PIN, and OXR to inhibit two 3β-HSD isoforms in two species. In addition, the dietary stilbenes PS, DHP, and DHS were measured together for possible critical structural features related to the inhibition of 3β-HSD. It was found that five RSV analogs significantly inhibited h3β-HSD2 and r3β-HSD1 activity and DHS and PIN were among potent compounds to inhibit these enzymes, thereby possibly leading to the inhibition of testosterone. Indeed, studies conducted on in vitro Leydig cell cultures have shown that RSV can reduce testosterone production by rat Leydig cells [29, 30] and progesterone production of mouse MA-10 cell line [31]. However, it is important to note that RSV may also have a protective effect on testis from injury caused by toxicants and diseases [32, 33]. Our SAR analysis clearly showed that lipophilicity (LogP) of RSV analogs was well correlated with inhibitory potency, the higher LogP, the more potent inhibition on both h3β-HSD2 and r3β-HSD1 by RSV analogs (Figure 9).
There are two subclasses of RSV analogs: (1) stilbenes (RSV, PIN, OXR, DHS, and PS) and (2) dihydrostilbenoid (DHR, LUN, and DHP). In the stilbene subclass, the chemical structure of DHS has two 4′-OH groups, and it seems that this orientation shows stronger inhibition (IC50 = 8.87 μM) on h3β-HSD2 than RSV (50.04 μM). The same is true for r3β-HSD1 (15.16 μM for DHS vs. 26.56 μM for RSV). When compared with DHS (two 4′-OH groups), RSV has three hydroxyl groups (4′-OH, 3′-OH, and 5′-OH). Additional OH group possibly causes a decrease in LogP, thereby resulting in weak inhibition. PIN is a metabolite of RSV after O-methylation [4]. When 5′-OH of RSV is methylated to PIN, PIN increased its inhibition on h3β-HSD2 by 4-fold or on r3β-HSD1 by about 6-fold. Methylation of 5′-OH possibly leads to higher LogP, thereby resulting in potent inhibition. OXR is an active molecule isolated from Artocarpus heterophyllus Lam [5]. OXR is speculated to be formed from RSV, although the exact synthetic pathway has not been identified [5]. When compared with RSV, OXR has additional OH group and it was ineffective to inhibit both enzymes at 100 μM. The additional OH group in OXR possibly causes a decrease in LogP (OXR 2.679 vs. RSV 2.97), thereby resulting in weak inhibition. Interestingly, when compared with RSV, PS has no 4′-OH and it has even much higher LogP (3.268) than RSV (2.97), but it had weak inhibition on both enzymes, indicating that the 4′-OH significantly contributes to the inhibition.
In the dihydrostilbenoid subclass, DHR is a metabolite of RSV after the reduction of the stilbene double bond by colon microbiota [9]. It seems that the reduction of double bond has reduction in its inhibitory effect (no inhibition at 100 μM for h3β-HSD2) when compared with RSV. The same is true for r3β-HSD1 (weaker inhibition by DHR than RSV). Apparently, the reduction of double bond leads to the decrease in LogP (DHR 2.589 vs. RSV 2.97), thereby leading to weak or no inhibition. The same is true for PS (another stilbene mainly in white pines) and its reduced metabolite DHP (68.07% h3β-HSD2 residual activity for PS vs. 112% residual activity for DHP at 100 μM, or 56.95% r3β-HSD1 residual activity for PS vs. 68.73% residual activity for DHP) [6, 7]. This is because the reduction double bond possibly leads to lower LogP (DHP 2.883 vs. PS 3.268). Interestingly, with the reduction of double bond in LUN when compared to DHR, the loss of 5′-OH possibly leads to increase in LogP (LUN 2.883 vs. DHR 2.589).
Docking analysis showed that PIN (the O-methylated RSV metabolite) has lower ΔG than RSV and forms HB with key catalytic residue Ser124 (h3β-HSD2)/Thr125, which has been suggested to interact with substrate by docking analyses [34]. Docking analysis showed that the 4′-OH group of RSV analogs can form HB with several critical residues of both enzymes, while PS and DHP have no 4′-OH and cannot form such HBs, possibly explaining their no/weak inhibition on both enzymes. In search for the mechanism underlying such effect, we performed the correlation of IC50 values and ΔG values. The correlation between the predicted ΔG values and IC50 values of RSV analogs clearly shows a negative correlation, implying that the docking model can well predict the inhibitory potency of RSV analogs on h3β-HSD2 and r3β-HSD1.
Interestingly, we found that 4 stilbenes (RSV, PIN, DHS, and LUN) can significantly inhibit progesterone production in human KGN cells at various concentrations, depending on their inhibitory potency on human h3β-HSD2. All chemicals are effective at 40 μM to inhibit progesterone production, especially DHS, which can result in almost no progesterone production at 40 μM. However, in vitro studies to examine potential biological activities, including the inhibition on h3β-HSD2, should be on the basis of plausible physiological levels, which can be achieved in vivo [35]. In this regard, RSV, and especially its gut microbial-derived metabolites, including LUN, can reach the human colon at concentrations of >100 μM [3]. This study showed that several RSV analogs can inhibit h3β-HSD2 at <100 μM.
Our present study also showed that there are some differences in the inhibitory potency on h3β-HSD2 and r3β-HSD1. Generally speaking, r3β-HSD1 was sensitive to the inhibition by RSV metabolites except DHS, when compared to human h3β-SHD2. Although both h3β-HSD2 and r3β-HSD1 share high similarity of catalytic domains (Figure S3), these two enzymes have distinct affinity: Km of h3β-HSD2 is 4.7 μM, while Km of r3β-HSD1 is 0.43 μM. The different affinity may determine the species-dependent inhibition.
Further research in this area using animal disease model to test the efficacy of RSV analogs in vivo may contribute to identify the side effects in vivo.
5. Conclusion and Future Perspective
This study advances understanding of RSV and its metabolites’ inhibitory effects on gonadal h3β-HSD2 and rat homolog r3β-HSD1. Unlike prior studies on RSV’s benefits, we investigated potential side effects, especially those from gut microbiota–mediated metabolism. Using gonadal cell microsomes, we quantified inhibitory potency and found that most analogs are mixed/competitive inhibitors. Docking simulations provided molecular-level understanding. However, in vitro models lack physiological complexity, and gut microbiota’s role was inferred indirectly. Future research should do in vivo studies, explore clinical implications, target gut microbiota modulation to mitigate adverse effects, and expand the scope to more RSV derivatives and their interactions with 3β-HSD isoforms. In conclusion, this study enhances pharmacological knowledge of RSV and its analogs and emphasizes considering potential side effects in therapy, paving the way for more comprehensive use in future medical treatments.
Conflicts of Interest
The authors declare no conflicts of interest.
Author Contributions
Y.Z. helped to manage the data curation and animal study and wrote original draft; C.H. helped to develop methodology and docking; H.L. helped supervision; Y.W. and S.W. helped validation; X.L.: supervised the study; R.-s.G. and Q.Z. helped in the conceptualization, funding acquisition, and editing. Yingna Zhai and Chunnan Hu contributed to this work equally.
Funding
Funding for this study was provided by the Zhejiang Provincial Nature Science Foundation (grants LY22H040010 to R.-s.G.) and the Wenzhou Science and Technology Bureau (grants 2023Y1320 to Q.Z.).
Acknowledgments
Funding for this study was provided by the Zhejiang Provincial Nature Science Foundation (grant LY22H040010 to R.-s.G.) and the Wenzhou Science and Technology Bureau (grants 2023Y1320 to Q.Z.). We thank Scientific Research Center of Wenzhou Medical University for consultation and instrument availability that supported this work.
Supporting Information
Table S1: Chemical name and abbreviation and LogP values and residual activity of human h3β-HSD2 and rat r3β-HSD1.
Figure S1: The Ramachandran figure illustrating the phi–psi torsion angles for h3β-HSD2 (A) and r3β-HSD1 (B). The red regions represent the most desirable phi–psi value combinations. The white region represents an undesirable phi–psi combination. These results showed that all 3β-HSD structures had high validity.
Figure S2: Molecular docking of pregnenolone (P5) with human h3β-HSD2 (A), rat r3β-HSD1 (B), and superimposed (C): (A, B) pregnenolone (P5)-binding site; (C) r3β-HSD1 overlaps h3β-HSD2 (P5, purple) contact residues (red circled) and HBs (green dashed line) with distance.
Figure S3: IC50 values of inhibiting human h3β-HSD2 dependence on molecular weight (MW, A), total HB acceptor and donor number (B), polar surface area (PSA, C), and apolar desolvation (AD, D). Pearson correlation values were calculated. Values are shown as mean ± SEM (n = 4).
Figure S4: IC50 values of inhibiting rat r3β-HSD1 dependence on molecular weight (MW, A), total HB acceptor and donor number (B), polar surface area (PSA, C), and apolar desolvation (AD, D). Pearson correlation values were calculated. Values are shown as mean ± SEM (n = 4).
Appendix A: Supplementary Data
Supporting information Supporting data (Table S1 and Figures S1–S4) associated with this article can be found in the online version at doi:
Open Research
Data Availability Statement
Data sharing is not applicable to this article as no new data were created or analyzed in this study.


