Ameliorative Effect of Glycerol Monolaurate on Glucose Dyshomeostasis in db/db Mice Associated With the PGC-1α Signaling Pathway and Intestinal Microbiota
Abstract
Glycerol monolaurate (GML) has previously been demonstrated to improve insulin resistance in mice fed a high-fat diet (HFD), yet whether GML can enhance glucose homeostasis in diabetic mice remains uncertain. In the current study, BKS mice and BKS-db/db mice were fed a normal chow diet and administered GML solution by gavage for 9 weeks. Weekly postprandial blood glucose, water intake, and weight were recorded at regular intervals. Serum metabolic indicators, liver gene expression, and intestinal microbiota were also assessed. The results revealed that GML significantly decreased the postprandial blood glucose in the later stage of the feeding period, markedly reduced water intake in db/db mice, maintained body weight, and significantly improved glucose and insulin tolerance. Moreover, GML significantly reduced fasting blood glucose and insulin resistance index. GML also significantly inhibited the proliferator-activated receptor-γ coactivator-1α (PGC-1α) signaling pathway, thereby suppressing the gluconeogenic pathway, but activated the gene expression of glucokinase in the glycolysis pathway. GML also significantly altered the gut microbiota, decreasing the abundance of Firmicutes, Lactobacillus, and Lachnospiraceae, while increasing the abundance of Bacteroidetes, Helicobacter, Parabacteroides, and S24-7. Our findings suggest that GML modulates gut microbiota and inhibits the PGC-1α signaling pathway, which may be associated with the improved glucose homeostasis observed.
1. Introduction
Glucose homeostasis involves regulatory systems that maintain blood glucose levels within a narrow range. The maintenance of glucose homeostasis is complex and tightly regulated by hormones, such as insulin and glucagon, and various pathways, including glycogenesis, glycogenolysis, glycolysis, and gluconeogenesis. Diabetes is a metabolic disease characterized by high blood glucose levels, which result from insufficient or impaired insulin secretion [1]. The primary clinical symptoms of diabetes include increased appetite, excessive thirst, frequent urination, and weight loss. Prolonged hyperglycemia can lead to lasting harm to the eyes, kidneys, heart, blood vessels, nerves, and other body systems [2]. The diagnosis of diabetes is primarily based on blood glucose levels. Currently, Type 2 diabetes (T2D) accounts for over 90% of all diabetes cases. Several lifestyle factors are recognized as significant contributors to T2D, including unhealthy eating habits, lack of physical activity, anxiety, and living in urban areas [3,4]. The management of diabetes encompasses a range of approaches, including dietary modifications, physical activity, pharmaceutical interventions, and insulin administration. To date, metformin is the most commonly prescribed medication for T2D [5]. It has been shown to effectively decrease postprandial serum sugar levels and improve insulin sensitivity in T2D patients [6]. However, an increasing amount of evidence indicates that excessive use of metformin can result in some adverse effects, such as lactic acidosis [7]. Therefore, the search for safe, food-derived substances to improve T2D is increasingly urgent.
Several studies have illustrated the advantageous effects of dietary ingredients in improving T2D. The consumption of inulin in the diet has been discovered to alleviate various phases of T2D by suppressing inflammation and modulating the gut microbiota [8]. Eicosapentaenoic acid and docosahexaenoic acid have been demonstrated to possess a notable ability to reduce hyperglycemia in db/db mice through the modification of gut microbiota and metabolites [9]. Octyl and decyl glycerate were found to effectively improve insulin resistance in mice fed with a high-fat diet (HFD) [10]. Glycerol monolaurate (GML) occurs naturally as a component in coconut oil and palm oil and is widely used as a food emulsifier. Our earlier research demonstrated that the administration of GML could alleviate hyperglycemia and insulin resistance in HFD-fed mice, which might be attributed to the alteration of gut microbiota and glycerophospholipid metabolism regulation [11]. Nevertheless, in the HFD-fed mice of that experiment, we did not observe a significant elevation in blood glucose levels as a sign of T2D development. The gluconeogenesis, glycolytic pathway, and the composition of intestinal microbiota in T2D patients differ dramatically from those in typical obese patients. Thus, though we have seen that GML alleviates glucose dyshomeostasis in obese mice fed with HFD, the investigation of its applicability to diabetes is limited.
To understand the influence of GML on diabetic glucose metabolism, we conducted a randomized controlled trial in db/db mice. We included metformin as a positive control and assessed the effects of metformin and GML on weekly postprandial blood glucose levels, as well as glucose tolerance and insulin resistance in the db/db mice. For a more comprehensive analysis, we detected the expression of critical genes associated with the processes of gluconeogenesis and glycolysis in the db/d mice. Additionally, we investigated the changes in the composition of the gut microbiota. Our research aims to generate further compelling data to enhance our comprehensive understanding of the nutritional role of GML.
2. Materials and Methods
2.1. Animals and Experimental Design
Six-week-old BKS and BKS-db/db male mice were obtained from Jiangsu GemPharmatech Co., Ltd. They were housed in Zhejiang Chinese Medicine University and received approval from the animal ethics committee of the agency (approval no. 202206-0486). All the mice were maintained under a 12-h light/dark cycle and had free access to water and food. Based on our previous studies [12, 13], a GML dosage of 160 mg/kg of body weight was selected for the animal treatment (GML was purchased from Hangzhou Kangyuan Co., Ltd., Hangzhou, China). A group of BKS mice (wt/wt) was given a normal chow diet (NCD) and received daily intragastric treatment with the solvent (50% PEG400 and 50% normal saline, n = 12). The BKS-db/db male mice were randomly divided into three groups: the db/db group received a NCD and a daily intragastric treatment of 5 mL/kg of body weight solvent (50% PEG400 and 50% normal saline) as a negative control (n = 12), the metformin group received 5 mL/kg of body weight metformin solution (200 mg of metformin dissolved in 2.5 mL of PEG400 and 2.5 mL of normal saline) as a positive control (n = 12), and the GML group received 5 mL/kg of body weight GML solution (160 mg of GML dissolved in 2.5 mL of PEG400 and 2.5 mL of normal saline) (n = 12). The body weight, food intake, and water consumption of the mice were recorded weekly. Postprandial serum glucose levels were measured by tail clipping blood collection once a week. Fresh feces of mice were collected during the last week of the treatment and stored at −80°C. In the final stage of the 9-week feeding experiment, the mice were subjected to a 12-h fast followed by euthanasia, after which the liver, pancreas, and skeletal muscle were immediately collected. A portion of the epididymal fat and pancreas were preserved with paraformaldehyde for histological evaluation.
2.2. Glucose and Insulin Tolerance Tests
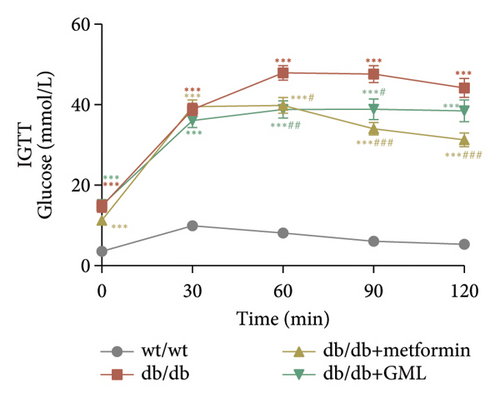
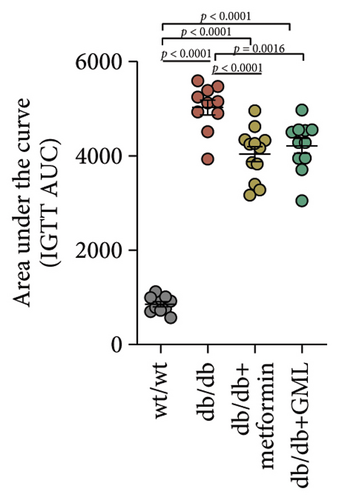
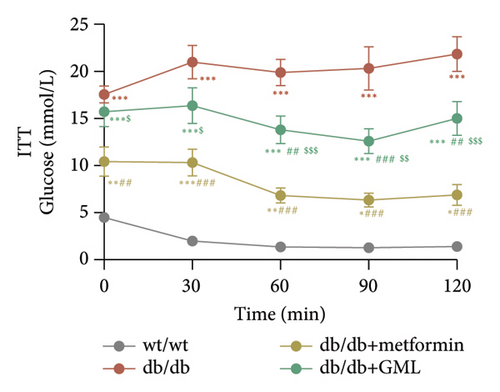
The glucose tolerance test was conducted by intraperitoneal injection in the seventh week. The mice were fasted overnight and then received an intraperitoneal injection of glucose solution (1.5 g/kg of body weight). Blood was collected from the tail tip at 0, 30, 60, 90, and 120 min postinjection, and the glucose content in peripheral blood was tested using a rapid blood glucose meter. The blood glucose value was plotted, and the area under the curve (AUC) was calculated to assess the glucose tolerance. Following the glucose tolerance test, the mice were allowed to acclimate for 1 week before undergoing the insulin tolerance test. After fasting overnight, the mice received an intraperitoneal injection of insulin solution (2 U/kg of body weight), followed by blood glucose measurements at 0, 30, 60, 90 and 120 min, and the AUC was obtained by calculation.
2.3. Biochemical Property Analysis
The Nanjing Jiancheng Bioengineering Institute provided commercial kits for measuring the serum concentration of glucose, triglycerides (TG), total cholesterol (T-CHO), low-density lipoprotein cholesterol (LDL-C), and high-density lipoprotein cholesterol (HDL-C). Enzyme-linked immunoassay kits from Wuhan ColorfulGene Biotechnology Co., LTD were taken to detect the serum concentration of insulin, glucagon-like peptide 1 (GLP-1), adiponectin (ADP), lipopolysaccharides (LPS), interleukin-1β (IL-1β), and tumor necrosis factor (TNF).
2.4. Gene Expression
Gene expression in the liver was detected by real-time fluorescent quantitative PCR (qPCR) techniques. RNA of the liver was extracted using Trizol reagent from Vazyme Company (Nanjing, Jiangsu). The content and purity of the RNA from different tissues were assessed using Nanodrop ND-2000 (Thermo Fisher Scientific, MA, USA). Subsequently, the RNA was converted into complementary DNA (cDNA) using the reverse transcription kit from Vazyme (Nanjing, Jiangsu). Gene expression was then measured on the LightCycler 480 instrument (Roche Applied Science, IN, USA) after the addition of 2 × ChamQ SYBR Color qPCR Master Mix (Vazyme, Nanjing, Jiangsu) to the cDNA solution. The 2−ΔΔCt method was calculated and normalized according to the reference gene Rps18. Each primer sequence is shown in Supporting Table 1.
2.5. Gut Microbiota Analysis
DNA samples were collected from mouse feces samples using a QIAamp DNA Stool Mini Kit (Qiagen, Dusseldorf, Germany). The DNA concentration and integrity were determined, followed by amplification of the V3-V4 variable region by PCR using a specific primer set to construct an amplicon sequencing library. Amplicons were then purified and standardized using the Illumina MiSeq platform according to the provided procedures from Majorbio Bio-Pharm Technology Co. Ltd (Shanghai, China). The purified amplicons were subjected to paired-end sequencing. Raw sequencing data were filtered and merged, and sequences were clustered into the same amplicon sequence variant (ASV) levels using the DADA2/Deblur software package. Sequence analysis was performed using the Greengenes 16S rRNA bacterial database and the RDP classification algorithm. Alpha diversity of the fecal microbiota was reflected using Ace, Chao, Shannon, Simpson, and Venn diagrams. Beta diversity of the intestinal microbiota was assessed by principal coordinate analysis (PCoA) based on ASV levels, which showed the differences among gut microbiota groups. Barplot analysis was conducted at the phylum level and order level, and heatmap analysis was performed at the genus level to demonstrate the composition and distribution of intestinal microbiota. LEfSe cladogram analysis was used to identify species characteristics that differed among groups and to determine the extent to which these characteristics contributed to the differences among groups. A correlation heatmap was used to visualize the direct correlations between bacterial classifications and various metabolic indicators.
2.6. Statistical Analysis
The 16S rRNA sequencing was analyzed using the Majorbio cloud platform (https://cloud.majorbio.com/), while other statistical analyses were performed using GraphPad Prism 8 (GraphPad Software Inc.). Group differences were identified using one-way analysis of variance (ANOVA) followed by Tukey’s multiple comparison post-test. All data were present as mean ± SEM, where a p value of less than 0.05 indicates statistically significant.
3. Results
3.1. GML Improved Postprandial Blood Glucose in db/db Mice
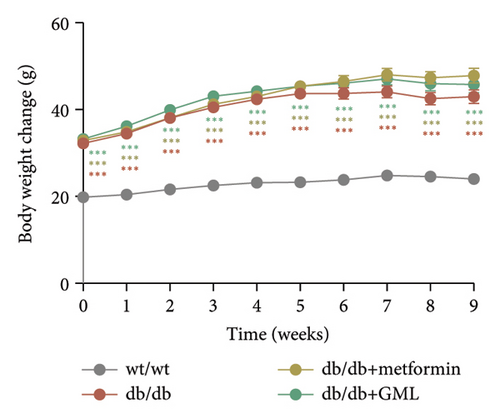
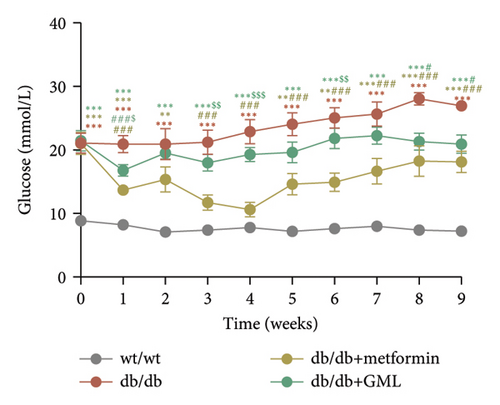
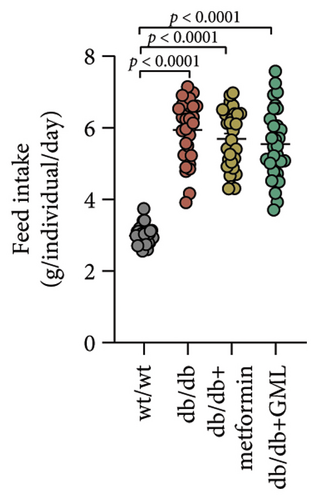
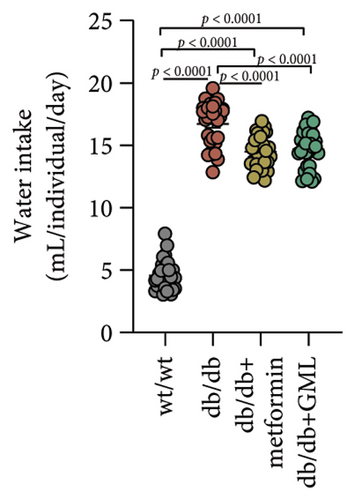
In our study, the weight gain of db/db mice was significantly increased compared to that of wt/wt mice after the start of feeding (Figure 1(a)). However, by Week 5, the weight gain of db/db mice began to slow down and showed a downward trend. Both metformin and GML slowed weight loss in the later stage of feeding. It is worth noting that all db/db mice consumed significantly more food than the wt/wt mice, but no statistically significant difference was detected in food intake between the db/db mice groups (Figure 1(b)). We found that the postprandial blood glucose levels of both db/db and GML treatment groups were significantly higher than those of the wt/wt group throughout the experiment. The blood glucose levels of the metformin treatment group were also higher than those of the wt/wt group during the early and late stages of the experiment (Figure 1(c)). Apparently, the blood glucose levels of the db/db mice were significantly elevated compared to those of the wt/wt mice, which promoted the T2D development. Both GML and metformin treatment reduced blood glucose levels in db/db mice. Throughout most of the experiment, blood glucose levels in the metformin group were significantly lower than those in the db/db group, and blood glucose levels in the GML group were also significantly lower than those in the db/db group at Weeks 8 and 9. Furthermore, the water intake of all the db/db mice was significantly higher than that of the wt/wt mice (Figure 1(d)), while both the metformin and GML treatment groups showed significantly reduced water intake compared to that of the db/db mice.
3.2. GML Ameliorated Glucose and Insulin Tolerance in db/db Mice
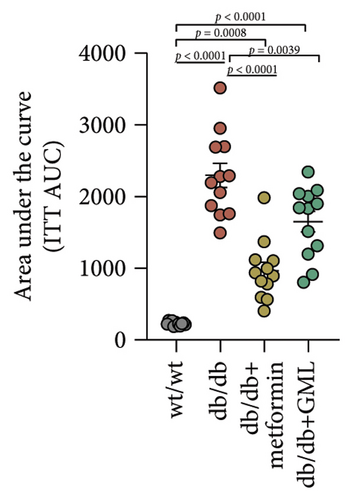
Glucose was administered to all mice via intraperitoneal injection, and we observed the subsequent changes in their blood glucose levels over a period of 120 min (Figure 2(a)). Our findings revealed that the blood glucose levels of the db/db mice were elevated, significantly surpassing those of the wt/wt mice. Following the injection of glucose into the peritoneal cavity, the blood glucose levels of all db/db mice were elevated after 30 min. Subsequently, the blood glucose levels in the metformin and GML treatment groups decreased gradually and were significantly lower than those in the db/db group at 60 and 90 min. Additionally, the blood glucose levels of the mice in the metformin group were significantly lower than those in the db/db group at 120 min. Notably, both metformin and GML markedly decreased the AUC of the glucose tolerance test (Figure 2(b)). Similarly, after the administration of insulin, the blood glucose levels of the wt/wt mice began to decrease at 30 min, whereas the db/db mice showed a slower response and only began to decrease at 60 min (Figure 2(c)). Furthermore, the blood glucose levels in the metformin group were notably lower than those in the db/db group within 120 min. Similarly, the blood glucose levels in the GML group were also significantly lower than those in the db/db group starting from the 60th minute after intraperitoneal injection. Treatment with metformin and GML also resulted in a substantial reduction in the AUC of the insulin tolerance test (Figure 2(d)).
3.3. GML Regulated Serum Biochemical Metabolism
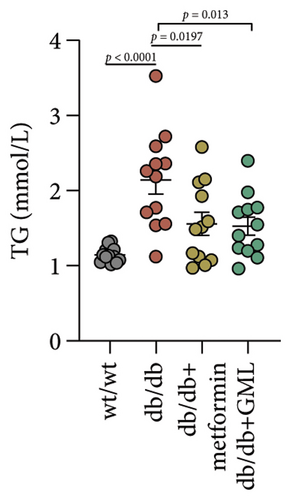
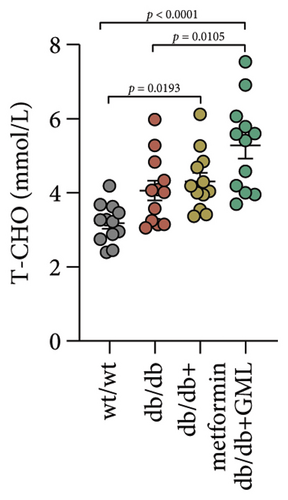
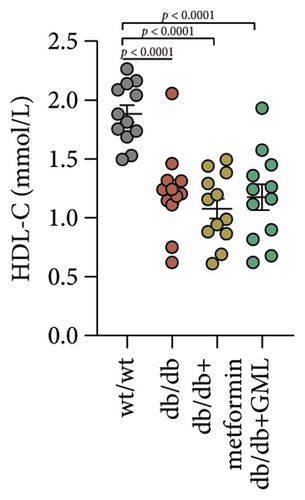
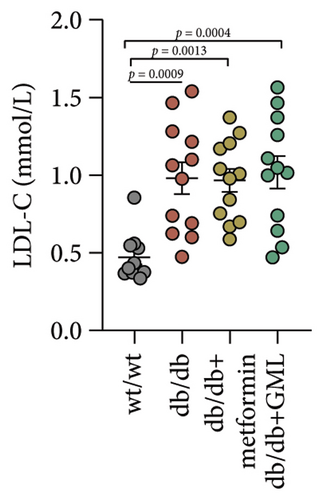
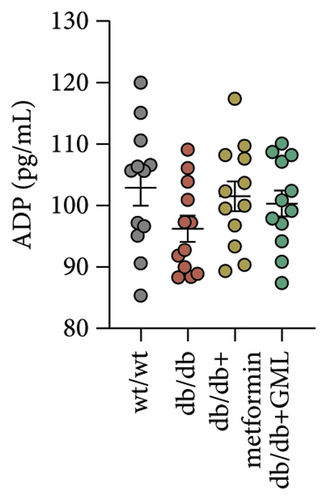
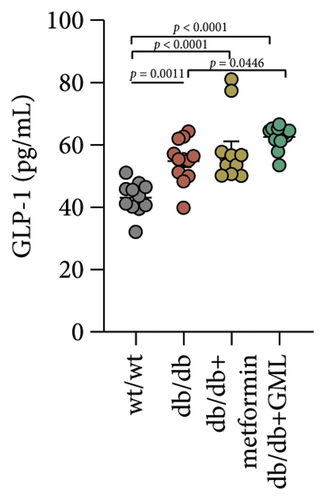
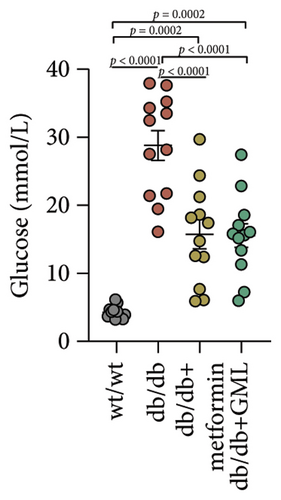
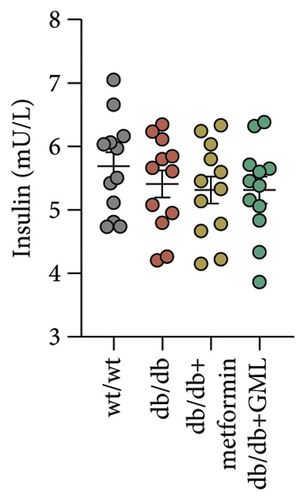
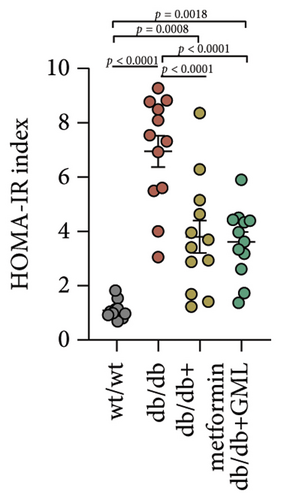
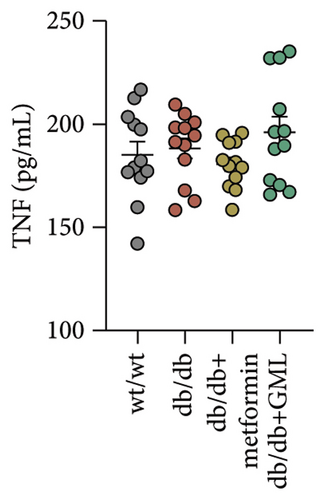
Figure 3(a) shows that TG contents in both the metformin and GML groups significantly decreased compared to those of the db/db group. The levels of T-CHO in both the metformin and GML group were significantly higher compared to those of the wt/wt group. Additionally, the GML group showed significantly higher T-CHO levels compared to those of the db/db group (Figure 3(b)). All db/db mice exhibited a significant decrease in HDL-C concentration (Figure 3(c)) and a significant increase in LDL-C concentration (Figure 3(d)) compared to those of the wt/wt mice. The levels of adiponectin, which is released by fat cells, showed no significant variation among the different groups (Figure 3(e)). Unexpectedly, the GLP-1 levels were significantly higher in the GML group than those in the db/db group (Figure 3(f)). Both metformin and GML significantly reduced the fasting serum glucose content in db/db mice (Figure 3(g)), which was consistent with the results of the daily postprandial blood glucose measurements. Although no significant difference was found in insulin levels among the different groups (Figure 3(h)), the insulin resistance index, measured by insulin and fasting serum glucose, decreased significantly in the metformin and GML groups compared to that in the db/db group (Figure 3(i)). Inflammatory factors such as IL-1β (Figure 3(j)), LPS (Figure 3(k)), and TNF (Figure 3(l)) did not differ significantly among the groups.


3.4. GML Inhibited the Proliferator-Activated Receptor-γ Coactivator-1α (PGC-1α) Signaling Pathway
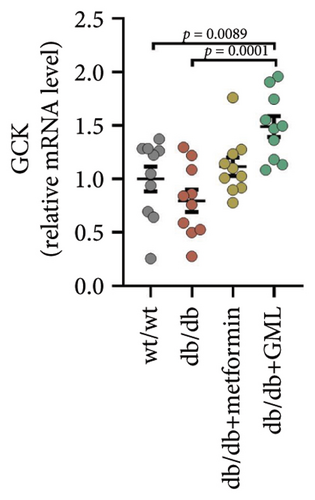
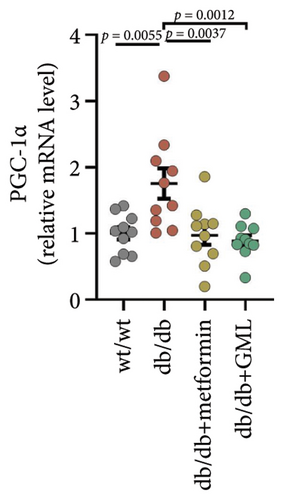
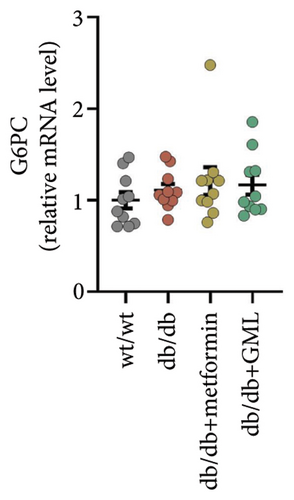
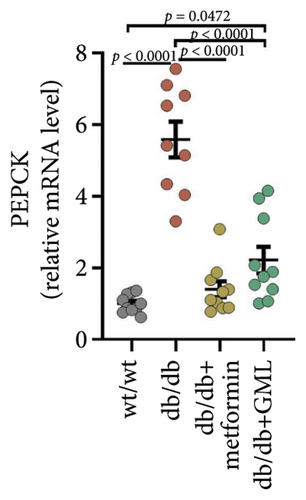
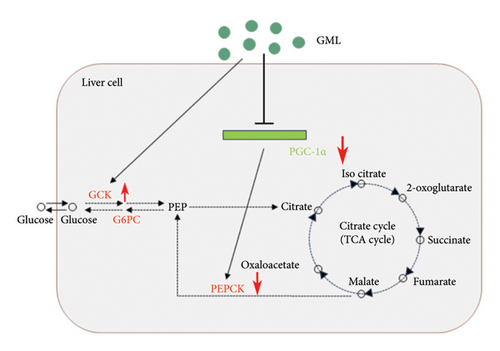
Both GML and metformin enhanced the gene expression of glucokinase (GCK) in db/db mice (Figure 4(a)), with GML showing a substantial up-regulation in GCK gene expression. Furthermore, both GML and metformin effectively suppressed the expression of peroxisome PGC-1α (Figure 4(b)) and phosphoenolpyruvate carboxy kinase (PEPCK) (Figure 4(d)). However, the gene expression level of the glucose-6-phosphatase catalytic subunit (G6PC) did not vary significantly among different groups (Figure 4(c)). Overall, GML suppressed the PGC-1α signaling pathway, which consequently inhibited the gluconeogenic pathway (Figure 4(e)).
3.5. GML Changed the Gut Microbiota in db/db Mice
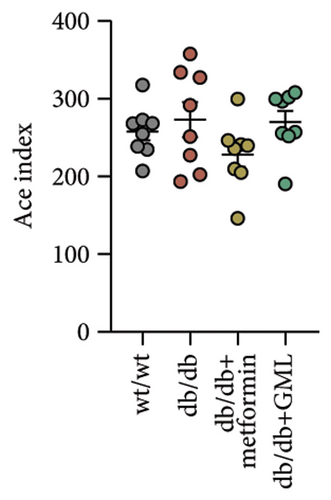
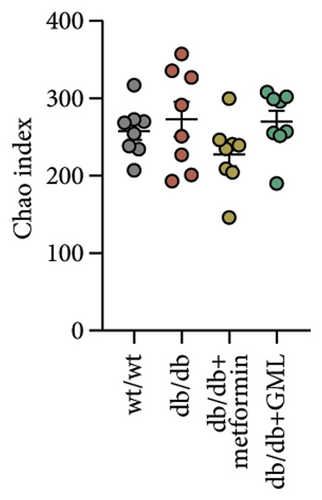
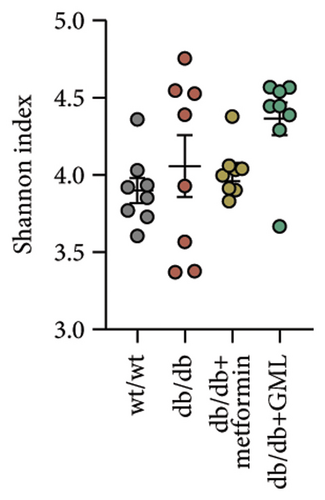
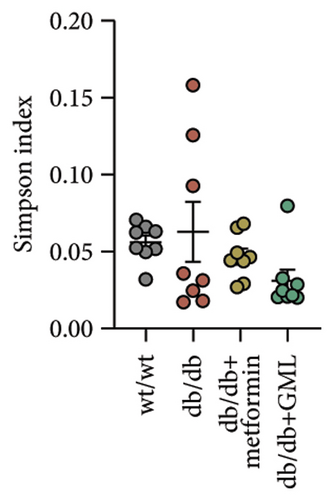
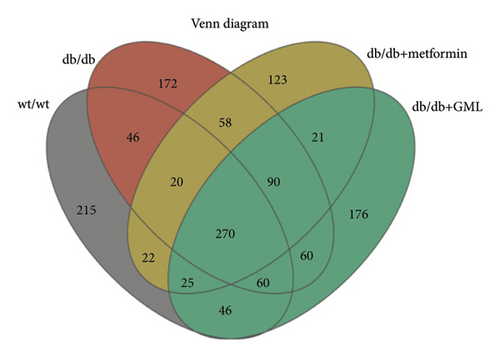
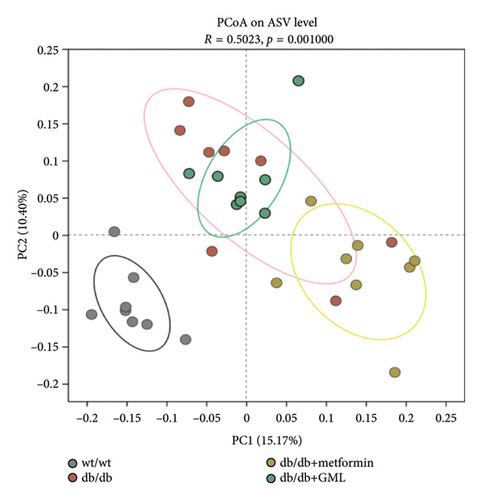
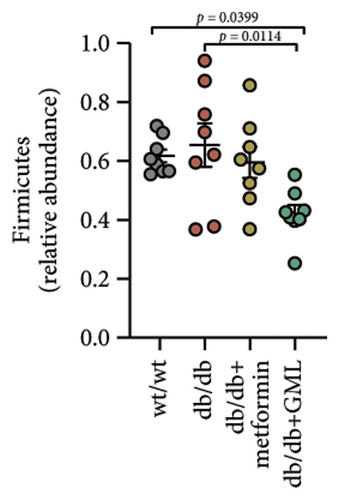
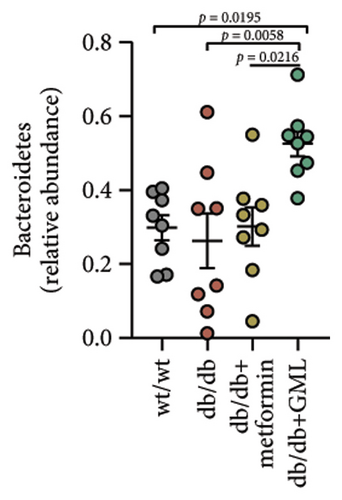
The Ace, Chao, Shannon, and Simpson (Figures 5(a), 5(b), 5(c), 5(d)) index did not show any notable disparity between the db/db mice and wt/wt mice, suggesting that α-diversity of intestinal microbiota was not significantly distinct. Venn diagrams visually depicted the similarities and overlaps among the groups in Figure 5(e). A total of 270 similar ASVs were identified in the wt/wt, db/db, metformin, and GML groups, whereas 215, 172, 123, and 176 unique ASVs were identified in those groups, respectively. The PCoA for β-diversity analysis of intestinal microbiota revealed notable disparities in the distribution of species abundance between db/db mice and wt/wt mice (Figure 5(f)). Furthermore, a noticeable separation was observed between the metformin and db/db group along the PC1 and PC2 axes. However, no significant distinction was found between the GML and db/db groups. We observed that the administration of GML significantly elevated the relative abundance of the Firmicutes phylum and reduced the relative abundance of the Bacteroidetes phylum compared to the db/db group mice (Figures 5(g), 6(b), 6(c)). Based on order-level analysis, we discovered that GML treatment elevated the abundance of Enterobacteriales and reduced the abundance of Lactobacillales when compared to other groups (Figure 5(h)).


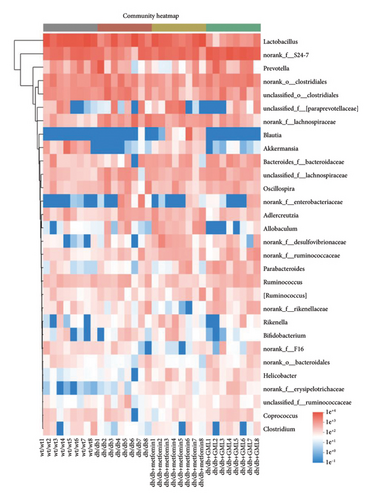
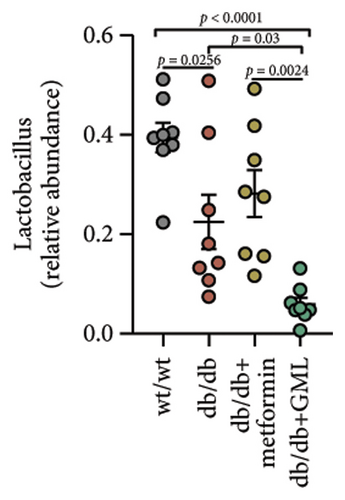
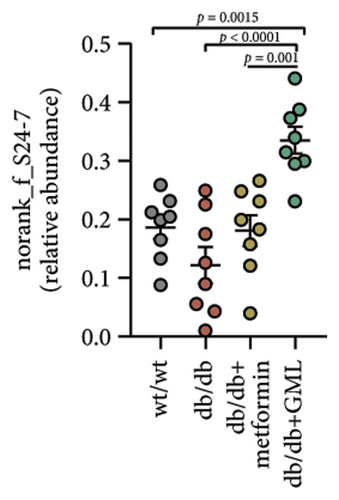
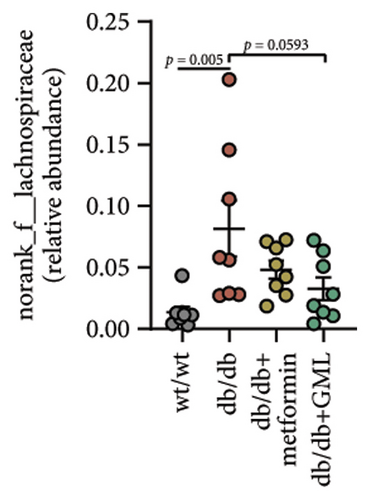

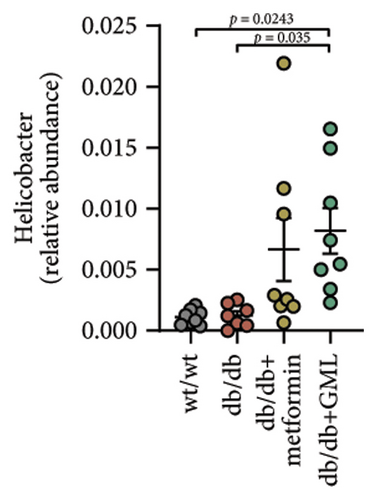
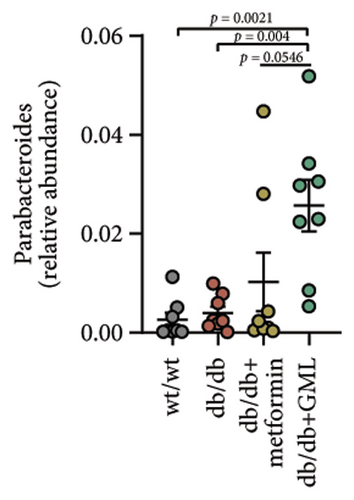
The disparity in microbial composition among each group was clearly evident at the genus level (Figure 6(a)). Compared to the wt/wt group mice, the relative abundance of Lactobacillus was reduced in all db/db mice groups, with a significant decrease in both the db/db group and the GML group (Figure 6(d)). The abundance of Lactobacillus in the GML group also showed a significant decrease when compared to the db/db group. The abundance of Akkermansia was higher in the wt/wt group mice and metformin-treated mice than in the other groups. Uniquely, GML treatment significantly elevated the abundance of norank_f_S24-7, a member of the Bacteroidetes, compared to the other groups (Figure 6(e)). Interestingly, both the GML and metformin treatment decreased the relative abundance of Lachnospiraceae compared to the db/db group (Figures 6(f), 6(g)). In addition, they both increased the relative abundance of Helicobacter (Figure 6(h)) and Parabacteroides (Figure 6(i)) in comparison to the db/db group, with a statistically significant increase in the GML group.
3.6. GML Altered the Predominant Microbiota Associated With Metabolic Indicators in db/db Mice
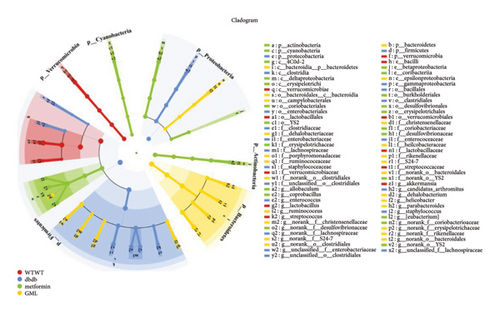
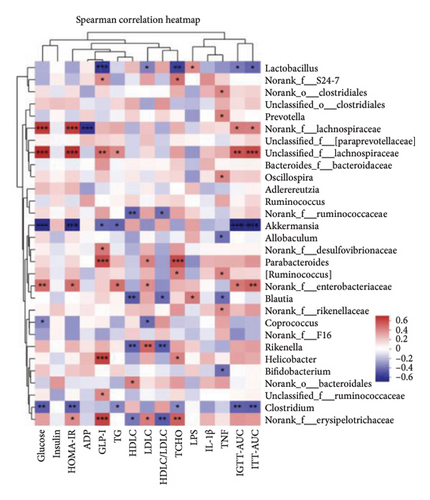
LEfSe discriminant analysis identified the dominant gut microbiota in each group (Figure 7(a)). Lactobacillus was the predominant bacteria in the wt/wt group mice, while Clostridia and Lachnospiraceae dominated the db/db control mice. Erysipelotrichales had a notable impact in the metformin-treated db/db mice. S24-7 held the predominant position in the GML group. Spearman correlation analysis revealed a robust association between gut microbiota and several metabolic markers (Figure 7(b)). Glucose, HOMA-IR, and the AUC of the intraperitoneal glucose tolerance test (IGTT) and the intraperitoneal insulin tolerance test (ITT) exhibited strong positive correlations with Lachnospiraceae and Enterobacteriaceae, while they displayed significant negative correlations with Akkermansia and Clostridium. GLP-1 was significantly positively correlated with Lachnospiraceae, Desulfovibrionaceae, Parabacteroides, and Helicobacter.
4. Discussion
In this study, gavage with GML was discovered to considerably ameliorate hyperglycemia and insulin resistance in db/db mice, with a comparable outcome of metformin. The amelioration was possibly related to the suppression of the PGC-1α signaling pathway, which hindered the gluconeogenesis and stimulated the glycolysis in the liver. Furthermore, alterations in gut microbiota and the abundance of specific species, such as Firmicutes, Bacteroidetes, and S24-7, might have facilitated the improvement.
Our previous research found that GML significantly improved hyperlipidemia, glucose homeostasis, and inflammation in mice fed a HFD [11]. The consumption of a HFD in mice can result in an abnormal elevation of blood glucose levels but not to the extent that would indicate the development of T2D [14]. The leptin receptor mutation in db/db mice hinders the leptin signaling pathway, causing obesity, insulin resistance, hyperglycemia, fatty liver, and other symptoms, which are typical in the T2D model [15]. Although our previous study indicates that incorporating GML into HFD-fed mice reduced blood glucose concentration and improved insulin resistance, the impact of GML on glucose metabolism in T2D individuals remains uncertain. Metformin exerts its therapeutic function on high blood glucose levels by suppressing hepatic glucose synthesis and enhancing glucose absorption by skeletal muscles [16]. Our present investigation demonstrated that GML effectively mitigated postprandial blood glucose and insulin resistance in T2D mice, exhibiting a comparable effect to that of metformin. In addition, both GML and metformin effectively mitigated the weight loss of diabetic mice during the later stages of feeding. Diabetic mice also exhibit polydipsia, characterized for the excessive water intake, which is mainly attributed to increased blood glucose levels and osmotic pressure. A significant decrease in water intake was observed in metformin- and GML-treated mice, supporting the effective regulation of diabetic parameters.
Diabetic mice in the fasting state exhibit hyperglycemia and severe insulin resistance, which is largely due to the enhanced gluconeogenesis and the weakened glycolysis in the mice [17, 18]. Gluconeogenesis occurs mainly in the liver, where various nonglucose substances, such as lactic acid, pyruvate, amino acids, and glycerol, are converted into glycogen or glucose. Gluconeogenesis accounts for about half of the total liver glucose production after overnight fasting and is the primary cause of elevated fasting blood glucose levels in T2D [19]. Gluconeogenesis requires PEPCK, fructose-1, 6-diphosphatase, and glucose-6-phosphatase (G6Pase) to bypass the irreversible glycolytic reaction. PEPCK and G6Pase are considered key control points of the gluconeogenic pathway [20]. During gluconeogenesis, PEPCK converts oxaloacetic acid into phosphoenolpyruvate and carbon dioxide. Several investigations have demonstrated that gene expression of PEPCK is upregulated in patients with hyperglycemia or diabetes, inhibiting the PEPCK expression results in impaired gluconeogenesis, decreased glucose synthesis, and improved blood glucose levels [21–23]. G6Pase, encoded by G6PC, plays a critical role in liver glucose generation. Inhibition of G6PC has also been shown to be a key strategy for curbing gluconeogenesis and controlling blood glucose [24, 25]. In our current study, both GML and metformin significantly inhibited PEPCK expression in db/db mice but showed no significant effect on G6PC expression. The suppression of the PEPCK gene in GML group mice is possibly attributed to the decreased level of PGC-1α transcription in our study [26]. PGC-1α shows strong activation on the transcriptional programs required for liver gluconeogenesis, particularly the key gluconeogenic enzyme PEPCK [27, 28]. It was found that cAMP response element-binding protein (CREB) induces the activation of the gluconeogenic program via the nuclear receptor coactivator PGC-1 [29]. CREB activates PGC-1 in the liver, which plays a key role in the development of T2D [30]. GCK is the rate-limiting enzyme during glycolysis for regulating blood glucose concentration [31]. Here, our research discovered that GML upregulated the expression of GCK in the liver, which would accelerate the uptake and utilization of serum glucose by db/db mice. In conclusion, GML suppressed the PGC-1α signaling and the gluconeogenic pathway and also enhanced the expression of the GCK in the glycolysis pathway, leading to improved blood glucose levels and insulin resistance in the diabetic mice.
Many studies have indicated that alterations in gut microbes are tightly related to the occurrence and pathogenesis of diabetes [32]. Studies have showed that T2D patients possess more abundant Firmicutes and less abundant Bacteroidetes in feces than healthy individuals [33]. Upregulation of Bacteroidetes significantly modulated glucose intolerance induced by a HFD [34]. Here, our study demonstrated that GML significantly reduced the abundance of Firmicutes and increased the abundance of Bacteroidetes in diabetic mice, which might be related to the reduction of blood glucose levels and the improvement of glucose tolerance.
Previous studies have confirmed that glucose metabolism disorders are associated with decreased abundance of S24-7 [35, 36]. Li et al. found that tempol preferentially reduced Lactobacillus abundance and bile salt hydrolase activity and prevented obesity and insulin resistance in mice [37]. Anhe et al. also discovered that mice treated with Camu-camu showed improved glucose tolerance and insulin sensitivity, accompanied by a large reduction in Lactobacillus abundance [38]. The Lactobacillus genus has been reported to regulate the expression of PEPCK and PGC-1α and ameliorate HFD-induced glucose metabolism disorder in mice [39]. The Lactobacillus genus has also been implicated in activating the AMPK/PGC-1α signaling pathway and the Nrf2/PGC-1α pathway [40]. In our study, GML dramatically reduced the abundance of Lactobacillus and elevated the abundance of S24-7 in diabetic mice, which might be the key microbial marker for improving blood glucose and insulin resistance due to the inhibition of PGC-1α and the regulation of glucose metabolism. In several studies, elevated Lachnospiraceae abundance has been found to be associated with hyperglycemia [41, 42]. Our current study found that the abundance of Lachnospiraceae in the db/db group was significantly higher than that in the wt/wt group, and it was significantly reduced by both GML and metformin treatment. LEfSe analysis showed that Lachnospiraceae was the dominant bacterium in the db/db group and played a dominant role in intestinal microbial changes. Consistently, correlation analysis displayed that Lachnospiraceae was significantly positively correlated with blood glucose, insulin resistance, and the AUC of IGTT and ITT. Helicobacter species may cause disease when they accumulate much in the body. In our study, GML and metformin were found to increase the abundance of Helicobacter and Parabacteroides in the db/db mice. Some studies have showed that increased Helicobacter abundance is associated with lower blood sugar concentrations [43]. Parabacteroides distasonis has also been revealed to have benefits in reducing weight gain and hyperglycemia in ob/ob mice and HFD-fed mice [44]. In a previous study, GML treatment improved gut microbiota dysbiosis in HFD-induced obese mice and significantly increased the abundance of the Bifidobacterium genus [11]. However, GML showed a decreasing effect on the Bifidobacterium genus in the gut microbiota of db/db mice. In addition, the α-diversity of intestinal microbiota was not significantly influenced by GML treatment in the current study. The differences between the gut microbiota in this study and those in previous studies might mainly be related to the different animal models, diets, feeding time, and other factors. Overall, both GML and metformin affected the gut microbe composition, and these alterations might partially account for the improvement of blood glucose levels and insulin resistance in the mice.
5. Conclusion
In summary, this study discovered that GML reduced blood glucose and insulin resistance and improved glucose homeostasis in db/db mice, possibly by inhibiting the PGC-1α signaling pathway. Meanwhile, changes in gut microbiota induced by GML treatment may also be associated with the amelioration of glucose dyshomeostasis. The study provides a new insight on food-derived substances for improving glucose metabolism disorders.
Conflicts of Interest
The authors declare no conflicts of interest.
Funding
This work was supported by the National Natural Science Foundation of China (32172214, 32001693, and 31972079) and the National Key R&D Program of China (2023YFF1104003).
Acknowledgments
This work was supported by the National Natural Science Foundation of China (32172214, 32001693, and 31972079) and the National Key R&D Program of China (2023YFF1104003).
Supporting Information
Supporting Table 1: Primer sequences used for qRT-PCR analysis.
Open Research
Data Availability Statement
The data used to support the findings of this study are available from the corresponding author upon request.


