Effect of Storage Conditions on Phytochemical Quality and Free Radical Scavenging Potential of Nelumbo nucifera Rhizome
Abstract
The current investigation optimized the impact of storage conditions on the phytochemical quality and free radical scavenging potential of Nelumbo nucifera rhizome using a response surface methodology. A bifactorial central composite design (CCD) was constructed at five levels of each of the storage temperatures (ST: −80, −20, 0, 5, and 10°C) and storage time (St: 1, 2, 3, 4, and 5 weeks) consisting of 29 experimental runs with four factorial and four axial points in triplicate and five center points. The rhizome samples were stored at various combinations of ST and St as selected by CCD. The fresh and stored samples were processed to analyze their phytochemical composition and free radical scavenging potential. The stored rhizome samples showed comparatively lower values (p < 0.05) of phytochemical constituents and free radical scavenging potential than the fresh ones. The response surface optimization showed that the samples’ phytochemical content and free radical scavenging potential changed as a linear positive function of ST and a linear negative function of St. A linear positive effect of ST and a linear negative effect of St were observed on the total phenolic content, total flavonoid content, and tannin content, as well as 2, 2-diphenyl-1-picrylhydrazyl, hydroxyl, azino-bis-tetrazolium sulfate cation, and superoxide radical scavenging capacities of N. nucifera rhizome. The optimum levels of ST and St for optimal response of the studied parameters were found to be 8.48°C and 2.0313 weeks, respectively. The study suggests avoiding long-term storage of plant-based foods at very low temperatures to preserve their phytochemical and antioxidant quality.
1. Introduction
Storage at low temperatures is a method used for food preservation that best preserves the taste, smell, general quality, and nutritional content of foods [1]. The foods have been stored at low temperatures for ages to secure the quality of the resulting product [2]. The storage of food at low temperatures considerably slows down microbiological growth, biochemical reactions, and color and texture deterioration. It also prevents nutrients from being lost and the formation of an off-flavor during storage [3]. One of the critical characteristics influencing the microstructure of the frozen product is ice crystal, which is directly proportional to the freezing rate. Slow freezing causes the production of huge ice crystals, which irreversibly destroy the tissues. A fast freezing results in little ice crystals contribute to the structural quality of the food [4]. Despite its ease, freeze storage methods still have many drawbacks, such as high drip loss, severe shrinkage, diminished nutrients, and color changes [5]. The intensity of the adverse effects of the freezing process on foods relies on the nature of foods as different food materials respond differently to the freezing process [6].
Nelumbo nucifera G, commonly known as lotus, is a perennial aquatic plant belonging to the aquatic genus Nelumbo. It is a good source of carbohydrates, fiber, vitamin C, and minerals such as Ca, P, Fe, and K. All the sections of the N. nucifera and its active ingredients have been employed as a “homology of medicine and food,” serving as both tasty food and potent empirical medicine. [7]. N. nucifera rhizome possesses several phytochemical antioxidants that scavenge reactive oxygen species and break the chain reaction of free radicals [8–10]. At normal temperature, the shelf life of lotus rhizome is around 14–20 days, which may be extended by storage at low temperature. Freeze storage is a preservation technology extensively employed in the food industry to extend the shelf life of lotus roots [11].
The researchers are expressing interest in modifying food material to make it more significant in the industrial and nutritional domains, particularly N. nucifera rhizome starch (NNRS), which was previously modified by acetylation, crosslinking, and oxidation [12]. However, scant information was discovered regarding the impact of storage conditions on NNRS’s phytochemical and antioxidant capacity. Therefore, response surface methodology (RSM) was used to optimize the impact of storage conditions on the phytochemical and antioxidant capacity of NNRS at various storage temperatures and times.
RSM is used to create response surface models to predict changes in response variables with changes in input variables [13]. RSM is also used to get the optimum levels of input variables leading to the desired goals of response variables [14]. In this methodology, the central composite design (CCD) has been used to optimize independent variables and develop a second-order quadratic model for response variables by reducing the number of experimental runs.
2. Materials and Methods
The fresh N. nucifera rhizomes were purchased from the local market, washed in distilled water, cut into small pieces, weighed, packed in airtight polythene bags, and stored under various conditions.
2.1. Experimental Design
| Fresh rhizome | Stored rhizome | BHT | p value | |
|---|---|---|---|---|
| TDM (%) | 10.33 ± 0.58 | 6.71 ± 0.33 | < 0.001 | |
| TEY (%) | 37.03 ± 0.35 | 12.35 ± 0.78 | < 0.001 | |
| TPC (mg/100 g dw) | 21.31 ± 2.03 | 11.71 ± 0.19 | < 0.001 | |
| TFC (mg/100 g dw) | 20.70 ± 1.17 | 14.05 ± 0.72 | < 0.001 | |
| TTC (mg/100 g dw) | 22.77 ± 2.38 | 9.91 ± 0.39 | < 0.001 | |
| ETC (mg/100 g dw) | 19.23 ± 1.75 | 8.20 ± 0.37 | < 0.001 | |
| GTC (mg/100 g dw) | 20.89 ± 1.99 | 10.41 ± 1.63 | < 0.001 | |
| CTC (mg/100 g dw) | 21.99 ± 2.035 | 11.66 ± 1.40 | < 0.001 | |
| DPPH RSC (%) | 94.07 ± 2.40 | 63.40 ± 4.43 | 95.37 ± 5.77 | < 0.001 |
| ABTS RSC (%) | 79.63 ± 2.69 | 53.92 ± 1.18 | 80.36 ± 3.33 | < 0.001 |
| HRSC (%) | 97.24 ± 3.09 | 74.56 ± 0.67 | 98.89 ± 4.98 | < 0.001 |
| SORSC (%) | 97.58 ± 2.14 | 71.82 ± 1.01 | 96.47 ± 2.04 | < 0.001 |
- Abbreviations: ABTS RSC, azino-bis (tetrazolium sulfate) radical scavenging capacity; BHT, butylated hydroxytoluene; CTC, condensed tannin content; DPPH RSC, 2, 2-diphenyl-1-picrylhydrazyl radical scavenging capacity; dw, dry weight; ETC, ellagitannin content; GTC, gallotannin content; HRSC, hydroxyl radical scavenging capacity; SORSC, superoxide radical scavenging capacity; TFC, total flavonoid; TPC, total phenolic content; TTC, total tannin content.
The fresh rhizomes (100 g) were stored at selected combinations of ST and St and removed after respective St. Both the fresh and stored rhizomes were dried in the air and ground to a fine powder. The hydroalcoholic extracts of rhizome powder were obtained and processed to analyze phytochemical composition and antioxidant potential in terms of free radical scavenging capacity.
2.2. Determination of Total Dry Mass (TDM)
2.3. Preparation of Extracts
The dried extract (0.1 g) was dissolved in methanol (100 mL) and used for phytochemical and antioxidant analyses.
2.4. Phytochemical Analysis
The total phenolic content (TPC) of the hydroalcoholic extracts of the fresh and stored rhizomes obtained at selected combinations of ST and St was determined by the Folin–Ciocalteu method [15], and the TPC was calculated as gallic acid eqv. from the standard curve of gallic acid (R2 = 0.9847). The total flavonoid content (TFC) was estimated by the aluminum chloride method as described in the literature [16], and the TPC was calculated as catechin eqv. from a standard curve of catechin (R2 = 0.9872). The total tannin content (TTC) and condensed tannin content (CTC) were determined as tannic acid eqv. using the vanillin–hydrochloric acid assay [17]. The ellagitannin content (EGC) and gallotannin content (GTC) were determined as tannic acid eqv. using the method reported in the literature [18, 19].
2.5. Free Radical Scavenging Potential
The free radical scavenging potential of the hydroalcoholic extracts of the fresh and stored rhizome was assessed in terms of 2, 2-diphenyl-1-picrylhydrazyl radical scavenging capacity (DPPH RSC), azino-bis (tetrazolium sulfate) radical scavenging capacity (ABTS RSC), hydroxyl radical scavenging capacity (HRSC), and superoxide radical scavenging capacity (SORSC) following the previously described methods [20, 21]. Butylated hydroxytoluene (BHT) was used as a standard antioxidant for comparison.
2.6. Statistical Analysis
The results for the phytochemical and antioxidant activity of fresh and stored rhizomes were expressed as mean ± standard deviation of three parallel replicates. The data were statistically analyzed by one-way analysis of variance (ANOVA) using statistical software (SPSS, version 19), and the means were separated by applying Tukey’s multiple range tests at a confidence level of p ≤ 0.05. The RSM was used to study the effect of freezing temperature and duration on the phytochemical and antioxidant activity of the lotus rhizome. Response surface models were created to predict changes in the phytochemical and antioxidant activity of lotus rhizome as a function of preparation conditions and to optimize independent variables to achieve the desired values of response variables. The nonsignificant terms were dropped in the initial mode, and the experimental data were fitted again only to the significant parameters to obtain the final reduced model. However, the final reduced model included the nonsignificant linear terms if the quadratic or interaction terms containing these variables were found significant.
The significance of the estimated regression coefficient for each response variable was assessed by the lack of fit test (F ratio) at a probability (p) of 0.05. The lack of fit measures the degree of failure of a model to fit the data in the experimental domain, particularly for reduced points in a randomized experiment. A nonsignificant value of lack of fit indicates the adequacy of the model in describing the response variable. The corresponding variables in large F values and smaller p values indicate more significant results. The reduced model contained only those terms that were found statistically significant (p = 0.05). The adequacy of the response surface model was found by the analysis of the coefficient of determination (R2). The adjusted coefficient of determination () was measured to determine the fairness of fit of the regression equation. The coefficient of variation (CV) was determined to check the precision and reliability of the experiments. A low CV value means that the experiments are more precise and reliable.
For graphical optimization, three-dimensional plots were formed between response and independent variables. The adequacy of response surface models was verified by comparing the experimental values to those predicted by the final reduced models. The experimental design, data analysis, and optimization procedure were developed using the statistical software Design-Expert 8.0.4.1 (Stat-Ease, Inc.).
3. Results
The results of dry mass, extract yield, phytochemical composition, and free radical scavenging potential of the fresh and stored rhizome are given in Table 1. The TDM and TEY of fresh rhizomes were found to be 10.33 ± 0.58 and 37.03 ± 0.35%, respectively. The TPC and TFC of fresh rhizome were 21.31 ± 2.03 mg gallic acid eqv./100 g dw and 20.70 ± 1.17 mg catechin eqv./100 g dw, respectively. The TTC, ETC, GTC, and CTC were found to be 22.77 ± 2.38, 19.23 ± 1.75, 20.89 ± 1.99, and 21.99 ± 2.035 mg tannic acid eqv./100 g dw, respectively. The DPPH RSC, ABTS RSC, HRSC, and SORSC of fresh rhizome samples were found to be 94.07 ± 2.40, 79.63 ± 2.69, 97.24 ± 3.09, and 97.58 ± 2.14%, respectively, while those of BHT were 95.37 ± 5.77, 80.36 ± 3.33, 98.89 ± 4.98, and 96.47 ± 2.04%, respectively. The freezing treatment resulted in a significant decrease in TDM, TEY, TPC, TFC, TTC, ETC, GTC, and CTC to 6.71 ± 0.33 (%), 12.35 ± 0.78 (%), and 11.71 ± 0.19 mg gallic acid eqv./100 g dw, 14.05 ± 0.72 mg catechin eqv./100 g dw, 9.91 ± 0.39 mg tannic acid eqv./100 g dw, 8.20 ± 0.37 mg tannic acid eqv./100 g dw, 10.41 ± 1.63 mg tannic acid eqv./100 g dw, and 11.66 ± 1.40 mg tannic acid eqv./100 g dw, respectively. The DPPH RSC, ABTS RSC, HRSA, and SORSC also decreased significantly to 63.40 ± 4.43, 53.92 ± 1.18, 74.56 ± 0.67, and 71.82 ± 1.01%, respectively, under the influence of freeze treatment.
The effects of freezing conditions on dry mass, extract yield, phytochemical composition, and antioxidant potential were optimized by the RSM using a five-level bifactorial CCD. The experimental results of dry mass, extract yield, phytochemical composition, and antioxidant potential of stored rhizome samples at various combinations of ST and St are given in Table 2. The TDM and TEY ranged from 5.30% to 8.20% and 5.75% to 22.02% with mean ± standard deviation of 6.71 ± 0.33 (%) and 12.35 ± 0.78 (%), respectively. The TPC and TFC ranged from 8.4 to 14.8 and 8.266 to 16.854 mg/100 g dw with mean ± standard deviation of 11.71 ± 0.19 and 14.05 ± 0.72 mg/100 g dw, respectively. The TTC, ETC, GTC, and CTC ranged from 7.001 to 13.135, 5.8 to 10.49, 5.9 to 14.5, and 8.2 to 15.3 mg/100 g dw with mean ± standard deviation of 9.91 ± 0.39, 8.20 ± 0.37, 10.41 ± 1.63, and 11.66 ± 1.40 mg/100 g dw, respectively. The DPPH RSC, ABTS RSC, HRSC, and SORSC ranged from 50.87% to 79.117%, 38% to 64.4%, 65.9% to 84.1%, and 63.28% to 81.54% with mean ± standard deviation of 63.40 ± 4.43, 53.92 ± 1.18, 74.56 ± 0.67, and 71.82 ± 1.01%, respectively.
| Run | Coded levels of variables | Actual levels of variables | Phytochemical composition (mg/100 g dw) | Free radical scavenging potential (%) | ||||||||||||
|---|---|---|---|---|---|---|---|---|---|---|---|---|---|---|---|---|
| X1 | X2 | ST (°C) | St (week) | TDM | TEY | TPC | TFC | TTC | ETC | GTC | CTC | DPPH RSC | ABTS RSC | HRSC | SORSC | |
| 1 | 0 | 0 | 0 | 3 | 6.50 | 10.42 | 11.60 | 16.85 | 8.63 | 6.99 | 5.96 | 8.29 | 50.87 | 58.88 | 72.04 | 69.61 |
| 2 | 2 | 0 | 10 | 3 | 8.10 | 18.28 | 14.43 | 16.40 | 13.43 | 10.49 | 14.51 | 15.34 | 72.73 | 63.01 | 84.11 | 78.94 |
| 3 | −1 | 1 | −20 | 4 | 5.40 | 6.44 | 8.72 | 10.57 | 7.30 | 5.83 | 8.70 | 9.26 | 54.55 | 44.31 | 65.91 | 65.04 |
| 4 | 0 | 0 | 0 | 3 | 6.86 | 10.63 | 11.70 | 16.85 | 8.63 | 6.99 | 5.96 | 8.29 | 50.87 | 58.88 | 72.04 | 69.61 |
| 5 | −2 | 0 | −80 | 3 | 5.60 | 6.92 | 9.30 | 11.38 | 7.30 | 6.70 | 9.57 | 9.26 | 55.27 | 42.64 | 67.42 | 65.15 |
| 6 | 0 | −2 | 0 | 1 | 8.10 | 21.88 | 14.82 | 16.67 | 13.14 | 10.49 | 14.22 | 15.05 | 79.12 | 63.35 | 83.68 | 81.85 |
| 7 | −2 | 0 | −80 | 3 | 5.73 | 7.26 | 9.30 | 11.38 | 7.30 | 6.70 | 9.57 | 9.26 | 55.27 | 42.64 | 67.42 | 64.52 |
| 8 | 1 | −1 | 5 | 2 | 7.67 | 18.83 | 14.53 | 16.40 | 13.14 | 10.49 | 14.22 | 15.34 | 76.09 | 64.43 | 83.95 | 79.77 |
| 9 | 2 | 0 | 10 | 3 | 8.20 | 19.95 | 14.53 | 16.40 | 13.43 | 10.49 | 14.51 | 15.34 | 77.60 | 63.01 | 84.11 | 80.39 |
| 10 | 0 | 2 | 0 | 5 | 5.60 | 7.04 | 8.43 | 8.27 | 7.01 | 6.41 | 6.23 | 8.39 | 52.17 | 38.06 | 66.44 | 63.28 |
| 11 | 2 | 0 | 10 | 3 | 8.00 | 16.61 | 14.53 | 16.40 | 13.43 | 10.49 | 14.51 | 15.34 | 77.60 | 63.01 | 84.11 | 80.81 |
| 12 | −1 | −1 | −20 | 2 | 6.60 | 11.87 | 11.63 | 14.50 | 9.92 | 8.45 | 11.60 | 13.31 | 68.71 | 53.06 | 75.47 | 70.45 |
| 13 | −1 | 1 | −20 | 4 | 5.50 | 7.13 | 8.72 | 10.57 | 7.30 | 5.83 | 8.70 | 10.71 | 55.27 | 44.31 | 65.91 | 63.52 |
| 14 | 1 | −1 | 5 | 2 | 8.25 | 20.44 | 14.53 | 16.40 | 13.14 | 10.49 | 14.22 | 15.34 | 76.09 | 64.43 | 83.95 | 81.54 |
| 15 | 1 | 1 | 5 | 4 | 7.20 | 10.83 | 11.92 | 13.04 | 10.22 | 8.74 | 11.60 | 12.44 | 65.68 | 54.17 | 73.75 | 68.98 |
| 16 | 0 | 0 | 0 | 3 | 6.14 | 10.21 | 11.50 | 16.85 | 8.63 | 6.99 | 5.96 | 8.29 | 50.87 | 58.88 | 72.04 | 69.61 |
| 17 | 0 | −2 | 0 | 1 | 8.20 | 22.02 | 14.82 | 16.67 | 13.14 | 10.49 | 14.22 | 15.05 | 79.12 | 63.35 | 83.68 | 82.99 |
| 18 | −1 | −1 | −20 | 2 | 7.04 | 12.00 | 11.63 | 14.50 | 9.92 | 8.45 | 11.60 | 13.31 | 68.71 | 53.06 | 75.47 | 71.37 |
| 19 | 0 | 2 | 0 | 5 | 5.80 | 7.21 | 8.43 | 8.27 | 7.01 | 6.41 | 6.23 | 8.39 | 52.17 | 38.06 | 66.44 | 64.83 |
| 20 | 1 | 1 | 5 | 4 | 7.40 | 11.26 | 11.92 | 13.82 | 10.22 | 8.74 | 11.60 | 12.44 | 65.68 | 54.27 | 73.75 | 72.61 |
| 21 | −2 | 0 | −80 | 3 | 4.87 | 6.70 | 9.30 | 11.38 | 7.30 | 6.70 | 9.57 | 9.26 | 55.27 | 42.64 | 67.42 | 65.25 |
| 22 | −1 | 1 | −20 | 4 | 5.30 | 5.75 | 8.72 | 10.57 | 7.30 | 5.83 | 8.70 | 9.25 | 55.27 | 44.31 | 65.91 | 64.21 |
| 23 | 0 | 0 | 0 | 3 | 6.14 | 10.63 | 11.75 | 16.85 | 8.63 | 6.99 | 5.96 | 8.29 | 50.87 | 58.88 | 72.04 | 69.61 |
| 24 | −1 | −1 | −20 | 2 | 6.16 | 11.56 | 11.63 | 14.50 | 9.92 | 8.45 | 11.60 | 13.31 | 68.71 | 53.06 | 75.47 | 72.61 |
| 25 | 0 | 2 | 0 | 5 | 5.40 | 6.87 | 8.43 | 8.27 | 7.41 | 6.41 | 6.23 | 8.39 | 52.17 | 38.06 | 66.44 | 65.46 |
| 26 | 0 | −2 | 0 | 1 | 8.00 | 21.74 | 14.82 | 16.67 | 13.14 | 10.49 | 14.22 | 15.05 | 79.12 | 63.35 | 83.68 | 80.39 |
| 27 | 1 | 1 | 5 | 4 | 7.00 | 10.40 | 11.92 | 13.82 | 10.22 | 8.74 | 11.60 | 12.44 | 65.68 | 54.27 | 73.75 | 71.47 |
| 28 | 0 | 0 | 0 | 3 | 6.86 | 10.21 | 11.65 | 16.85 | 8.63 | 6.99 | 5.96 | 8.29 | 50.87 | 58.88 | 72.04 | 69.61 |
| 29 | 1 | −1 | 5 | 2 | 7.09 | 17.20 | 14.53 | 16.40 | 13.14 | 10.49 | 14.22 | 15.34 | 76.09 | 64.43 | 83.95 | 79.46 |
| Mean + SD | 6.71 ± 0.33 | 12.35 ± 0.78 | 11.71 ± 0.19 | 14.05 ± 0.72 | 9.91 ± 0.39 | 8.20 ± 0.37 | 10.41 ± 1.63 | 11.66 ± 1.40 | 63.40 ± 4.43 | 53.92 ± 1.18 | 74.56 ± 0.67 | 71.82 ± 1.01 | ||||
- Note: ST, storage temperature; St, storage time.
- Abbreviations: ABTS RSC, azino-bis (tetrazolium sulfate) radical scavenging capacity; CTC, condensed tannin content; DPPH RSC, 2, 2-diphenyl-1-picrylhydrazyl radical scavenging capacity; dw, dry weight; ETC, ellagitannin content; GTC, gallotannin content; HRSC, hydroxyl radical scavenging capacity; SORSC, superoxide radical scavenging capacity; TFC, total flavonoid; TPC, total phenolic content; TTC, total tannin content.
3.1. Response Surface Analysis and Optimization of Results
| Source | TDM (%) | TEY (%) | TPC (g/100 g dw) | TFC (g/100 g dw) | ||||||||
|---|---|---|---|---|---|---|---|---|---|---|---|---|
| CE | F value | p value | CE | F value | p value | CE | F value | p value | CE | F value | p value | |
| Model | 6.54 | 50.87 | < 0.0001 | 10.42 | 268.95 | < 0.0001 | 11.64 | 841.48 | < 0.0001 | 16.04 | 91.91 | < 0.0001 |
| A—storage temperature (°C) | 0.69 | 150.29 | < 0.0001 | 2.84 | 483.69 | < 0.0001 | 1.37 | 1881.12 | < 0.0001 | 1.24 | 106.24 | < 0.0001 |
| B—storage time (week) | −0.56 | 97.76 | < 0.0001 | −3.58 | 773.24 | < 0.0001 | −1.53 | 2316.68 | < 0.0001 | −1.96 | 265.17 | < 0.0001 |
| AB | 0.18 | 3.51 | 0.07 | −0.66 | 8.61 | < 0.0001 | 0.07 | 1.76 | 0.1982 | 0.27 | 1.72 | 0.2030 |
| A2 | 0.06 | 1.28 | 0.27 | 0.55 | 23.48 | < 0.0001 | 0.07 | 5.43 | 0.0289 | −0.62 | 34.32 | < 0.0001 |
| B2 | 0.08 | 2.68 | 0.11 | 1.01 | 79.13 | < 0.0001 | −0.003 | 0.02 | 0.9003 | −0.98 | 84.77 | < 0.0001 |
| R2 | 0.92 | 0.98 | 0.9946 | 0.9523 | ||||||||
| Adjusted R2 | 0.90 | 0.98 | 0.9934 | 0.9420 | ||||||||
| Predicted R2 | 0.87 | 0.97 | 0.9913 | 0.9287 | ||||||||
| AP (%) | 18.85 | 43.81 | 70.5448 | 27.8665 | ||||||||
| CV (%) | 5.02 | 6.26 | 1.62 | 5.15 | ||||||||
- Note: R2, regression coefficient.
- Abbreviations: AP, adequate precision; TFC, total flavonoid; TPC, total phenolic content.
| Source | TTC (mg/100 g dw) | ETC (mg/100 g dw) | GTC (mg/100 g dw) | CTC (mg/100 g dw) | ||||||||
|---|---|---|---|---|---|---|---|---|---|---|---|---|
| CE | F value | p value | CE | F value | p value | CE | F value | p value | CE | F value | p value | |
| Model | 9.10 | 222.86 | < 0.0001 | 7.39 | 122.70 | < 0.0001 | 7.90 | 18.62 | < 0.0001 | 9.95 | 20.45 | < 0.0001 |
| A—storage temperature (°C) | 1.53 | 551.85 | < 0.0001 | 1.04 | 281.44 | < 0.0001 | 1.28 | 22.28 | < 0.0001 | 1.41 | 36.55 | < 0.0001 |
| B—storage time (week) | −1.48 | 517.36 | < 0.0001 | −1.04 | 281.44 | < 0.0001 | −1.79 | 43.49 | < 0.0001 | −1.65 | 50.14 | < 0.0001 |
| AB | −0.0730 | 0.4174 | 0.5246 | 0.2181 | 4.09 | 0.0549 | 0.0725 | 0.0238 | 0.8788 | 0.1693 | 0.1763 | 0.6785 |
| A2 | 0.3645 | 40.26 | < 0.0001 | 0.3423 | 39.00 | < 0.0001 | 1.24 | 26.78 | < 0.0001 | 0.7609 | 13.79 | 0.0011 |
| B2 | 0.2915 | 25.75 | < 0.0001 | 0.3057 | 31.10 | < 0.0001 | 0.7827 | 10.73 | 0.0033 | 0.6162 | 9.04 | 0.0063 |
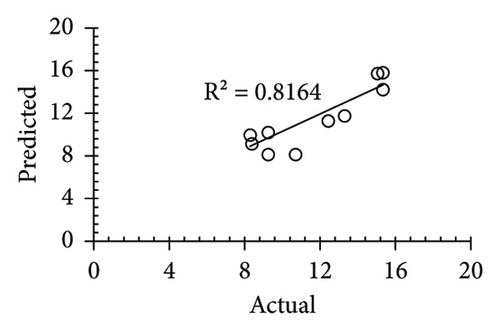
| R2 | 0.9798 | 0.9639 | 0.8019 | 0.8164 | ||||||||
| Adjusted R2 | 0.9754 | 0.9560 | 0.7588 | 0.7765 | ||||||||
| Predicted R2 | 0.9699 | 0.9454 | 0.7049 | 0.7273 | ||||||||
| AP | 38.2515 | 30.1170 | 11.6557 | 12.130 | ||||||||
| CV | 0.9798 | 4.56 | 15.65 | 11.98 | ||||||||
- Note: R2, regression coefficient.
- Abbreviations: AP, adequate precision; CTC, condensed tannin content; ETC, ellagitannin content; GTC, gallotannin content; TTC, total tannin content.
| DPPH RSC (%) | ABTS RSC (%) | HRSC (%) | SORSC (%) | |||||||||
|---|---|---|---|---|---|---|---|---|---|---|---|---|
| CE | F value | p value | CE | F value | p value | CE | F value | p value | CE | F value | p value | |
| Model | 56.14 | 29.87 | < 0.0001 | 58.03 | 340.51 | < 0.0001 | 72.71 | 621.25 | < 0.0001 | 69.96 | 238.01 | < 0.0001 |
| A—storage temperature (°C) | 4.95 | 44.96 | < 0.0001 | 5.17 | 696.41 | < 0.0001 | 4.14 | 1381.81 | < 0.0001 | 3.81 | 513.94 | < 0.0001 |
| B—storage time (week) | −6.5 | 77.35 | < 0.0001 | −5.79 | 873.76 | < 0.0001 | −4.52 | 1644.43 | < 0.0001 | −4.24 | 637.75 | < 0.0001 |
| AB | 0.8177 | 0.4083 | 0.5291 | −0.36 | 1.14 | 0.2958 | −0.16 | 0.6914 | 0.4142 | −0.504 | 3 | 0.0965 |
| A2 | 2.92 | 20.15 | 0.0002 | −1.39 | 64.98 | < 0.0001 | 0.83 | 72.11 | < 0.0001 | 0.675 | 20.84 | 0.0001 |
| B2 | 2.93 | 20.22 | 0.0002 | −1.92 | 123.91 | < 0.0001 | 0.66 | 44.73 | < 0.0001 | 0.831 | 31.57 | < 0.0001 |
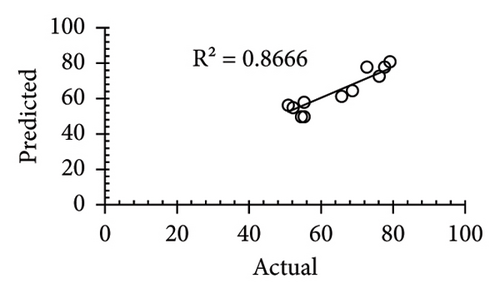
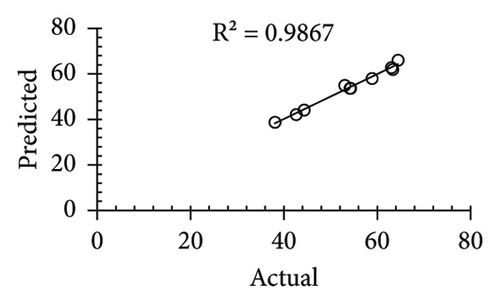
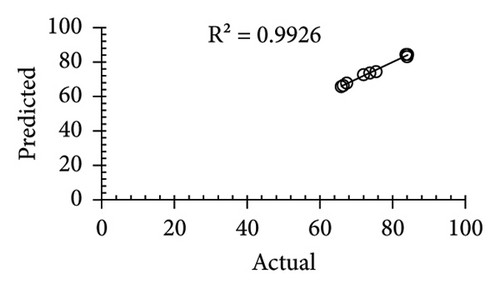
| R2 | 0.866 | 0.9867 | 0.99 | 0.981 | ||||||||
| Adjusted R2 | 0.8375 | 0.9838 | 0.9911 | 0.977 | ||||||||
| Predicted R2 | 0.8 | 0.9792 | 0.9888 | 0.969 | ||||||||
| AP | 15.435 | 51.015 | 61.408 | 38.93 | ||||||||
| CV | 6.99 | 2.18 | 0.897 | 1.4 | ||||||||
- Note: R2, regression coefficient.
- Abbreviations: ABTS RSC, azino-bis (tetrazolium sulfate) radical scavenging capacity; AP, adequate precision; DPPH RSC, 2, 2-diphenyl-1-picrylhydrazyl radical scavenging capacity; HRSC, hydroxyl radical scavenging capacity; SORSC, superoxide radical scavenging capacity.
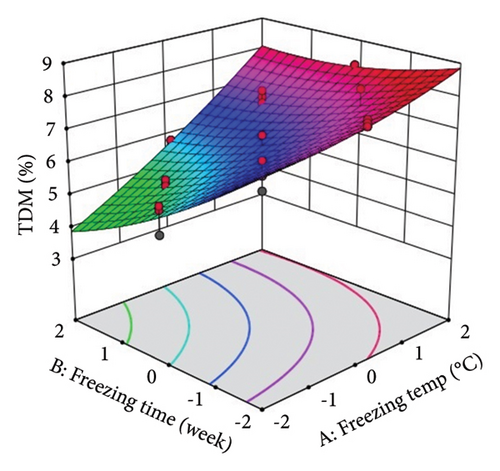
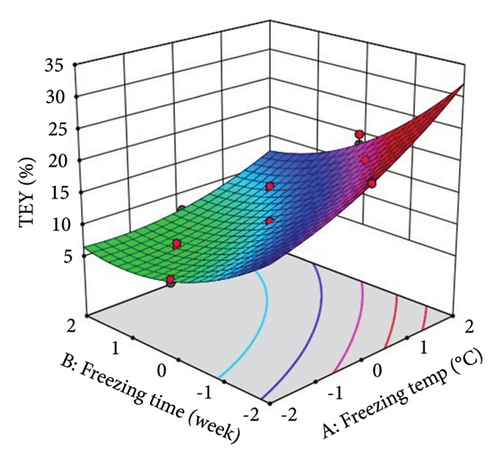
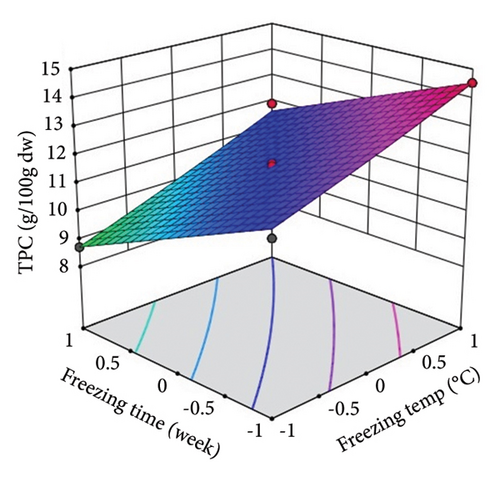
The above polynomial regression equation describes the coefficient for intercept, main effects, interaction terms, and quadratic effects. The effect of ST and St on the phytochemical and antioxidant activity of lotus rhizome is shown by the sign and magnitude of the main effect. The statistical results showed a significant (p < 0.05) positive main effect of the selected storage variables on each studied parameter with relatively higher F values and lower p values. ST showed significant (p < 0.0001) linear positive effects on TDM, TEY, TPC, and TFC, an interaction positive effect on TEY, a quadratic positive effect on TPC, and a quadratic negative effect on TFC. However, ST showed a nonsignificant quadratic and interception effect on TDM. St showed a significant (p < 0.0001) linear negative effect on TDM and TEY and a quadratic positive effect on TEY. However, no significant effect of St was observed on TPC and TFC.
ST showed a significant (p < 0.01) linear positive effect on TTC, ETC, GTC, and CTC and a significant quadratic positive effect on TTC, ETC, GTC, and CTC. St showed a significant (p < 0.0001) linear negative effect on TTC, ETC, GTC, and CTC and a significant (p < 0.01) quadratic positive effect on TTC, ETC, and GTC.
ST showed a significant (p < 0.0001) linear positive effect on DPPH RSC, ABTS RSC, HRSC, and SORSC and a quadratic positive effect on DPPH RSC, HRSC, and SORSC. St showed a significant (p < 0.0001) linear negative effect on DPPH RSC, ABTS RSC, HRSC, and SORSC, a quadratic negative effect on ABTS RSC, and a quadratic positive effect on DPPH RSC, HRSC, and SORSC.
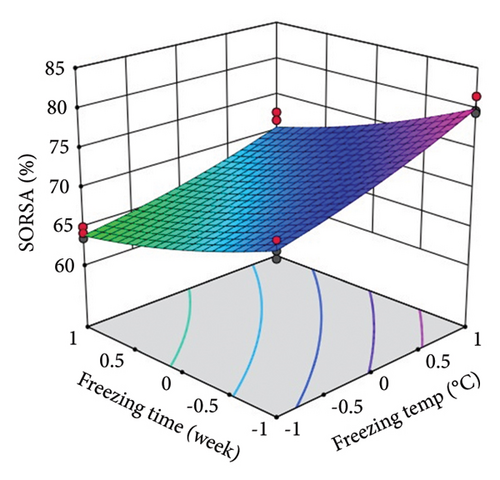
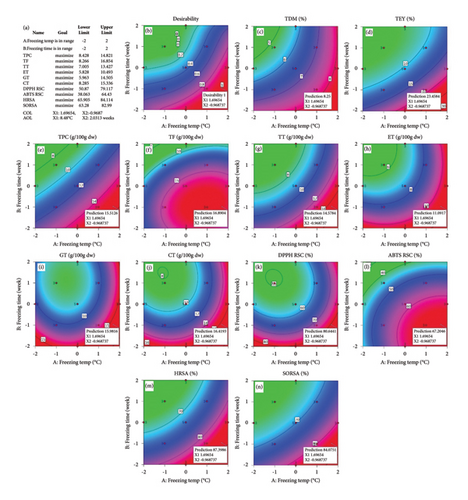
Three-dimensional (3D) response surface plots were drawn to show the main, linear, quadratic, and interaction effects of ST and St on TDM and TEY (Figures 1(a) and 1(b)); TPC and TFC (Figures 2(a) and 2(b)); TTC, ETC, GTC, and CTC (Figures 3(a), 3(b), 3(c), and 3(d)); and DPPH RSC, ABTS RSC, HRSC, and SORSC (Figures 4(a), 4(b), 4(c), and 4(d)) of lotus rhizome.
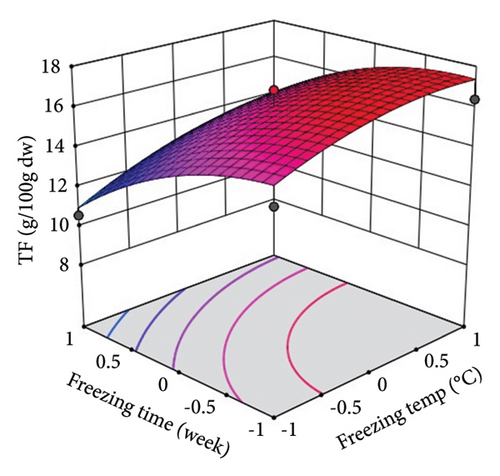
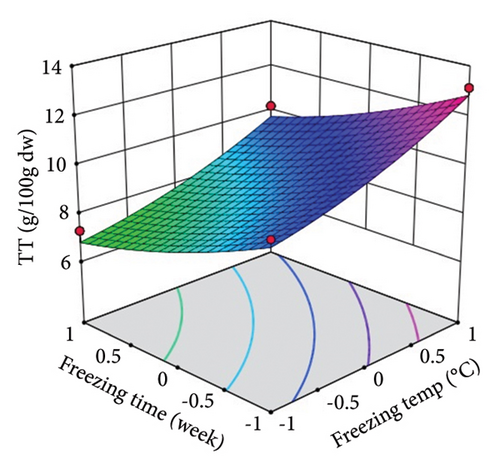
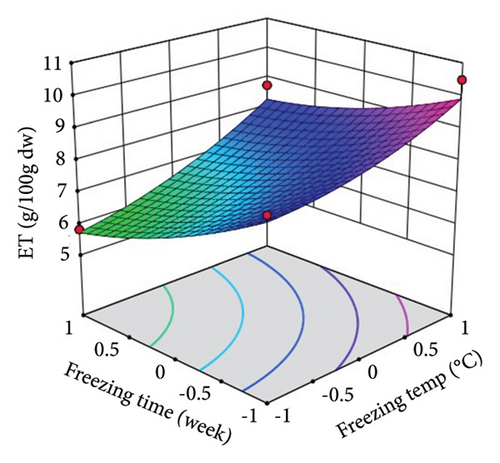
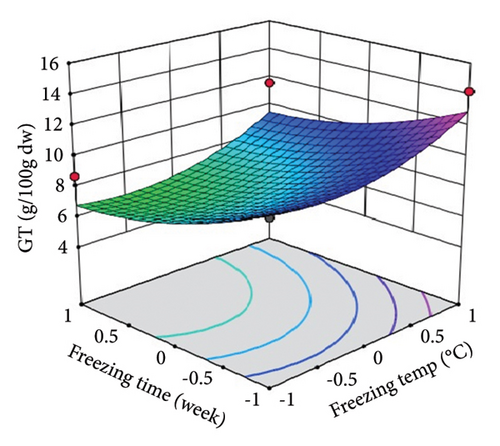
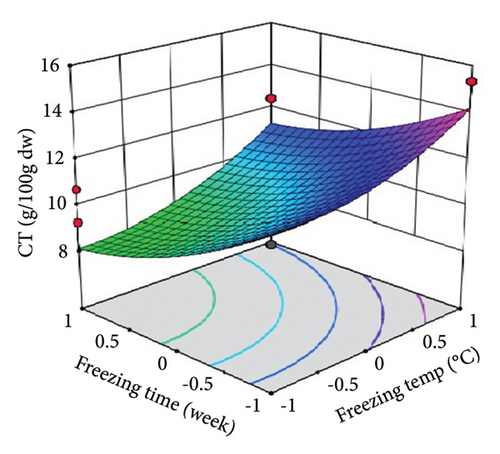
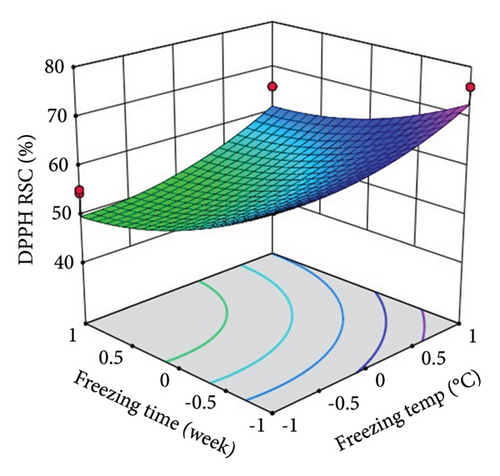
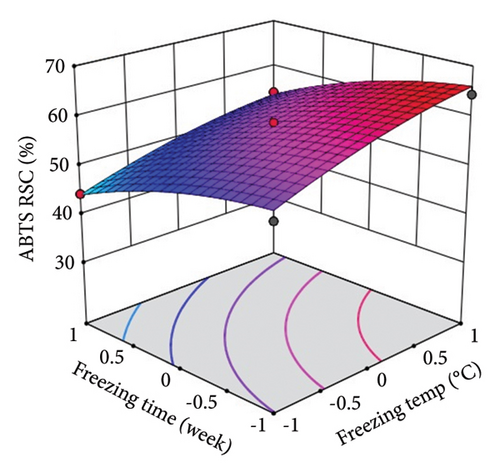
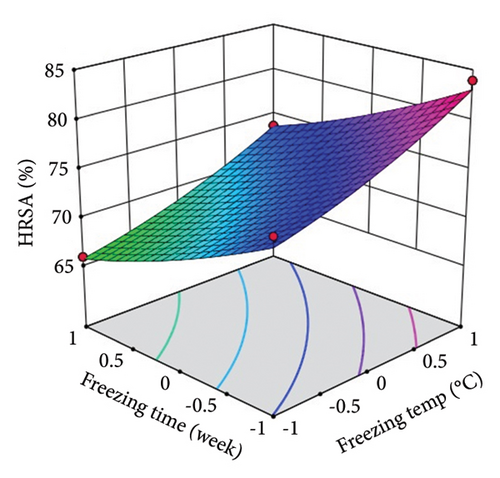
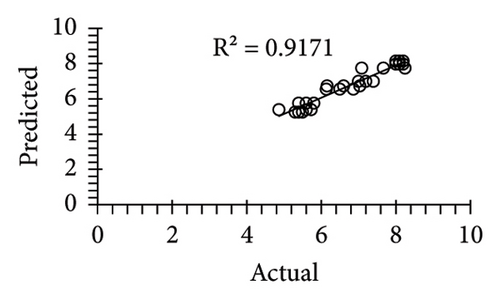
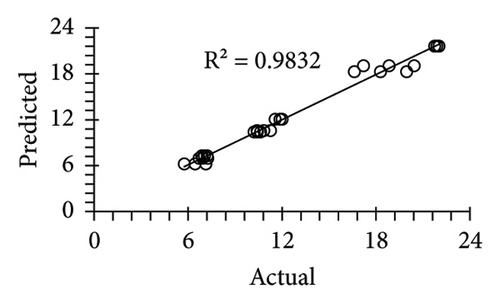
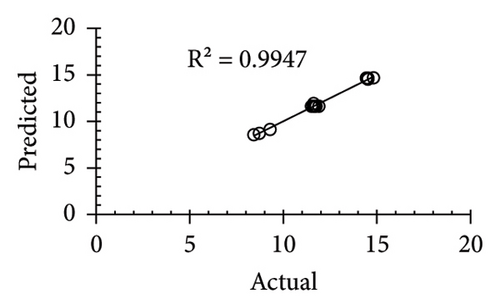
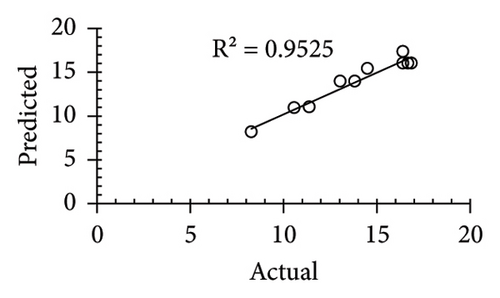
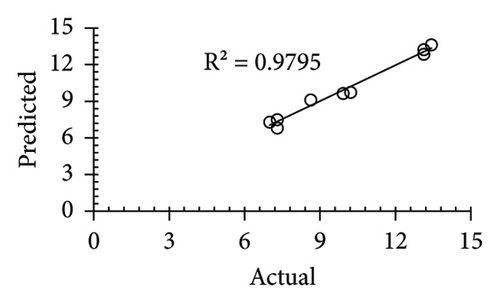
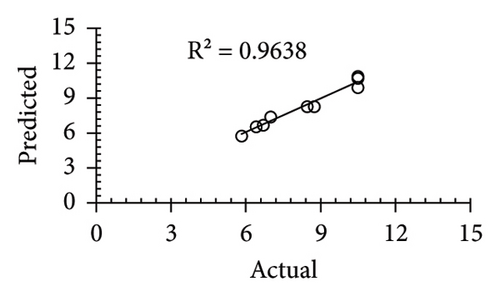
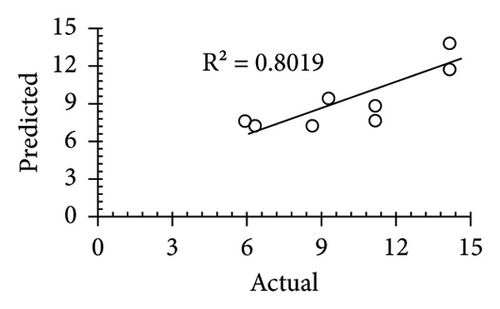
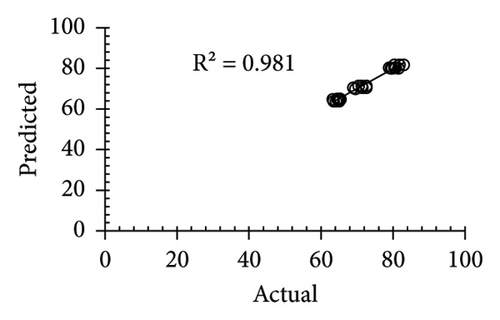
The applicability of the proposed response surface model was evaluated by computing the predicted values of the analyzed responses using the quadratic model’s polynomial regression equations. The linear regression plots comparing predicted response values against experimental values revealed a relatively proficient agreement between the experimental and predicted values of the analyzed responses (Figures 5(a), 5(b), 5(c), 5(d), 5(e), 5(f), 5(g), 5(h), 5(i), 5(j), 5(k), and 5(l)). The observed values of correlation coefficients (R2 = 0.8019–0.9926), coefficient of variance (CV), and adequate precision (AP) suggested the suitability, reliability, and accuracy of the proposed model to investigate the links between freeze conditions and the phytochemical and antioxidant potential of lotus rhizome.
4. Discussion
The antioxidant activity of plant foods is recognized as an indicator of the potential health benefits associated with their consumption. Because of their high perishability and seasonality, plant foods are mostly consumed or used as processed products, and freeze storage is one of the technologies used to produce high-quality foods [23]. However, as previously noted, plant foods can be harmed during freezing and frozen storage, resulting in reduced final product quality and functional qualities, particularly after thawing, compared to similar fresh products. Cell breakages can cause the compartmentalization of antioxidants such as anthocyanins and other phenolic compounds and their destruction due to interaction with oxidative enzymes. If frozen foods are handled and processed correctly, their useful characteristics can be preserved after freezing [24].
The observed experimental results showed a significant linear positive effect of ST and a linear negative effect of St on the lotus rhizome’s phytochemical content and antiradical potential. The results indicated that the phytochemical content and antiradical potential of lotus rhizome are decreased with a decrease in the storage temperature and an increase in the storage time. Studies on the effect of frozen storage conditions (−23°C and −70°C for 6 months) on the TPC of cherries have showed a 25% degradation after 3 months of freezing and a 50% degradation after 6 months of freezing at the selected temperature range [25]. The previous studies reported a decrease in the TFC and antioxidant potential of green and purple leaves of sweet potatoes and outer leaves of onions after storage at 0°C [26]. Similarly, flavonoids and tannins have been reported to be decreased with a decrease in temperature and an increase in freezing duration. Plant tannins have also been reported to be destructed and modified at low temperatures and cause the ripening of fruits and vegetables [27]. The linear negative impact of Ft implies that extended exposure to freezing temperatures is thought to progressively deteriorate or lessen the antioxidants’ potency. The longer the compound is frozen, the lower its antioxidant capacity.
Generally, ice crystals arise in the extracellular environment because of the lower solute concentration and higher freezing point. Ice crystals typically form apoplastic gaps at −2°C resulting in supercooling of the plant cells [28, 29]. If the cell wall is intact, it acts as an effective barrier, preventing ice from penetrating the cell. However, the creation of ice in the extracellular compartment will result in a differential in osmotic pressure, which will suck the liquid water out of the supercooled cells, resulting in tissue dehydration. This shrinks the protoplasm and collapses the cell wall [28, 30]. The loss of water from the intracellular compartment affects turgidity, increases intracellular solute concentration, and, as a result, affects the ionic strength, pH, and viscosity of the fruit’s unfrozen portions, making it susceptible to chemical and enzymatic modifications that can interfere with product quality. Excessive softness of the fruit tissues increases their vulnerability to microbiological deterioration and physical damage, lowering the product’s shelf life [31].
4.1. Response Surface Analysis and Optimization of Results
The proposed response surface model was evaluated for relevance and suitability using the following metrics: appropriate precision (AP), correlation coefficient (R2), and CV. Significant differences in the responses are indicated by lack of fit (F value) and probability (p value). Relatively larger F values and lower p values indicated more important variations. The fitness of the data point on a regression line in a response surface model is indicated by a value of R2 that is closer to unity. The CV and AP measure the variability of the results in the response values and the signal-to-noise ratio, respectively [32]. Relatively lower CV and higher AP values indicate the accuracy and dependability of the model. The calculated values of CV and AP advocated the accuracy and dependability of the currently employed model. These results showed positive indications of fitness, reliability, and precision for the proposed response surface model, which can be used to explain the relationship between storage conditions and phytochemical composition and antioxidant potential of the lotus rhizome. The optimization process also predicted an optimum level for each independent variable, resulting in desirable goals.
5. Conclusions
A strong association was observed between storage conditions and phytochemical components, particularly total phenolics and flavonoids, and the free radical scavenging potential of N. nucifera rhizome against DPPH, ABTS, hydroxyl, and superoxide radicals. The phytochemical content and free radical scavenging potential of N. nucifera rhizome were found to be a linear function of storage temperature and a linear negative function of storage time. The lotus rhizome showed optimal values of phytochemical constituents and antioxidant activity when stored at a low temperature of 8.48°C for 2 weeks. Both phytochemical content and free radical scavenging potential were decreased with a further decrease in temperature. High R2 values indicate that the model is adequate and applicable. The current experimental findings, the developed response model, and the optimization results would be a significant addition to the literature. It would serve as a manual for scientists and business owners seeking the best storage conditions to preserve the bioactive phytochemical antioxidants in food for nutritional, pharmaceutical, and clinical applications.
Nomenclature
-
- TDM
-
- Total dry mass
-
- TEY
-
- Total extract yield
-
- TPC
-
- Total phenolic content
-
- TFC
-
- Total flavonoid
-
- TTC
-
- Total tannin content
-
- ETC
-
- Ellagitannin content
-
- GTC
-
- Gallotannin content
-
- CTC
-
- Condensed tannin content
-
- DPPH RSC
-
- 2, 2-diphenyl-1-picrylhydrazyl radical scavenging capacity
-
- ABTS RSC
-
- Azino-bis (tetrazolium sulfate) radical scavenging capacity
-
- HRSC
-
- Hydroxyl radical scavenging capacity
-
- SORSC
-
- Superoxide radical scavenging capacity
-
- dw
-
- Dry weight
-
- RSM
-
- Response surface methodology
-
- CCD
-
- Central composite design
-
- CV
-
- Coefficient of variation
-
- R2
-
- Regression coefficient
-
- AP
-
- Adequate precision
-
- FT
-
- Freezing temperature
-
- Ft
-
- Freezing time
Conflicts of Interest
The authors declare no conflicts of interest.
Author Contributions
Haq Nawaz created and designed the study, and Farwa Mumtaz contributed to data acquisition and manuscript writing. Rimsha Aosaf and Muhammad Yousaf contributed to interpreting the results. Vania Amin and Mubashir Nawaz contributed to data analysis and wrote up the original draft, and Nafeesa Tahir contributed to data collection and performed statistical analysis.
Funding
No funding was received for this study.
Acknowledgments
The authors acknowledge the Department of Biochemistry and Institute of Chemical Sciences, Bahauddin Zakariya University, Multan, Pakistan, for providing the laboratory facilities for the experimental research.
Open Research
Data Availability Statement
The data supporting this study’s findings are available from the corresponding author upon reasonable request.


