Spirostanol-Type Saponins From Allium Macrostemonis Bulbus Alleviate Chronic Unpredictable Mild Stress–Induced Depression-Like Behavior in Mice
Abstract
Major depressive disorder is a chronic, recurrent, and potentially life-threatening mental disorder that severely impacts both psychological and physiological health. Allii Macrostemonis Bulbus (AMB), a traditional Chinese medicinal and edible plant, is believed to be beneficial for mood regulation. Recent preclinical studies have demonstrated its total saponins’ antidepressant effects, though the specific active substances and pathways remain unclear.We first established an in vitro model of hippocampal neuronal injury in mice induced by Glu and conducted preliminary screening of different polarity fractions of AMB’s total saponins, identifying spirostanol-type saponins (AMBN-90) with antidepressant potential. We then analyzed the components and used network pharmacology to predict the targets and pathways of AMBN-90’s antidepressant effects. Next, we established an in vivo mouse model of depression induced by chronic unpredictable mild stress and treated it with AMBN-90 for 6 weeks. Behavioral tests, hippocampal HE staining, and monoamine level measurements in the hippocampus were used to verify AMBN-90’s antidepressant effects. Subsequently, Western blotting and molecular docking methods were employed to preliminarily reveal AMBN-90’s potential antidepressant mechanisms. Results showed that AMBN-90 exhibited significant neuroprotective activity in vitro. In vivo, AMBN-90 significantly improved weight loss and depression-like behaviors in mice exposed to chronic unpredictable mild stress, ameliorated hippocampal neuronal damage, and significantly increased levels of 5-HT, DA, and NE in the hippocampus. It also elevated brain-derived neurotrophic factor levels and reduced neuronal apoptosis by activating the PKA–CREB–BDNF pathway. Molecular docking showed that components of AMBN-90 have superior affinity for the upstream proteins of the pathway, C-type G protein–coupled receptors (GPCRs). Our findings suggest that steroidal saponins in AMB may be developed as functional foods and drugs for alleviating depression.
1. Introduction
Major depressive disorder (MDD), commonly referred to as depression, is a chronic, recurrent, and potentially life-threatening mental disorder that affects approximately 300 million individuals globally, ranking as a leading cause of mental health–related morbidity [1]. Symptoms of depression typically include persistent low mood, cognitive dysfunction, anhedonia, feelings of worthlessness, and social withdrawal. In recent years, the monoamine hypothesis has emerged as a predominant research focus in the etiology of depression, with most current antidepressants functioning by elevating monoamine neurotransmitter levels. Nonetheless, these medications are associated with adverse health effects [2, 3]. Consequently, there is a growing interest in natural products and other preventive and therapeutic approaches that offer health benefits without adverse effects [4].
Recently, there has been growing evidence that saponins, as edible functional food ingredients, have been recognized as a safe and effective way to prevent depression [5, 6]. Allii Macrostemonis Bulbus (AMB), the dried bulb of Allium macrostemon Bunge or Allium chinense G. Don from the Liliaceae family, is traditionally known in China as “xiebai.” It is reputed for its qi-regulating, chest-broadening, yang-clearing, and knot-dispersing properties (Commission, 2020). AMB is entirely edible, featuring a distinctive pungent flavor that makes it a staple in culinary practices. Remarkably, AMB has been officially recognized by the National Health and Wellness Commission of the People’s Republic of China as both an edible and medicinal plant, affirming its dual status [7]. While the total saponin of AMB has been shown to exert significant antidepressant effects [8, 9], the pharmacological basis and mechanisms underlying its efficacy remain to be elucidated. Identifying the primary components of AMB responsible for its antidepressant activity is thus a crucial step toward developing new antidepressant functional foods that are healthy, eco-friendly, and safe for human consumption, as well as clarifying the associated mechanisms.
Brain-derived neurotrophic factor (BDNF) plays a pivotal role in MDD, influencing cell proliferation, survival, and synaptic formation [10]. Both clinical and animal studies have established a strong correlation between BDNF and depression [11, 12]. BDNF, a downstream target gene of the cAMP response element–binding protein (CREB), is integral to synaptic plasticity regulation [13]. CREB, a cellular transcription factor, orchestrates the expression of numerous genes implicated in depression and the response to antidepressants [14]. It activates the antiapoptotic protein Bcl-2 and is itself activated by various upstream signaling pathways, including the cAMP–dependent protein kinase A (PKA) [15]. PKA, a well-characterized cAMP–responsive kinase, directly phosphorylates CREB, significantly impacting neuronal function and plasticity [16, 17]. Research indicates that long-term treatment with monoamine antidepressants activates the PKA and CREB pathways in the hippocampus, and that inhibiting PKA–CREB signaling diminishes the drugs’ antidepressant effects [18, 19]. Therefore, the PKA–CREB–BDNF pathway, which is associated with neuronal function, including the promotion of neuronal remodeling and inhibition of apoptosis, may play a role in the antidepressant mechanism of AMB.
In this study, we investigated the antidepressant effects and potential mechanisms of spirostanol-type saponins in AMB in depressed mice. First, through in vitro experiments and compositional analysis, spirostanol-type saponins were identified as the main components producing neuroprotective effects in AMB. Second, using network pharmacology, chronic unpredictable mild stress (CUMS) mouse model, and molecular docking, we assessed animal behavior, hippocampal neuronal damage, monoamine levels, and changes in the PKA–CREB–BDNF pathway and apoptosis-related proteins to validate the efficacy of spiropyranol-type saponins in AMB to alleviate depression and the potential mechanisms.
2. Materials and Methods
2.1. Equipment and Reagents
The following equipments were used: Acchrom S6000 high-performance liquid chromatograph (HPLC) (Acchrom Tech Technology Co., Ltd., Beijing, China), ELSD-UM 5800 Plus Detector (Unimicro Technologies Co., Ltd., Shanghai, China), SPECTROstar Nano full-wavelength enzyme labeler (BMG LABTECH, Offenburg, Germany), Telstar ∗ LyoQuest vacuum freeze dryer (Telstar Technologies. S. L, Barcelona, Spain), YJ-1340 ultra-clean bench (SANYO, Japan), CO2 incubator (CC1-170B, Thermo Fisheries Co., Ltd., Beijing, China), ELSD-UM 5800 Plus detector (Unimicro Technologies Co., Ltd., Shanghai, China), SPECTRO star 170B (Thermo Fisher Scientific), Leica inverted fluorescence microscope (Leica, Germany), electrophoresis device and Tanon5200 gel imaging system (Shanghai Tianneng Science and Technology Co., Ltd.), and RM-2245 semiautomatic paraffin slicer (Leica, Germany).
The following reagents were used: and D101 macroporous resin (Donghong Chemical Co., Ltd., Guangdong, China); petroleum ether (PE), ethanol (EtOH), methanol (MeOH), n-butanol, and dichloromethane (DCM) (Beijing Chemical Factory, Beijing, China); chromatographically pure MeOH (Thermo Fisher Scientific, Waltham, Massachusetts, United States of America); DMEM high glucose medium, phosphate buffer solution (PBS), penicillin–streptomycin solution, and 0.25% trypsin (Xavier, China); fetal bovine serum (FBS) (Gibco, United States of America); thiazolyl blue (MTT), Hoechst 33,258 stain, RIPA cleavage stain, RIPA cleavage stain, and RIPA cleavage stain (Hoechst, China); thiazolyl blue (MTT), Hoechst 33,258, RIPA lysate, PMSF (100 mM), protease phosphatase inhibitor mixture (general purpose, 50X), BCA Protein Concentration Measurement Kit (enhanced), and SDS-PAGE sample loading buffer (Biyuntian Biotechnology Company); dimethyl sulfoxide (DMSO) (Beijing Solepol Science and Technology Co.); HRP-labeled goat anti-rabbit IgG (H + L) (Shenyang Wanclass Biologicals); 5-hydroxytryptamine (5-HT), noradrenaline (NE), and dopamine (DA) ELISA kit (Jiangsu Jingmei Biotechnology Co., Ltd.); fluoxetine (FLU) (Shanghai Yuanye Biotechnology Co).
2.2. Access to Medicines
The experimental plant was acquired from the Changchun Chinese Medicine Shop in Changchun, China, in 2021. It was identified as Allium macrostemon Bunge, belonging to the genus Allium and the family Liliaceae, by Prof. Zhang Jing from the College of Chinese Materia Medica at Jilin Agricultural University, China. The voucher specimen (20,210,971) is preserved in the Herbal Library of the same institution.
As shown in Figure 1(a), the dried AMB sample was pulverized and passed through a 40-mesh sieve to obtain AMB powder. This powder was mixed with 80% EtOH solution at a ratio of 1:5 (m:V, g:mL) and subjected to ultrasonic extraction for 1 h. The mixture was then filtered and the process was repeated a total of 6 times. The combined filtrate was concentrated under reduced pressure and freeze-dried to obtain the EtOH extract.

Subsequently, the AMB EtOH extract was dissolved in water and extracted with n-butanol to obtain the n-butanol fraction rich in steroidal saponins (AMBN). The AMBN was further enriched and separated using D101 macroporous resin. The mobile phases were 30%, 50%, 70%, and 90% aqueous MeOH solution, respectively, with each mobile phase eluting 4-5 column volumes. Each eluted fraction was concentrated under reduced pressure to remove the alcohol odor and then freeze-dried, resulting in four fractions: 30% fraction (AMBN-30), 50% fraction (AMBN-50), 70% fraction (AMBN-70), and 90% fraction (AMBN-90).
2.3. Cell Viability Assay
Mouse hippocampal neurons (HT22 cells, catalog number: iCell-m020) were purchased from Shanghai Saibokang Biotechnology Co., Ltd. Glu, AMBN-30, AMBN-50, AMBN-70, and AMBN-90 were diluted to the required concentrations using culture medium (HyClone, Logan, Utah, United States of America). Poorly soluble components were dissolved using DMSO. The cells were cultured in 96-well plates and treated with each component for 6 h, followed by Glu treatment for 24 h. After treatment, 20 μL of the MTT solution was added to each well and incubated for 4 h. The liquid in the wells was then removed, and 100 μL of DMSO was added to each well, followed by shaking for 10 min. The absorbance at 490 nm was measured using a microplate reader.
2.4. HPLC–ELSD Analysis
The AMBN-90 was subjected to HPLC–evaporative light scattering detector (HPLC–ELSD) analysis using an Agilent TC-C18 column (250 mm × 4.6 mm, 5 μm) maintained at 35°C. The injection volume was set to 20 μL and the flow rate was 0.8 mL·min−1. In addition, the evaporation temperature was set to 90°C and the gas flow rate was 2.0 L·min−1, and the gain value was adjusted to 3. Mobile phase A consisted of 0.05% formic acid–water solution, while Mobile phase B consisted of acetonitrile. The following gradient system was used for elution: 0–5 min, 5%–10% B; 5–10 min, 10%–15% B; 10–13 min, 15%–18% B; 13–25 min, 18%–21% B; 25–40 min, 21%–25.5% B; 40–43 min, 25.5%–26.5% B; 43–45 min, 26.5%–27% B; 45–52 min, 27%–27.5% B; 52–55 min, 27.5%–28% B; 55–58 min, 28% B; 55–58 min, 28% B; 55–58 min, 28% B; 55–58 min, 28% B; and 55–58 min, 28% B. Minutes 70%–78%, 30%–75% B; minutes 78%–85%, 75%–85% B; minutes 85%–90%, 85%–90% B; and minutes 90%–110%, 90% B.
2.5. Network Pharmacology Research
2.5.1. Prediction of AMBN-90 Targets
The compound structures from AMBN-90 were imported into ChemDraw, converted to SMILES, and inputted into SwissTargetPrediction to identify potential active component targets. Targets with a confidence value of zero were excluded.
2.5.2. Acquisition of MDD Target Genes
The known therapeutic targets related to PD were obtained from three sources: (1) Therapeutic Target Database (https://db.idrblab.org/ttd/), (2) Online Mendelian Inheritance in Man (OMIM, https://omim.org/), and (3) GeneCards human gene database (https://www.genecards.org/). “Depression” was used as the keyword and “Homo sapiens” was selected as the organism when searching for targets. All the protein names were standardized into official gene symbols (Homo sapiens) via UniProt Knowledgebase (https://www.uniprot.org/). The targets in the three databases were merged and duplicates were removed.
2.5.3. Construction of a PPI Network of Common Targets for AMBN-90 and Depression
We imported AMBN-90 active ingredient targets and depression targets into the Venn database (https://www.bioinformatics.com.cn/static/others/jvenn/example.html). The intersecting targets were imported into the STRING database (https://string-db.org/) to obtain information about the protein interaction network. The screening condition for organisms was set to “Homo sapiens” and the minimum required interaction score was set to the highest confidence level (0.900). Cytoscpace 3.7 was applied to map the common target PPI network. Node sizes and colors were adjusted according to the degrees in the graph. We selected target nodes with degree values BC and CC higher than the corresponding median values in the PPI network and predicted 10 possible core targets for further study.
2.5.4. GO Enrichment and KEGG Pathway Analysis
To investigate the biological functions of potential depression targets, the common targets processed by STRING were uploaded to Metascape for GO and KEGG analysis. The data for cellular components (CCs), molecular functions (MFs), biological processes (BPs), and KEGG pathways were retrieved. The top 8 GO terms and the top 15 KEGG pathways with the lowest p values were selected and visualized as bar graphs and bubble plots using a bioinformatics mapping tool.
2.6. Animals
SPF grade Kunming mice (male and female, 6–8 weeks old, and 18–24 g) were acquired from Changchun Yisi Laboratory Animal Technology Co., Ltd., holding the approved license no. SCXK (JI) 2023–0002. The mice were housed under controlled conditions with a constant temperature of 22 ± 2°C and humidity of 55 ± 10%. They had ad libitum access to water and food. All animal experiments conducted in this study were approved by the Animal Ethics Committee of Jilin Agricultural University with the ethical approval number: 2023 06 13 005.
2.6.1. Animal Grouping
The mice were randomly divided into six groups of eight mice each: control, model, FLU (10 mg/kg, FLU), and AMBN-90 at high (100 mg/kg, AMBN-90-H), medium (50 mg/kg, AMBN-90-M), and low doses (25 mg/kg, AMBN-90-L), where AMBN-90 is referenced to the administered dose of Zhao et al. [9], with minor modifications based on the proportion of AMBN-90 in total AMB saponins. Prior to grouping, the mice were acclimatized to sugar water as per [20]. Initially, mice were individually housed and habituated to a 1% sucrose solution for 24 h. Subsequently, they underwent a 24-h water deprivation period, after which they were provided with one bottle of fresh water and one bottle of 1% sucrose solution. A preference test was conducted over 4 h, during which the positions of the two bottles were alternated every 30 min. At the end of the test, the bottles were weighed to calculate the consumed volumes of sucrose and water. We calculate the sucrose preference rate as follows: sucrose preference rate (%) = sucrose solution (g)/(sucrose solution [g] + normal drinking water [g]) × 100%.
2.6.2. Modeling Methods
This study utilized the CUMS model to establish a mouse model of depression, adhering to the protocol outlined by the authors in [21]. The stimulation conditions included the following: tilting the rearing cage at 45° for 12 h, 24-h fasting, 24-h water deprivation, three instances of plantar electric shock, restrain in 50 mL centrifuge tubes for 2 h, three minutes of tail pinching, 10 minutes of swimming in 5°C ice-cold water, introduction of foreign objects into the cage, 12 h of nocturnal illumination, and damp bedding. For the stimulation methods, 4 out of the 10 conditions were randomly selected each day to stress the mice over 6 weeks, with all groups receiving the same stimuli on the same day. Following the commencement of the CUMS protocol, the control and model groups were administered 0.1 mL of saline per 10 g of body weight, while the remaining groups were orally given their respective drugs daily for 6 weeks. The model’s success was validated by measuring body weight, sucrose and water preference, and conducting behavioral experiments.
2.7. Behavioral Testing
2.7.1. Sucrose Preference Test (SPT)
After 6 weeks of modeling, the premodeling sucrose preference process was repeated and sucrose preference rates were calculated for all groups.
2.7.2. Open Field Test (OFT)
OFT was used to assess locomotor activity and anxiety-like behavior in mice [22]. The OFT procedure is as follows, with an open box device of 50 cm × 50 cm × 50 cm. Prior to testing, the mice were placed in the center of the device for 30 s to acclimatize to the environment and then gently placed into the center of the arena to explore freely for 5 min. The total distance traveled by the mice in the central area (30 cm × 30 cm) and the time were recorded. They were then rinsed with 75% alcohol and towel dried between successive tests.
2.7.3. Elevated Plus-Maze (EPM) Test
EPM was used for assessing anxiety and depression–related behaviors in rodents [23]. The EPM test consists of four arms (5 × 30 cm). Two closed arms have 20-cm-high walls and the other arms are left open (open arm). The maze was elevated 40 cm above the floor. Mice were placed on a central platform with their heads facing the open arms and allowed to explore freely for 5 min. Then, we calculated the total number of times a mouse entered the open arm and the total time spent in the open arm. They were then rinsed with 75% alcohol and towel dried between successive tests.
2.7.4. Tail Suspension Test (TST)
Mice were suspended by the tails by using adhesive tape 1 cm from the tip of the tail and 15 cm above the ground. Small plastic tubes were attached to tails to make sure mice could not climb. The tests lasted for 6 min and the immobility time was measured and analyzed during the final 4 min [24].
2.7.5. Forced Swim Test (FST)
FST was performed 12 h after TST. Mice were placed individually in open cylindrical containers (height: 20 cm and diameter: 15 cm), maintaining a water level of 15 cm and a water temperature of 25°C in the containers, and forced to swim for 6 min. Immobility time was measured from the last 4 min, and immobility time was defined as floating or performing only slight movements to keep the head above water [25].
2.8. Measurement of Neurotransmitters in the Hippocampus
After behavioral testing, mice were anesthetized with sodium pentobarbital. The skulls of each group of mice were opened to extract the entire brain tissue, and the hippocampus was isolated. The hippocampus was then placed in a centrifuge tube with PBS buffer at nine times its weight and thoroughly homogenized. The homogenate was centrifuged at 6000 r/min for 20 min, and the supernatant was collected. According to the instructions, 5-HT, NE, and DA ELISA kits were used, and the levels of 5-HT, NE, and DA were measured using a microplate reader at a wavelength of 450 nm.
2.9. Pathological and Morphological Observations of Hippocampal Tissue
The brains of mice were fixed in 4% paraformaldehyde for 24 h. The hippocampus was isolated, embedded in paraffin, and cut into 4 μm-thick sections. Sections were stained with hematoxylin–eosin and pathological changes were observed under a microscope [26]. The percentage of damaged neurons was calculated using ImageJ software and statistically analyzed.
2.10. Western Blotting
Hippocampal tissue was mixed with lysis buffer and lysed on ice for 30 min. The supernatant was obtained by centrifugation at 4°C for 15 min. Protein concentration was determined using the BCA Protein Assay Kit. The extract was mixed with the SDS–PAGE sample loading buffer in a 1:4 ratio and denatured at 100°C for 10 min. Equal amounts of protein were upsampled onto SDS–PAGE (8% or 12%). The proteins were transferred to a PVDF membrane and incubated for 1 h at 37°C using skimmed milk. The membrane was incubated with the primary antibody at 4°C and washed 3 times with TBST for 5 min each; then, the secondary antibody was incubated for 30 min and washed 3 times with TBST for 5 min each. After the last wash, the PVDF membrane with bound proteins was completely immersed in an enhanced chemiluminescence (ECL) solution for chemiluminescence analysis. PKA, BDNF, CREB, p-CREB, Bcl-2, and Bax were normalized to β-microtubulin bands for optical density analysis using ImageJ software for quantitative analysis of protein bands. All experiments were performed in triplicate.
2.11. Molecular Docking
Crystal structures of G protein–coupled receptor protein targets were downloaded from the Protein Data Bank (PDB) (https://www.pdb.org/) (ID: 7DGD) and modified using AutoDock Tools 1.5.6 software, including ligand and water removal and hydrogen addition. Files were saved in pdbqt format. Small molecule compounds were created in 3D chemical structures and their energies were minimized by ChemBioDraw 3D. Results are saved in MOL2 format. Compounds were imported into AutoDock Tools 1.5.6 and saved as docked ligands in pdbqt format. AutoDock Vina 1.1.2 was used for docking, while PyMOL and Discovery Studio 3.5 were used to visualize the 3D and 2D docking results, respectively.
2.12. Statistical Analysis
All data are expressed as mean ± standard deviation. Stained images were analyzed using ImageJ software. Differences between multiple groups were analyzed by one-way ANOVA using GraphPad Prism 9.0 software, and graphs were plotted according to the statistical results. p < 0.05 was considered statistically significant.
3. Results
3.1. AMBN-90 Has a Significant Protective Effect Against Glu-Induced HT22 Cell Damage
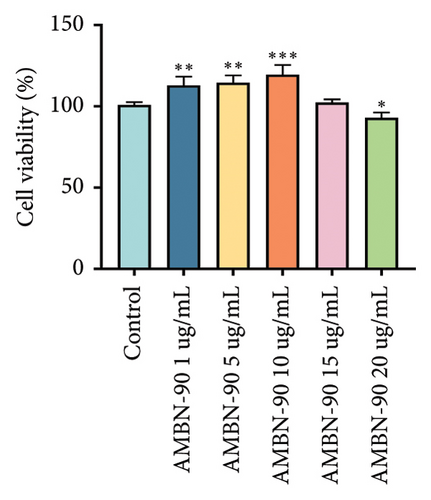
Studies have shown that hippocampal neuronal damage and death are closely related to MDD, and excitotoxicity caused by excessive Glu accumulation is one of the recognized hypotheses for MDD pathogenesis [27–29]. Therefore, we used a Glu-induced HT22 cell injury model to screen the neuroprotective activity and antidepressant potential of the obtained fractions. AMBN-90 showed no cytotoxicity at concentrations of 1–15 μg/mL but exhibited a significant decrease in cell viability at 20 μg/mL (Figure 1(b), p < 0.05). Based on this, we used 1, 5, and 10 μg/mL of AMBN-90 as low, medium, and high doses for screening the neuroprotective effects of the four AMBN fractions.
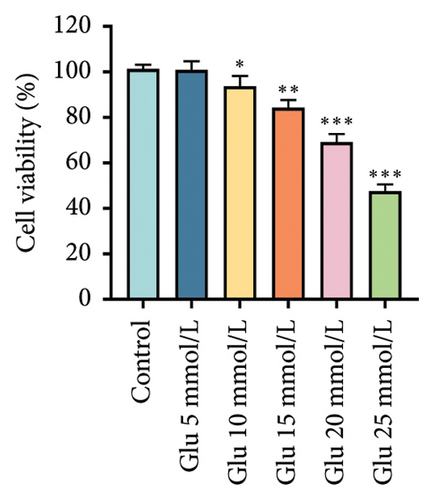
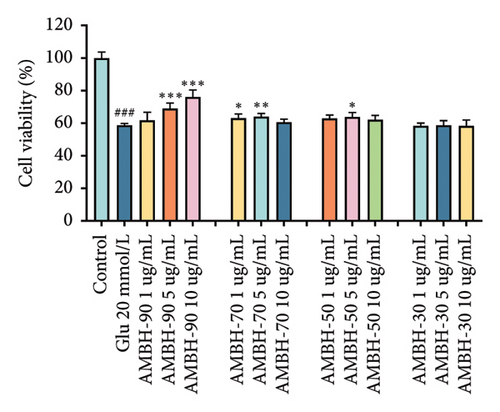
Glu-induced HT22 cell injury significantly reduced cell viability at 20 mmol/L Glu (Figure 1(c), p < 0.001), establishing 20 mmol/L Glu as the modeling dose. Through stepwise screening of each fraction, we found that the AMBN-90 fraction (5 μg/mL and 10 μg/mL) provided the most significant protection against Glu-induced HT22 cell injury (Figure 1(d), p < 0.001). Thus, we speculate that AMBN-90 may be the main component of AMB responsible for its antidepressant effects.
3.2. AMBN-90 Compositional Analysis
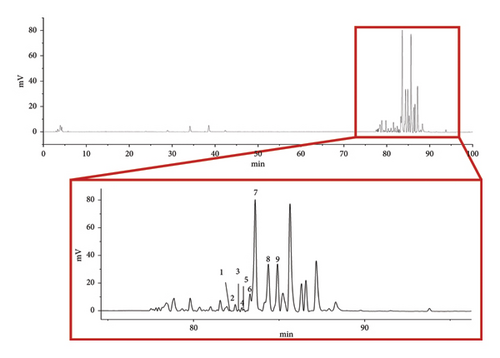
AMBN-90 was analyzed using HPLC–ELSD (Figure 2). Under identical chromatographic conditions, we compared it with previously isolated and identified single components from AMBN. Nine components were identified in AMBN-90 (Supporting documents Figure S1 and Table 1), all of which were spirostanol saponins [30]. Consequently, we deduced that the AMBN-90 fraction is likely primarily composed of spirostanol saponins.
| Serial number | Compound name | Compound structure | Retention time (min) |
|---|---|---|---|
| 1 | Odospiroside |  |
82.17 |
| 2 | Tigogenin-3-O-β-D-glucopyranosyl(1 ⟶ 4)-O-β-D-galactopyranoside |  |
82.45 |
| 3 | Macrostemonoside X |  |
82.64 |
| 4 | Macrostemonoside W |  |
82.80 |
| 5 | Macrostemonoside Y |  |
82.94 |
| 6 | Dongnoside E |  |
83 32 |
| 7 | Macrostemonoside A |  |
83.62 |
| 8 | Macrostemonoside U |  |
84.36 |
| 9 | Macrostemonoside V |  |
84.76 |
3.3. Network Pharmacology Analysis of AMBN-90
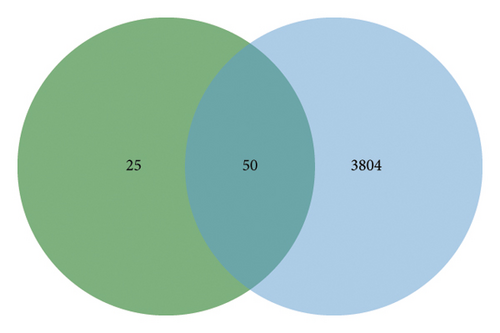
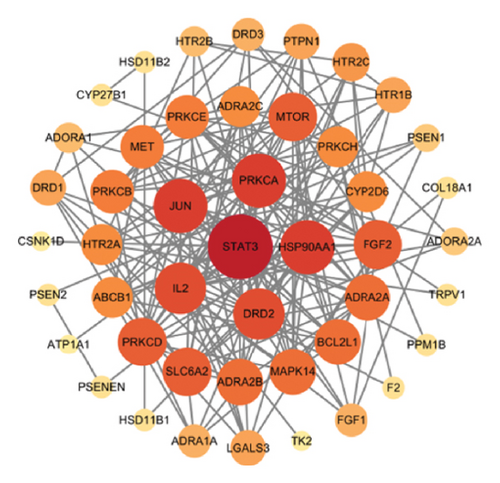
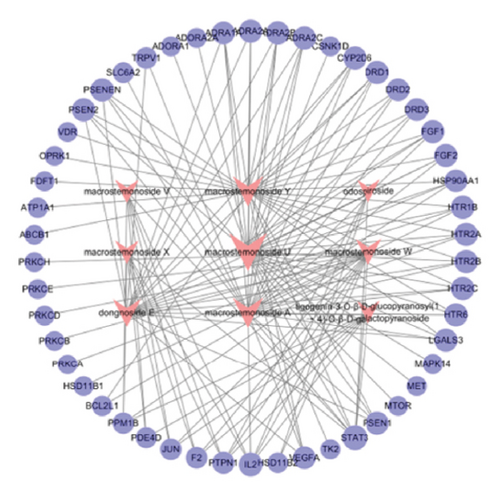
In this study, network pharmacological prediction analysis of AMBN-90 was conducted based on its nine chemical components (Table 1). SwissTargetPrediction identified 75 targets for these compounds. From the GeneCards, OMIM, and TTD databases, a total of 3854 depression-related targets were retrieved, with the Venn diagram indicating 50 intersecting targets (Figure 3(a)). The PPI network of these intersecting targets was constructed using STRING 11.0 and visualized in Cytoscape (Figure 3(b)). The degree values were visualized through node size and color intensity, with larger nodes and darker colors indicating a stronger correlation with depression, reflecting higher degree values. The top 10 proteins, STAT3, HSP90AA1, JUN, PRKCA, DRD2, IL2, SLC6A2, PRKCD, MTOR, and FGF2, were posited as potential antidepressant targets of this fraction. Further analysis involved importing the 50 intersecting targets and 9 components into Cytoscape to create a “drug-active component–depression–target” network (Figure 3(c)), illustrating the potential interactions among one disease type, nine chemical components, and 50 targets. The node sizes corresponded to their roles in the therapeutic pathway of depression, suggesting that Macrostemonoside U, Macrostemonoside Y, Macrostemonoside A, Dongnoside E, and Macrostemonoside W, due to their larger node sizes, might be the principal antidepressant constituents.
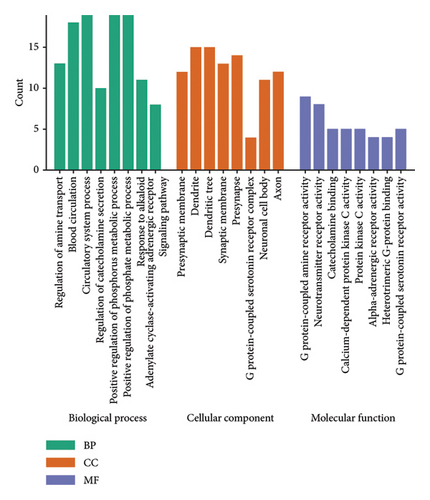
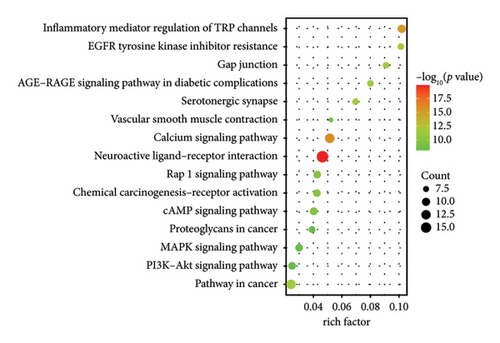
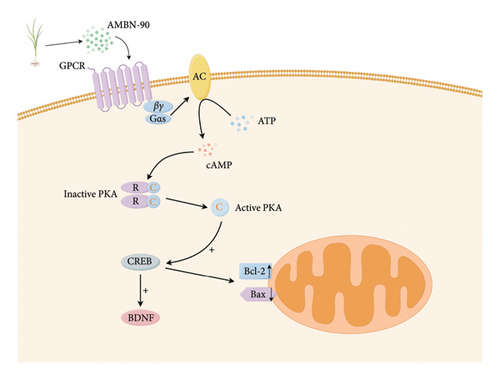
GO analysis allowed us to identify eight biological, cellular, and MFs primarily involved in amine transport regulation, G protein–coupled amine receptor activity, neurotransmitter receptor activity, G protein–coupled 5-HT receptor activity, and neuronal synaptic system regulation (Figure 3(d)). To investigate the potential signaling pathway mechanism of AMBN-90 in depression, KEGG enrichment analysis was performed. The top 15 signaling pathways, including the cAMP signaling pathway and MAPK signaling pathway, were highlighted in Figure 3(e). The C-type G protein protein–coupled receptor (GPCR) was notably enriched in the GO analysis, and the activation of the cAMP signaling pathway by GPCR signaling initiated a series of downstream pathways, such as the PKA–CREB–BDNF signaling pathway, through the second messenger cAMP. Research suggests that dysfunctions in the PKA–CREB–BDNF signaling pathway may relate to the pathophysiology of depression [31, 32]. Furthermore, CREB, a central protein in this pathway, can activate the antiapoptotic protein Bcl-2. Thus, we postulate that AMBN-90 could exert antidepressant effects by targeting GPCR, which in turn activates the downstream PKA–CREB–BDNF signaling pathway, contributing to neuronal apoptosis resistance.
3.4. Weight Change
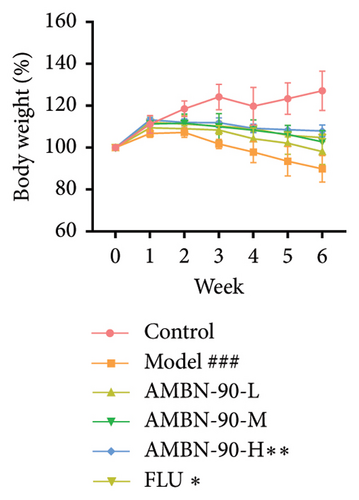
After the CUMS procedure, notable changes in body weight were observed among all mouse groups, as shown in Figure 4(a). The control group mice consistently gained weight throughout the study. By the sixth week, the model group exhibited a significantly slower growth rate in body weight compared to the control group (p < 0.001). However, both FLU (p < 0.05) and AMBN-90 at a dose of 100 mg/kg (p < 0.01) effectively counteracted the weight loss induced by CUMS in mice.
3.5. AMBN-90 ameliorates CUMS–Induced Depression-Like Behavior in Mice
3.5.1. SPT
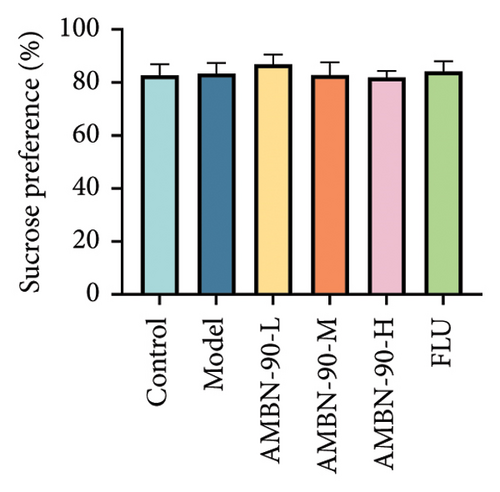
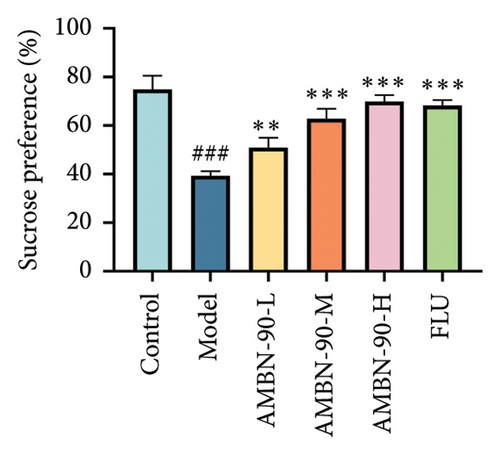
The SPT indicated no significant difference (p > 0.05) in the sucrose preference rate between groups prior to the CUMS procedure (Figure 4(b)). However, by the sixth week of modeling, the model group’s sucrose preference rate was significantly lower than that of the control group (p < 0.001). Conversely, the sucrose preference rates in the FLU group and AMBN-90 groups at low, medium, and high doses were significantly higher compared to the model group (Figure 4(c), FLU group, p < 0.001; AMBN-90-L, p < 0.01; AMBN-90-M and AMBN-90-H, p < 0.001). These results suggest that AMBN-90 markedly improved the dysregulation of reward mechanisms in the brain, a symptom indicative of depression in mice.
3.5.2. OFT
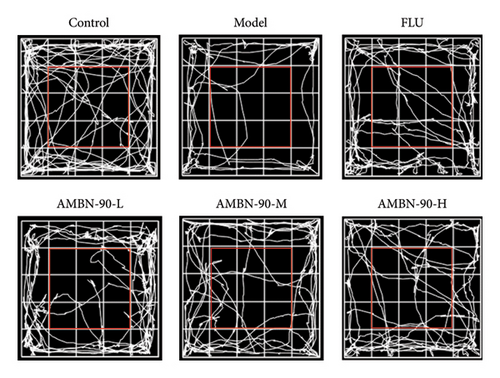
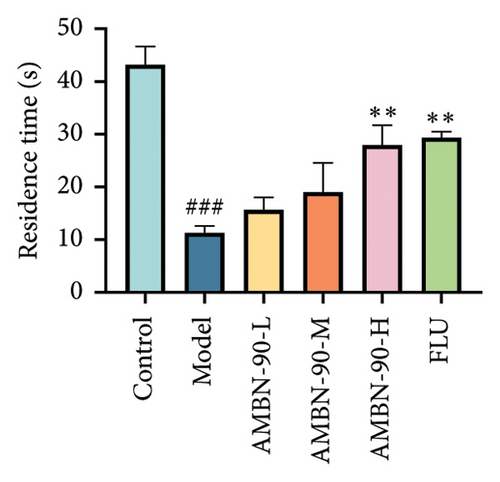
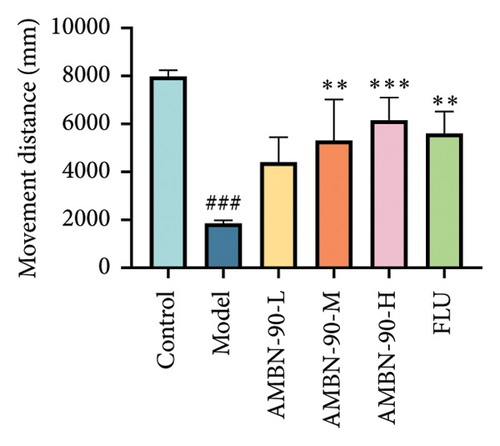
Figure 4(d) depicts the movement trajectories of mice in the open field test. The control group mice frequently traversed the central area, displaying pronounced exploratory behavior. In contrast, the model group mice showed significantly reduced movement in the central area, limiting their activity to the periphery, which is indicative of anxiety. However, the administration of AMBN-90 notably alleviated the nervous and anxious behaviors observed in the model group mice. Figure 4(e) and F show that both the duration of stay and the distance traveled in the central region by the model group mice were significantly less than those in the control group (p < 0.001). Compared to the model group, mice treated with AMBN-90 and FLU spent more time in the central area (AMBN-90-H, p < 0.001; FLU, p < 0.001) and traveled greater distances (AMBN-90-M, p < 0.001; AMBN-90-H, p < 0.001; FLU, p < 0.01).
3.5.3. EPM
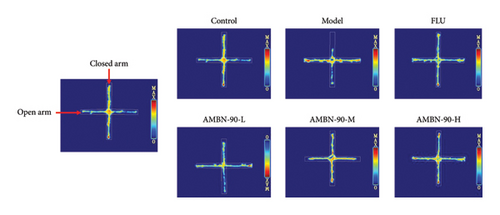
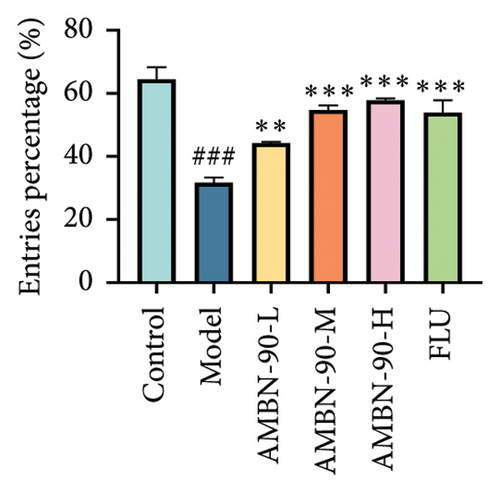
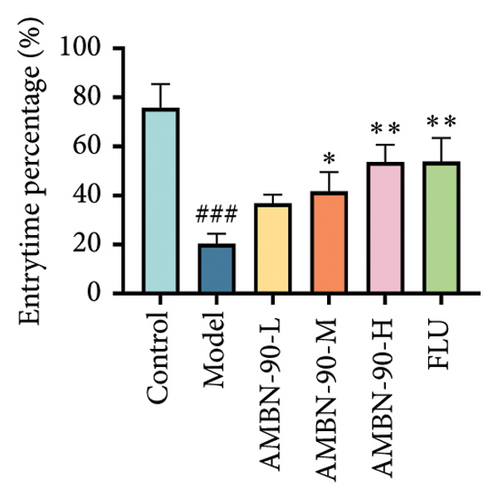
EPM was utilized to assess anxiety and depression in mice within unfamiliar environments by recording the time spent and the number of entries into the open and closed arms. Figure 5(a) illustrates the heatmap of the mice’s movements, showing that the model group significantly reduced their movement within the open arm, predominantly restricting their activity to the closed arm, in contrast to the control group. The AMBN-90 and FLU groups demonstrated a notable increase in movement within the open arm relative to the model group. Figure 5(b) and C reveal that the frequency and percentage of time spent in the open arm by the model group were significantly lower than those of the control group (p < 0.001). Conversely, mice treated with AMBN-90 and FLU significantly increased the number of entries into the open arm (AMBN-90-L, p < 0.01; AMBN-90-M, AMBN-90-H, and FLU, p < 0.001) and the duration of time spent there (AMBN-90-M, p < 0.05; AMBN-90-H and FLU, p < 0.01).
3.5.4. TST and FST
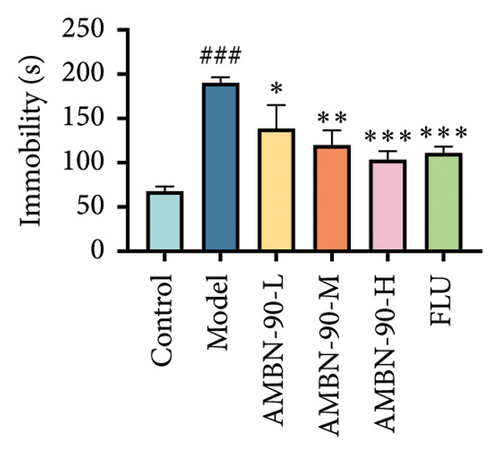
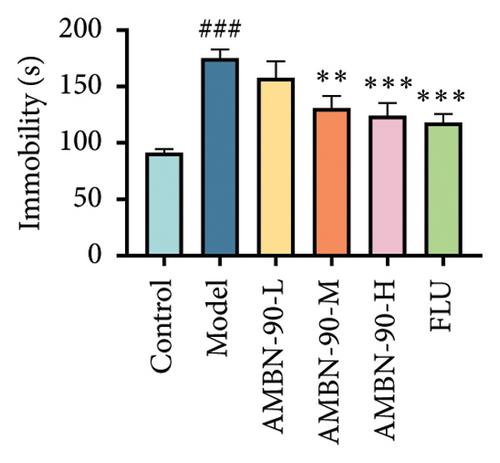
Figure 5(d) indicates that the tail suspension immobility time was significantly longer in the model group compared to the control group (p < 0.05), suggesting increased despair in the model group mice. The immobility time was significantly reduced in the FLU and AMBN-90 (L, M, and H) groups compared to the model group (FLU and AMBN-90-H groups, p < 0.001; AMBN-90-M group, p < 0.01; AMBN-90-L group, p < 0.05). During the forced swimming test, the immobility time was significantly higher in the model group than in the control group (p < 0.001). The AMBN-90-M, AMBN-90-H, and FLU groups showed a significant reduction in immobility time compared to the model group (Figure 5(e), AMBN-90-M, p < 0.01; AMBN-90-H and FLU, p < 0.001). These results suggest that AMBN-90 mitigates depressive behavior in CUMS mice.
3.6. AMBN-90 ameliorates CUMS–Induced Hippocampal Tissue Damage
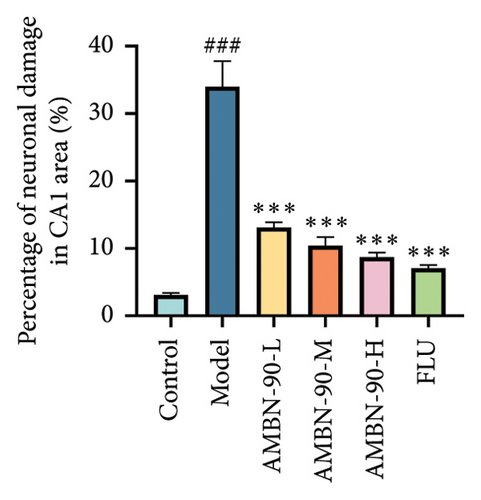
Figure 6(a) presents the HE staining of the mouse hippocampus. The results showed that the CA1 and CA3 regions in the control group had densely packed neurons, which were orderly arranged, displaying intact cellular morphology and structure. In contrast, the model group exhibited a reduced neuron count in the hippocampus, with disorganized cells, and signs of neuronal atrophy and deformation, resulting in irregular morphologies such as conical or polygonal shapes. However, compared to the model group, hippocampal neuronal damage was significantly improved in the AMBN-90 and FLU groups, with well-aligned hippocampal neurons, well-defined cell membranes, homogeneous cytoplasmic staining, and a significant reduction in the percentage of damaged neurons (Figures 6(b) and 6(c),p < 0.001). Notably, AMBN-90 treatment had a particularly marked reparative effect on the CA1 region, similar to that of FLU. The CA3 region also demonstrated improvement with AMBN-90 treatment; although some neurons remained atrophied and deformed, the overall neuronal condition was markedly better than that of the model group.


3.7. Effects of AMBN-90 on Monoamine Neurotransmitter Levels in the Hippocampus
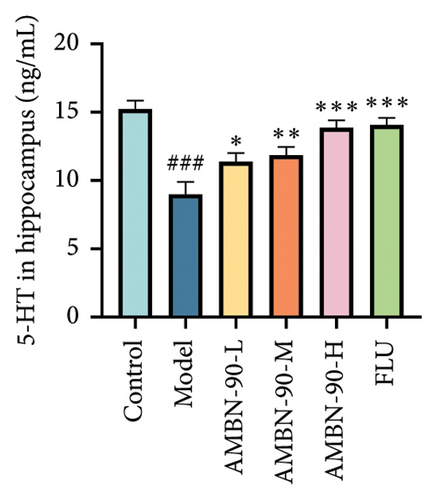
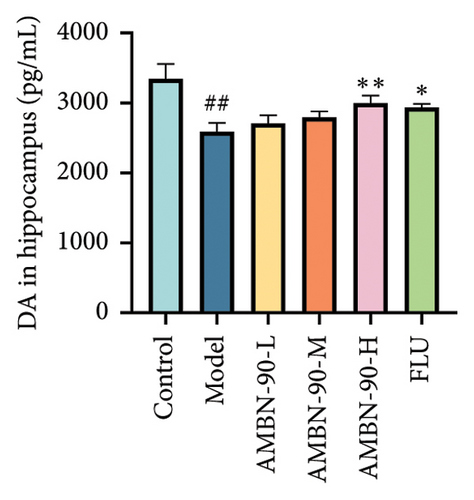
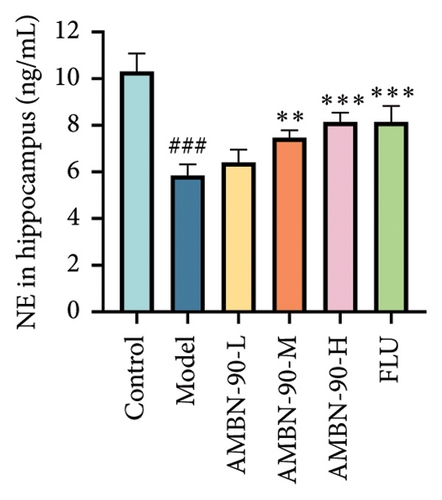
The changes in monoamine neurotransmitter levels in the hippocampus are shown in Figures 6(d), 6(e), and 6(f). Compared to the control group, the model group showed a significant decrease in hippocampal 5-HT levels (p < 0.001). In contrast, the FLU group, as well as the medium- and high-dose groups, exhibited a significant increase in hippocampal 5-HT levels (AMBN-90-L, p < 0.05; AMBN-90-M, p < 0.01; AMBN-90-H and FLU, p < 0.001). Similarly, the model group demonstrated a significant reduction in hippocampal DA levels compared to the control group (p < 0.01). However, the FLU group and the high-dose group showed a significant increase in hippocampal DA levels (AMBN-90-H, p < 0.01; FLU, p < 0.05). Furthermore, the model group exhibited a significant decrease in hippocampal NE levels compared to the control group (p < 0.001). In contrast, the FLU group, as well as the medium- and high-dose groups, showed a significant increase in hippocampal NE levels (AMBN-90-M, p < 0.01; AMBN-90-H and FLU, p < 0.001).
3.8. Western Blot Analysis
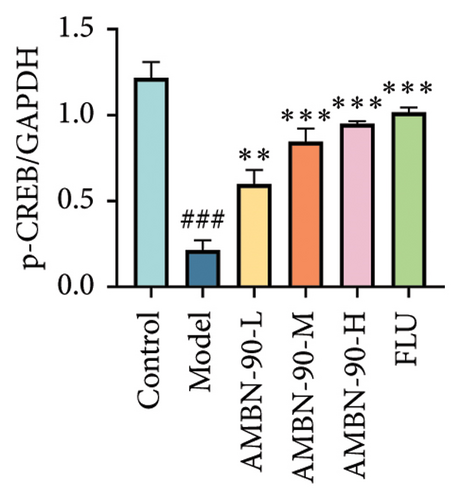
Figures 7(a), 7(b), 7(c), and 7(d) show the expression of PRKACB, CREB, p-CREB, and BDNF in the mouse hippocampus. Compared to the control group, the expression levels of PRKACB, CREB, p-CREB, and BDNF were significantly reduced in the model group (p < 0.001). However, the FLU and AMBN-90 high-dose treatment groups significantly increased the expression of PRKACB, CREB, and p-CREB relative to the model group (p < 0.001; Figures 7(b) and 7(c)). Regarding BDNF, its expression in the hippocampus was significantly elevated in all dose groups of FLU and AMBN-90 (Figure 7(d)) (AMBN-90-L and AMBN-90-M, p < 0.05; AMBN-90-H and FLU, p < 0.001).
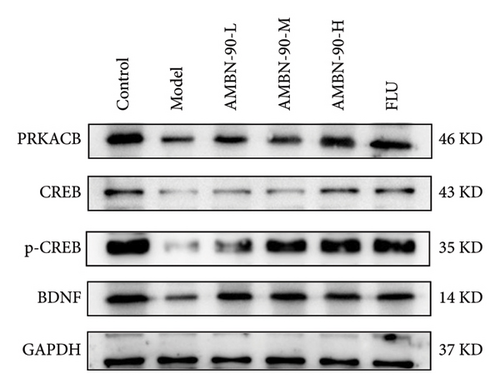
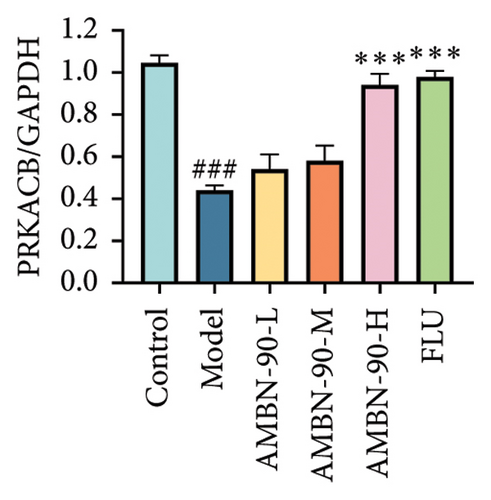
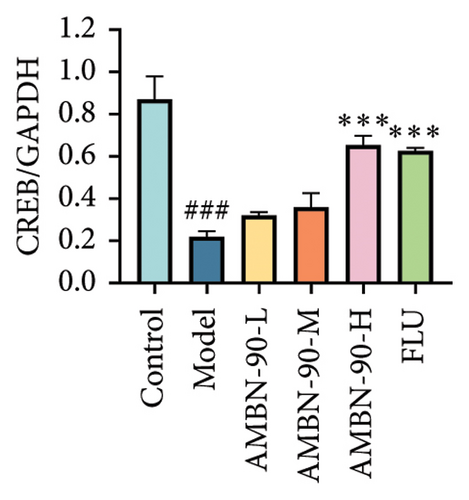
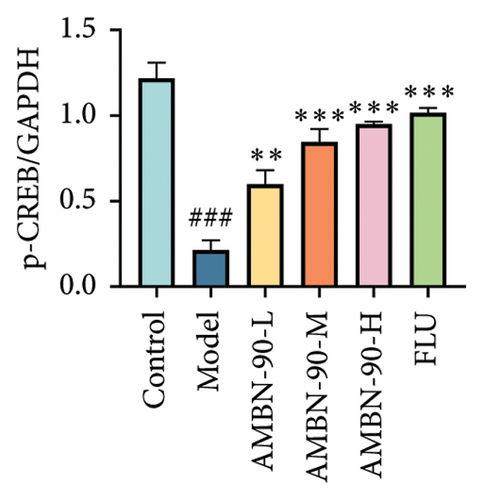
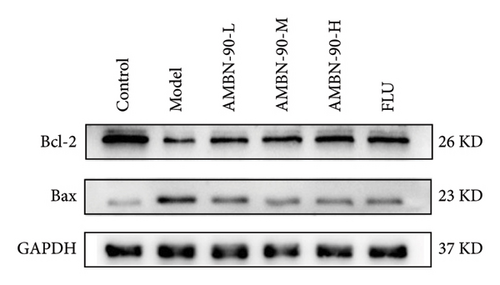
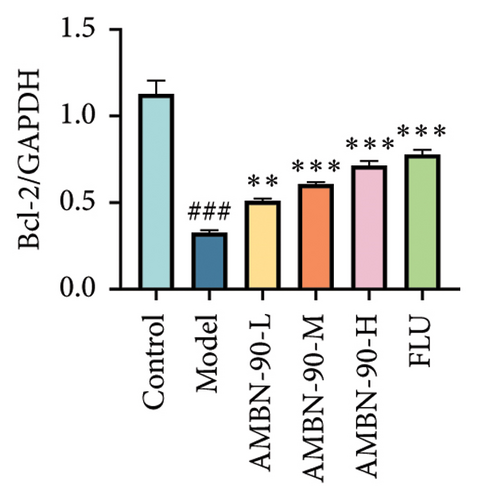

Figures 7(e), 7(f), and 7(g) illustrate the expression of Bcl-2 and Bax in the mouse hippocampus. Compared to the control group, Bcl-2 expression was significantly lower (p < 0.001), and Bax expression was significantly higher (p < 0.001) in the model group. Both FLU and AMBN-90 treatment groups showed varying degrees of improvement in Bcl-2 and Bax levels compared to the model group, with the high-dose AMBN-90 treatment group’s improvement nearing that of FLU (AMBN-90-L, p < 0.01; AMBN-90-M, AMBN-90-H, and FLU, p < 0.001). These findings suggest that AMBN-90 may modulate BDNF expression and inhibit neuronal apoptosis via the PKA–CREB–BDNF pathway, thereby alleviating depression-like symptoms.
3.9. Molecular Docking
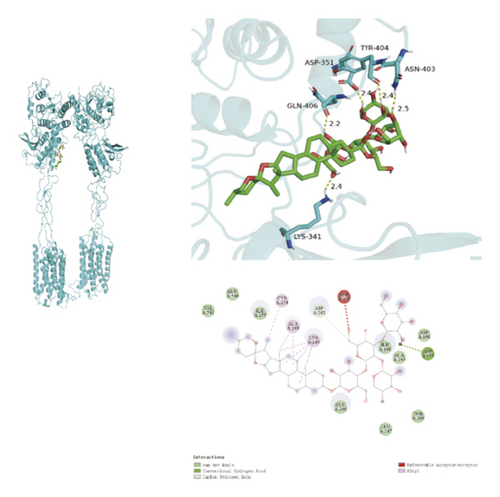
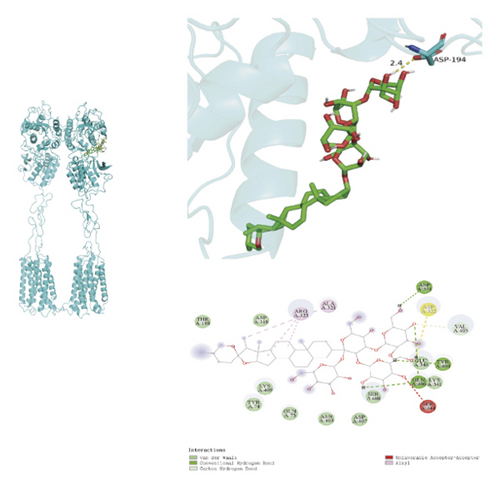
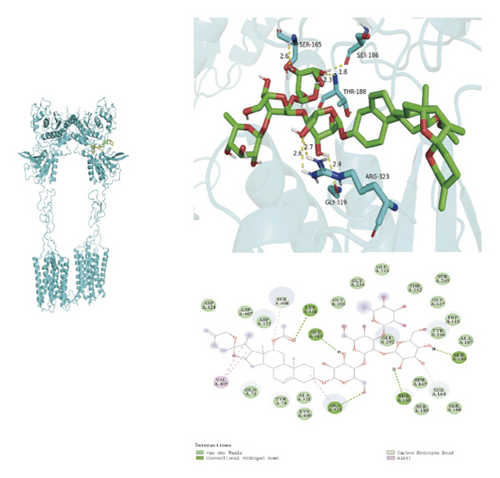
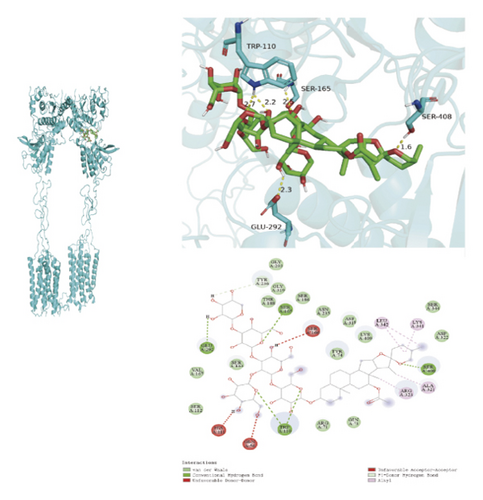
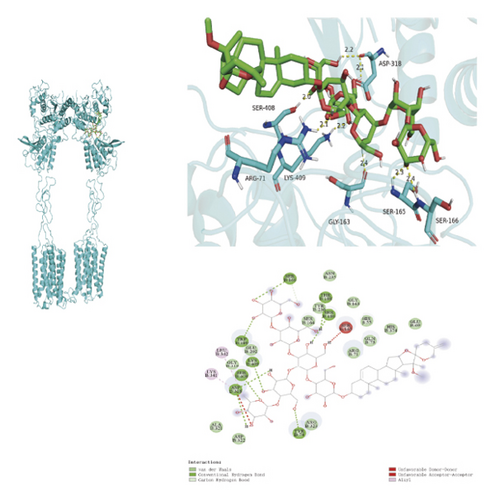
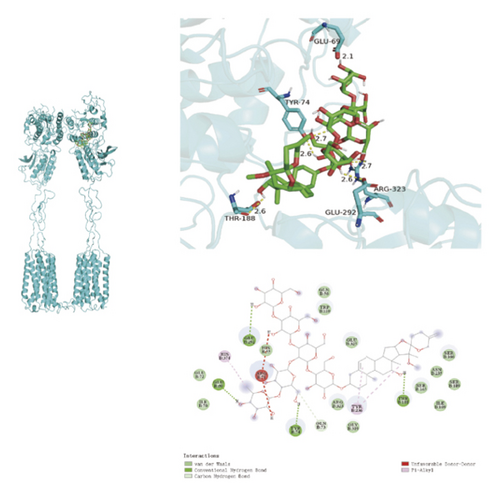
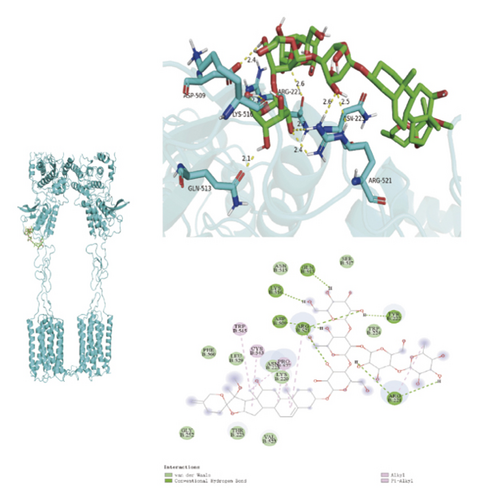
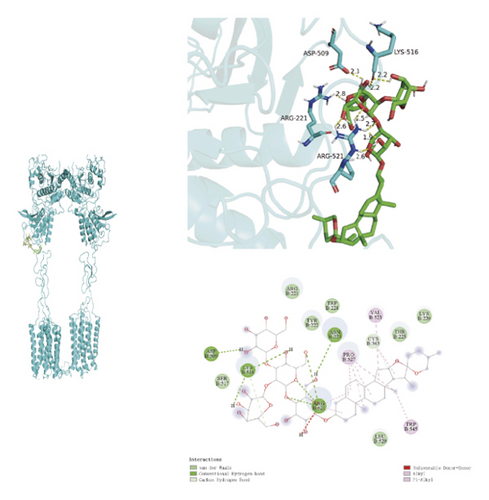
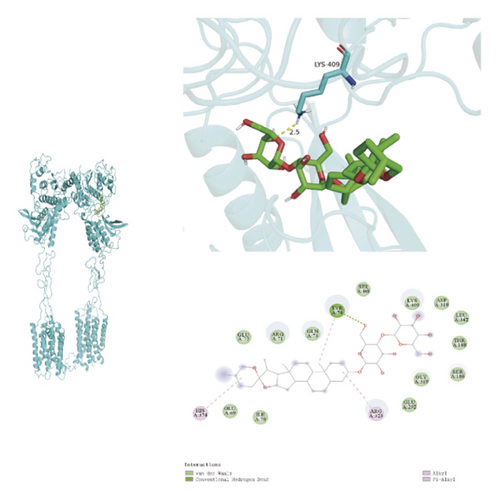
To ascertain if AMBN-90’s constituents could engage with GPCR and initiate the subsequent PK–CREB–BDNF signaling cascade, molecular docking studies were conducted on nine components with GPCR. The outcomes, depicted in Figure 8 and Table 2, demonstrated varying degrees of interaction between these components and GPCR, with all binding sites located in the GPCR’s extramembrane region. Binding energy magnitude visually represents binding capacity; a greater absolute binding energy value correlates with enhanced receptor–ligand affinity and conformational stability. Generally, a binding energy below −5 kcal/mol signifies robust binding activity between the ligand and receptor [33, 34]. Furthermore, the binding energies of all components to GPCR fell below −7 kcal/mol, indicating a high affinity of the compound for protein. The hydrogen bonding force is the key force in the binding of small molecule compounds to proteins, and the number of hydrogen bonds is closely related to the binding stability. As shown in Figure 9 and Table 2, odospiroside binds to four amino acid residues of C-type GPCR proteins through nine hydrogen bonds. Macrostemonoside W and Macrostemonoside Y bind to seven and six amino acid residues of C-type GPCR proteins through eight hydrogen bonds, respectively, and Macrostemonoside U and Macrostemonoside X bind to five amino acid residues of C-type GPCR proteins through eight hydrogen bonds, and Macrostemonoside A and Macrostemonoside V bind to five and four amino acid residues of C-type GPCR proteins through five hydrogen bonds, respectively. In contrast, odospiroside and etigogenin-3-O-β-D-glucopyranosyl(1 ⟶ 4)-O-β-D-galactopyranoside bound to only 1 amino acid residue of the C-type GPCR protein through 1 hydrogen bond. This indicates that odospiroside, Macrostemonoside W, Macrostemonoside Y, Macrostemonoside U, Macrostemonoside X, Macrostemonoside A, and Macrostemonoside V have strong binding capacity and strong binding ability with C-type GPCR proteins. These are proteins with strong binding ability and binding stability.
| No | Name of component | Number of hydrogen bonds | Amino acid residues | Binding energy (kcal/mol) |
|---|---|---|---|---|
| A | Dongnoside E | 1 | ASP-194 | −7.3 |
| B | Macrostemonoside A | 5 | LYS-341, GLN-406, ASP-351, TYR-404, ASN-403 | −7.6 |
| C | Macrostemonoside U | 6 | GLY-319, ARG-323, THR-188, SER-186, SER-165 | −8.3 |
| D | Macrostemonoside V | 5 | TRP-110, SER-165, SER-408, GLU-292 | −7.5 |
| E | Macrostemonoside W | 8 | SER-166, SER-165, GLY-163, LYS-409, ARG-71, SER-408, ASP-318 | −8.4 |
| F | Macrostemonoside X | 6 | THR-188, GLU-292, ARG-323, TYYR-74, GLU-69 | −7.5 |
| G | Macrostemonoside Y | 8 | GLN-513, ARG-521, ASN-223, ARG-22, LYS-516, ASP-509 | −7.6 |
| H | Odospiroside | 9 | ARG-521, ARG-221, ASP-509, LYS-516 | −8 |
| I | Tigogenin-3-O-β-D-glucopyranosyl(1 ⟶ 4)-O-β-D-galactopyranoside | 1 | LYS-409 | −7 |
4. Discussion
AMB is a traditional Chinese medicine renowned for its qi-moving and stagnation-alleviating properties, yang-promotion and knot-dispersing capabilities, and high medicinal and food value [7]. While the antidepressant effects of AMB are documented, the specific active components and their mechanisms of action require further investigation.
Hippocampal neuronal damage and death are linked to a range of neurological disorders, including MDD, a psychiatric condition [28, 29]. Consequently, this study utilized mouse hippocampal neuronal cells to perform in vitro experiments, initially screening the neuroprotective effects of various polar fractions of AMB against glutamate-induced HT22 cell injury. Following a systematic refinement process, the fraction AMBN-90 exhibited significant neuroprotective activity. HPLC–ELSD analysis was conducted on AMBN-90 to ascertain its saponin composition, revealing a predominance of spirostanol-type saponins. This finding suggests that spirostanol saponins may be the principal antidepressant constituents in AMB. Utilizing the CUMS model, the most widely recognized, reliable, and effective rodent model for depression [35], we confirmed the antidepressant efficacy of AMBN-90 by testing behavioral responses, changes in hippocampal pathology, and midhippocampal levels of 5-HT, DA, and NE in CUMS mice administered AMBN-90.
Cyberpharmacology is an emerging discipline that applies systems biology theory to study the drug-therapeutic target relationship [25]. This study employed network pharmacological analyses to predict the pathways and targets through which AMBN-90 exerts its antidepressant effects. PPI, GO, and KEGG enrichment analyses indicate that AMBN-90 is closely associated with antidepressant effects, primarily acting on synaptic structures and influencing postsynaptic membrane receptor’s GPCR activity, signaling through cAMP, and activating the downstream PKA–CREB–BDNF signaling pathway.
The pathophysiology of depression is closely related to the intracellular secondary messenger system. cAMP, an intracellular secondary messenger, promotes neuronal differentiation and survival [36, 37], as well as neuronal remodeling [38]. cAMP activates PKA, which phosphorylates CREB, mediating BDNF expression [39]. BDNF, a neurotrophic factor induced by CREB phosphorylation, is crucial for neuronal survival, maintenance, and growth [40]. Reduced BDNF levels in depressed patients and animal models suggest it as a depression biomarker [41, 42]. In addition, Bcl-2, regulated by CREB, is a neuroprotective factor and inhibitor of neuronal cell death, important for cell survival and the development of new neurons and synapses [43].
Bcl-2, an antiapoptotic protein, inhibits apoptosis when overexpressed. Variations in Bcl-2 expression may contribute to stress-induced depressive behaviors [44], while diminished Bcl-2 levels have been documented in bipolar disorder [45]. In contrast, the proapoptotic protein Bax serves an antagonistic function to Bcl-2. The equilibrium between Bcl-2 and Bax is essential for the regulation of apoptosis and cellular viability [46]. This study’s findings indicate that FLU and AMBN-90 treatment markedly restored the decreased expression levels of PRKACB, CREB, BDNF, Bcl-2, and Bax in the hippocampus of CUMS mice. These results suggest that AMBN-90 may mediate its antidepressant effects via the PKA–CREB–BDNF signaling pathway and by impeding apoptotic processes.
GPCRs constitute the most extensive family of membrane receptor proteins in humans, playing pivotal roles in cell signaling [47]. GPCRs are categorized into four classes, A, B, C, and F, based on structural and sequence diversity. Notably, Class C receptors are implicated in a variety of neurological and psychiatric conditions, such as epilepsy, pain, anxiety, depression, and schizophrenia [48]. In this context, our study conducted molecular docking analyses with nine constituents of AMBN-90 targeting Class C GPCRs. The findings revealed high-affinity binding of each constituent to GPCRs, suggesting that AMBN-90’s components may engage with GPCRs to initiate the downstream PKA–CREB–BDNF signaling pathway, as illustrated in Figure 9.
In summary, our preliminary results suggest that AMBN-90 can significantly alleviate depression induced by CUMS in mice. However, there are still limitations to consider. Further studies are needed to determine the safe dosage of AMBN-90 and the threshold for potential toxicity, which should be assessed through larger-scale preclinical experiments, including animal models of different species and investigations at varying dose levels. In addition, more long-term studies are required to evaluate the efficacy and safety of AMBN-90 for prolonged use, ensuring that it does not lead to significant dependence or resistance. From a clinical perspective, given AMB’s established medicinal and nutritional properties, it may be worth exploring whether AMBN-90 could be used as a dietary support in combination with traditional medicines to enhance therapeutic effects. Alternatively, it could serve as an adjunctive therapy, offering new options for patients who do not respond well to current treatments.
5. Conclusion
The present study is a preliminary exploration of the components of AMB that exert antidepressant effects. According to the present results, spirostanol-type saponins in AMB have significant antidepressant effects. In an in vitro screening assay, AMBN-90 showed neuroprotective activity beyond other components. In vivo experiments demonstrated that AMBN-90 alleviated depression-like behaviors in CUMS mice, mitigated hippocampal neuronal damage, and increased levels of 5-HT, DA, and NE in the hippocampus. Its antidepressant mechanism may be through interacting with GPCR, thus activating the PKA–CREB–BDNF signaling pathway and inhibiting neuronal apoptosis. Overall, this study lays the foundation for the identification of individual compounds responsible for the antidepressant response of AMB and the development of spirostanol-type saponins in AMB an antidepressant dietary support.
Conflicts of Interest
The authors declare no conflicts of interest.
Author Contributions
Weixing Ding: writing–original draft, methodology, data curation, and conceptualization. Yu Sun: methodology and conceptualization. Jianfa Wu: methodology and conceptualization. Hongyan Li: methodology and conceptualization. Zengfa Wang: methodology and conceptualization. Wei Li: methodology and conceptualization. Leiling Shi: investigation. Jing Zhang: supervision and funding acquisition. Lulu Wang: supervision. All authors contributed equally to this work. Yu Sun and Jianfa Wu are co-first authors.
Funding
This research was supported by the Jilin Science and Technology Development Program Project (20240305012YY).
Acknowledgments
The author would like to thank figdraw for their support in making the map.
Supporting Information
Supporting Information can be found in the document Spectra of mixed standards of each single component.
Open Research
Data Availability Statement
The data that support the findings of this study are available from the corresponding author upon reasonable request.


