Liquiritin Ameliorates Palmitic Acid-Induced Hepatic Steatosis in Mouse Primary Hepatocytes by Suppressing the VEGFA Signaling Pathway
Abstract
Nonalcoholic fatty liver disease (NAFLD) has become a global pandemic, imposing a significant socioeconomic burden. Hepatic steatosis is a key pathological event in NAFLD. However, there is still lack of effective drugs for NAFLD treatment. Liquiritin (LIQ), derived from licorice root, exhibits antioxidative and anti-inflammatory properties, making it valuable in managing various conditions such as dermatological disorders, respiratory ailments, and gastritis. Here, we investigated the impact and underlying mechanisms of LIQ on hepatic steatosis in mouse primary hepatocytes (MPHs). Our study found that LIQ significantly decreased palmitic acid (PA)-induced lipid accumulation in MPHs. Additionally, LIQ remarkably increased the mRNA expression of Cpt1a, PPARα, Ehhadh, Cyp4a10, and Acox1, suggesting that LIQ achieves its lipid-lowering effect by regulating mitochondria-mediated lipid β-oxidation. Furthermore, the regulatory effect of LIQ on the mitochondrial oxidative phosphorylation (OXPHOS) process was confirmed by Seahorse analysis. Mechanistically, bioinformatics analysis predicted VEGFA as a crucial target mediating the beneficial effects of LIQ against PA-induced lipid accumulation in MPHs. Notably, treatment with purified VEGFA protein partially counteracted the lipid-lowering properties of LIQ. Additionally, our data showed that LIQ promoted VEGFA degradation through the ubiquitin–proteasome pathway. Therefore, our findings not only confirm the lipid-lowering effects of LIQ in MPHs but also identify VEGFA as its potential target. These results highlight the therapeutic promise of LIQ in managing NAFLD and introduce VEGFA as a novel target for treating hepatic steatosis.
1. Introduction
Nonalcoholic fatty liver disease (NAFLD) is strongly associated with the global surge in obesity and metabolic syndrome [1]. The gravest concern revolves around its propensity to advance from simple hepatic steatosis to nonalcoholic steatohepatitis (NASH), ultimately culminating in liver fibrosis, cirrhosis, and potentially hepatocellular carcinoma (HCC) [2]. Additionally, NAFLD is strongly correlated with metabolic disorders including cardiovascular disease, type 2 diabetes, and chronic kidney disease [3, 4]. Treatment has predominantly focused on lifestyle modifications, including dietary adjustments and increased physical activity. Concurrently, ongoing research is investigating the potential of insulin sensitizers, antioxidants, and anti-inflammatory drugs [5]. However, there is still lack of effective drugs for NAFLD treatment.
Traditional Chinese medicines have gained significant attention for their distinct advantages, which include multitarget and multichannel mechanisms. Monomeric compounds derived from Chinese herbs have demonstrated therapeutic effects in treating NAFLD through various pathways, including inflammation, lipid production, insulin sensitivity, mitochondrial dysfunction, autophagy, and gut microbiota [6–8]. Liquiritin (LIQ) is a flavonoid compound that features a flavonoid backbone and a glucose molecule. It demonstrates robust antioxidant properties, capable of scavenging free radicals and shielding cells from damage caused by oxidative stress. In addition, LIQ harbors anti-inflammatory properties and is utilized in dermatology to address pigmentation and spots by suppressing melanin production. LIQ has been employed for the treatment of diverse ailments, such as skin disorders, cough, and gastritis [9, 10]. Although both LIQ and glycyrrhizic acid are derived from licorice, they differ in chemical structure and exhibit distinct pharmacological effects. Glycyrrhizic acid is primarily recognized for its anti-inflammatory, antiviral, and hepatoprotective effects, whereas LIQ is valued for its antioxidant, anti-inflammatory, and skin-lightening properties [11, 12]. However, the role of LIQ in the hepatic steatosis remains elusive.
Substantial progress has been made in understanding the VEGFA signaling pathways in NAFLD. Studies suggest that VEGFA, especially derived from hepatocytes, plays a significant role in the progression of NAFLD toward more severe conditions, such as HCC. This progression is closely linked to the activation of hepatic stellate cells, which are central to liver fibrosis development. These findings strongly suggest targeting hepatocyte-derived VEGFA as a promising therapeutic approach to combat NAFLD and its progression to HCC. Hence, it may offer a more effective means of treating NAFLD by targeting the VEGFA-associated pathways [13]. An additional aspect of VEGF signaling, particularly through VEGF-B, has been implicated in the pathogenesis of NAFLD. Its role in modulating lipolysis within white adipose tissue (WAT) is critical. Studies have shown that pharmacological inhibition of VEGF-B signaling can significantly mitigate hepatic steatosis and NAFLD by reducing lipolysis in WAT [14, 15]. This discovery underscores the potential of VEGF-B antagonism as a novel strategy for tackling NAFLD, specifically targeting hepatic steatosis through lipolysis inhibition. These studies establish the critical roles of both VEGFA and VEGF-B signaling pathways in NAFLD’s pathogenesis and progression, thereby paving the way for the development of innovative treatment and management approaches for the disease [16].
In this study, we aimed to explore the therapeutic potential and underlying mechanisms of LIQ in the treatment of fatty liver diseases using the palmitic acid (PA)-induced mouse primary hepatocytes (MPHs) cell model. We demonstrated the significant ameliorating effects of LIQ on fatty liver symptoms induced by PA in MPHs. Mechanistically, VEGFA was identified as a crucial target mediating the beneficial effects of LIQ on lipid accumulation induced by PA in MPHs. Notably, treatment with purified VEGFA protein partially counteracted the lipid-lowering properties of LIQ. This discovery not only introduces a promising candidate drug for the treatment of fatty liver diseases but also highlights the crucial involvement of LIQ in modulating lipid metabolism and antioxidant defense mechanisms.
2. Materials and Methods
2.1. Chemicals and Reagents
LIQ (purity = 99.68%) was purchased from MCE (No. HY-N0376). Palmitate, purchased from Sigma-Aldrich (P0500, Germany), was used to induce hepatic steatosis in cells. The measurement of triglycerides, essential for evaluating lipid accumulation in cells, was conducted using specialized enzyme kits from the indicated sources: Triglyceride (A110-1-1, Jiancheng Biotech, Nanjing, China).
2.2. Cell Culture
Primary mouse hepatocytes were isolated using a two-step collagenase perfusion method, ensuring high cell viability and functionality [17, 18]. These hepatocytes were cultured in high-glucose Dulbecco’s modified Eagle medium (DMEM, 12800-017, Gibco, USA) supplemented with 10% fetal bovine serum (FBS, RY-F22-01, Royabio, China), penicillin–streptomycin, and other essential nutrients to provide an optimal environment. Hepatic steatosis was induced in these cells by exposure to 0.2 mM PA, creating an in vitro model of hepatic steatosis for testing the effects of LIQ.
2.3. Cell Counting Kit-8 (CCK-8) Assay
Cell viability was determined using CCK-8 assay (K1018, APExBIO, USA). Briefly, cells (3 × 10³ per well) were planted into 96-well plates for 24 h and exposed to different treatments for 24 h. The culture medium was discarded, and the cells were incubated with CCK-8 (10 μL) at 37°C for 1 h. Finally, the OD value at 450 nm was measured.
2.4. Cellular Triglyceride Detection
MPHs were lysed using 0.1% Triton X-100 and subsequently assessed for intracellular triglyceride levels using commercial kits, following the manufacturer’s instructions (A110-1-1, Jiancheng Biotech, Nanjing, China).
2.5. Oil Red O Staining
Oil Red O staining, a method for visualizing lipid accumulation in cells, was used to assess the formation of lipid droplets in hepatocytes. This technique involves staining cells with Oil Red O (O0625, Sigma-Aldrich, USA), a lysochrome diazo dye that specifically stains neutral triglycerides and lipids. The stained lipid droplets were observed under a microscope to allow for both qualitative and quantitative evaluation of lipid accumulation in the cells. ImageJ software was then used to analyze the Oil Red O-stained areas.
2.6. Nile Red Staining
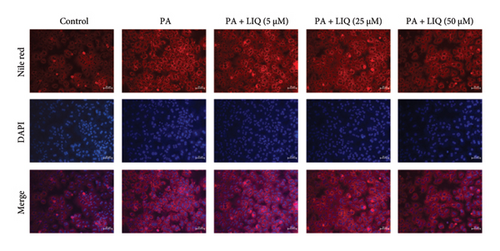
For Nile red (Sigma, St. Louis, MO, USA) staining, MPHs were fixed as 4% paraformaldehyde for 30 min at room temperature and then co-incubated with 0.1 mg/mL Nile red and 10 μg/mL DAPI for 10 min. After washing three times with PBS for 5 min each time, Nile red-stained neutral lipids (red) and DAPI-stained nuclei (blue) were photographed with a Nikon fluorescence microscope (400x magnification, ECLIPSE, Ts2R-FL, Tokyo, Japan).
2.7. Protein Half-Life Analysis
The half-life of VEGFA protein was measured by the cycloheximide (CHX, Amresco, code 94271-1G, USA) chase assay. MPHs were incubated in DMEM containing 50 μM LIQ in the presence of 10 μg/mL CHX. Cells were harvested at the indicated time points and subjected to Western blot analysis.
2.8. Protein Degradation Pathway Analysis
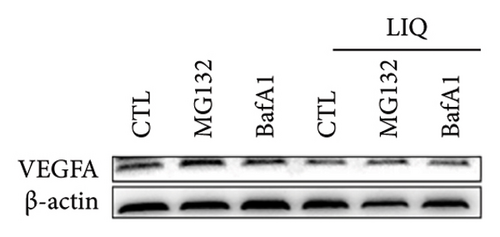
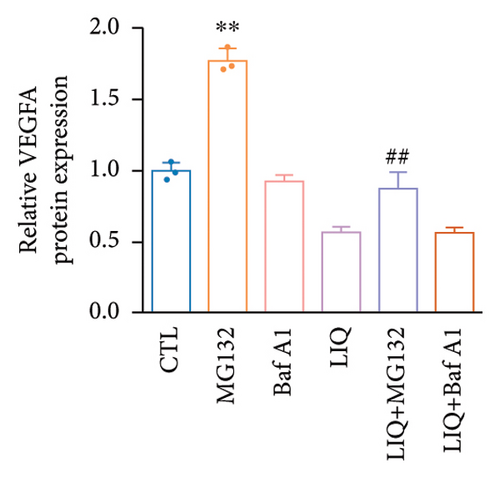
The degradation pathway of VEGFA protein was measured by immunoblots. MPHs were incubated in DMEM containing 50 μM LIQ for 18 h, and the cells were treated with the indicated inhibitors (Baf A1, 40 nM; MG132, 10 μM) for 6 h before western blotting.
2.9. Cell Mitochondria Stress Test
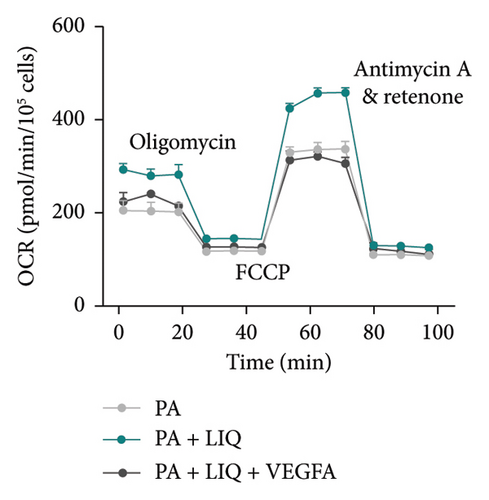
Mitochondrial function in MPHs was evaluated using the Seahorse XF Analyzer, a state-of-the-art instrument that measures the oxygen consumption rate (OCR) in living cells. The Mito Stress assay was run as described in the test kit protocol (Agilent Technologies, Santa Clara, CA, USA) with oligomycin (1 μM), FCCP (2 μM), and rotenone/antimycin A (0.5 μM). Following the Seahorse XF Analyzer run, the results were obtained, providing critical insights into mitochondrial respiration. This analysis is key for understanding the impact of LIQ on lipid β-oxidation.
2.10. RT-qPCR Analysis
The mRNA expression levels of genes related to lipolysis, lipogenesis, and lipid β-oxidation were quantified using RT-qPCR. Total RNA was extracted using RNA isolator Total RNA Extraction Reagent (R401-01, Vazyme Biotech, China) and examined using a NanoDrop-1000 spectrophotometer (Thermo Fisher, Waltham, MA, USA) to check the concentration. Reverse transcription to cDNA was implemented using a HiScript III All-in-one RT SuperMix (R333-01, Vazyme Biotech, China) or miRNA 1st Strand cDNA Synthesis Kit (R401-01, Vazyme Biotech, China). Genes’ mRNA levels were quantified by ChamQ SYBR qPCR Master Mix (Q321-02, Vazyme Biotech, China) and evaluated by the 2−ΔΔCt method. Mouse 36B4 was used as an internal control. A complete list of PCR primers is given in Supporting Table S1.
2.11. Western Blotting
Western blotting was employed to analyze the protein expression of VEGFA. Total protein was extracted, followed by an examination of protein concentration using the BCA kit (E112-02, Beyotime, China). The quantified protein was then denatured by sodium dodecyl sulfate–polyacrylamide gel electrophoresis and transferred to a polyvinylidene fluoride membrane (IPVH00010, Millipore, USA). Then, the membrane blocked with 5% nonfat milk was counteracted with primary antibodies as well as horseradish peroxidase-labeled secondary antibodies and viewed under an optical luminometer (GE, TX, USA). The antibody against VEGFA (Cat. No. 19003-1-AP, 1:1000 dilution) was purchased from Proteintech Group.
2.12. Reverse Pharmacophore Screening
To forecast the potential molecular target of LIQ, we utilized SwissTargetPrediction for preliminary analysis. Following this, we conducted a STRING analysis (https://string-db.org) to elucidate the functional protein association networks. For the molecular docking analysis, we retrieved the 3D structures of the target candidates from the Protein Data Bank (PDB) (https://www.rcsb.org/), specifically selecting entries for “Homo sapiens” and “Mus Musculus.” The 3D conformers of the candidate compounds were obtained from the PubChem database (https://pubchem.ncbi.nlm.nih.gov/) in SDF format. These structures were then imported into MOE to determine the docking scores. A higher absolute docking score indicates a more favorable binding affinity.
2.13. Statistical Analysis
Data analysis was performed using t-tests and analysis of variance (ANOVA) to compare the differences between the control and treated groups. p values less than 0.05 were considered statistically significant.
3. Results
3.1. LIQ Decreases PA-Induced Lipid Accumulation in MPHs
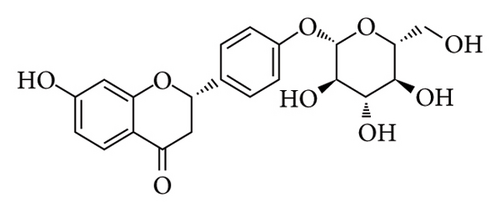
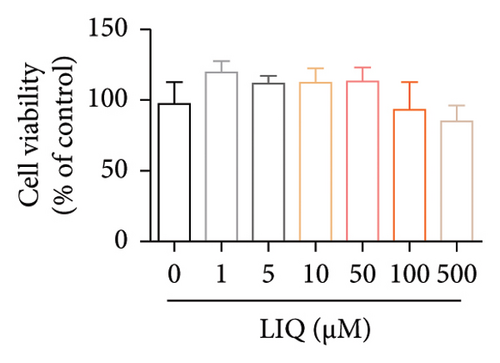
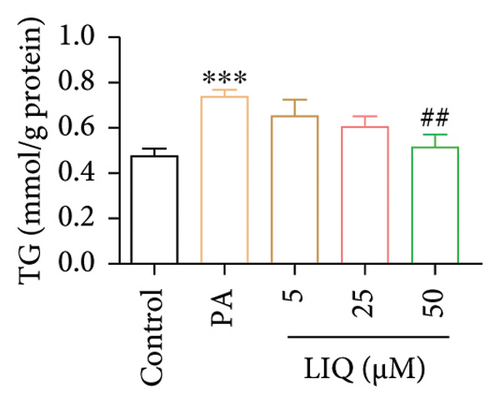
To investigate the effects of LIQ on cellular metabolism and lipid accumulation, a series of biomedical experiments were conducted. The molecular structure of LIQ is shown in Figure 1(a). As shown in Figure 1(b), cells were treated with various concentrations of LIQ on cell viability ranging from 0 to 50 μM. It was observed that cell viability remained steady at low concentrations of LIQ, while a slight decrease at higher concentrations suggested that high concentrations of LIQ might have a mild toxic effect on the cells. Furthermore, the impact of LIQ concentration on cellular triglyceride content was determined. In both the PA-treated control group and the groups treated with low LIQ concentration and PA, the triglyceride content was higher, whereas it was significantly reduced in the groups treated with high LIQ concentration (Figure 1(c)). This suggests that LIQ may effectively decrease lipid accumulation within cells at specific concentrations. Additionally, the intensity of Oil Red O staining generally reflected the extent of lipid accumulation in the cells. Significant staining was observed in the PA groups, indicating pronounced lipid accumulation (Figure 1(d)). However, in PA + LIQ groups, particularly at higher LIQ concentrations, the staining appeared less intense, suggesting a reduction in lipid accumulation. Furthermore, LIQ treatment significantly alleviated PA-induced steatosis in MPHs, as evidenced by a marked reduction in lipid droplet accumulation, confirmed by Nile Red staining (Figure 1(e)). Overall, these findings underscore LIQ’s potential impact on cellular metabolism and lipid accumulation, offering valuable insights into its role in disease-related metabolic pathways.

3.2. LIQ Regulates the Expression of Genes Involved in Lipid Metabolism in MPHs
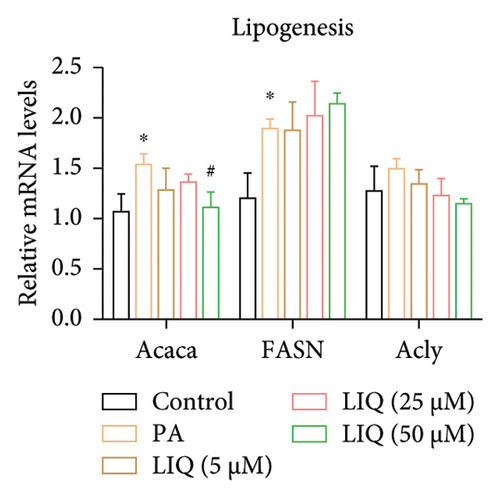
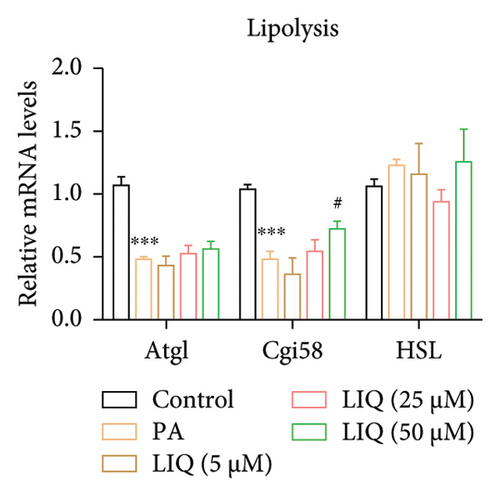
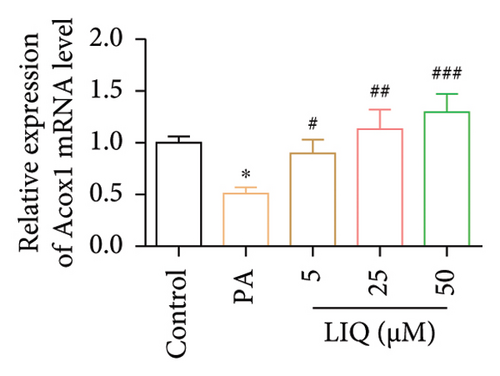
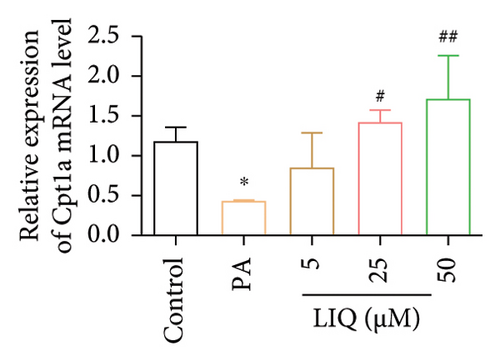
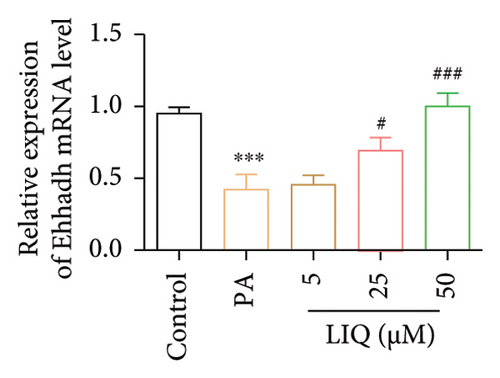
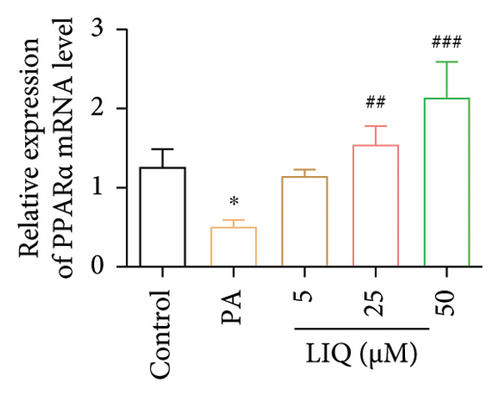
To further reveal the effects of LIQ on the lipid metabolism in MPHs, the mRNA levels of genes involved in lipid synthesis (Acaca, FASN, Acly) and lipolysis (Atgl, Cgi58, HSL) were detected in MPHs treated with different concentrations of LIQ. As shown in Figures 2(a) and 2(b), our findings indicated that PA treatment led to a significant increase in the mRNA levels of genes involved in lipid synthesis (Acaca, FASN) and a decrease in the mRNA levels of genes associated with lipolysis (Atgl, Cgi58) and fatty acid β-oxidation (Cpt1a, PPARα, Ehhadh, Cyp4a10). LIQ decreased the mRNA levels of Acaca, while increased the mRNA levels of Cgi58, Acox1, Cpt1a, PPARα, Ehhadh, and Cyp4a10. This observation suggests that LIQ’s mechanism of action primarily involves enhancing fatty acid β-oxidation. This hypothesis is supported by the data presented in Figures 2(c), 2(d), 2(e), 2(f), and 2(g), which collectively indicated that LIQ attenuated PA-induced lipid accumulation in hepatocytes by modulating the fatty acid β-oxidation pathways.

3.3. LIQ Rescues PA-Impaired Mitochondrial Respiratory Capacity of MPHs
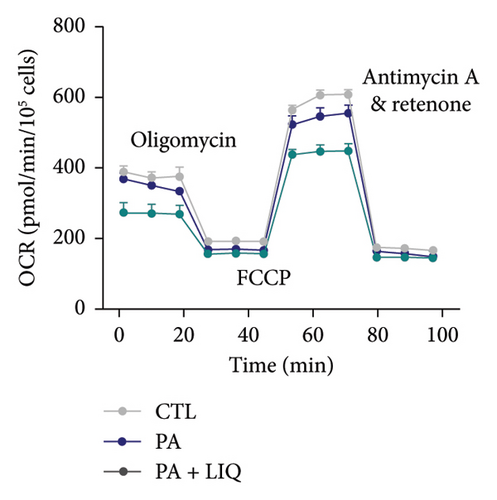
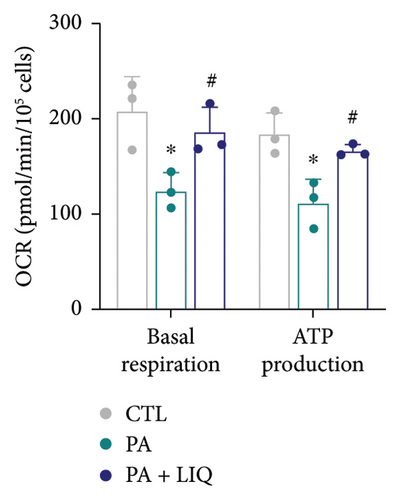
Subsequently, to explore the alterations in cellular OCR of primary mouse hepatocytes treated with PA and LIQ under various conditions, we conducted a detailed analysis of the changes in OCR related to basal respiration and ATP synthesis. During the assay, basal respiration is initially measured under normal conditions. Next, the ATP synthase inhibitor oligomycin is added, and the subsequent reduction in oxygen consumption indicates the portion used for ATP synthesis. As depicted in Figures 3(a) and 3(b), the OCR of the PA-treated group showed a significant decrease in both basal respiration and ATP synthesis compared to the control group. Notably, the OCR of the PA + LIQ treatment group exhibited a significant increase in these two parameters compared to the PA group and even surpassed the control group specifically in ATP synthesis. This finding implies that LIQ could potentially boost the capacity for ATP synthesis and suggests that PA and PA + LIQ treatments can modify cellular metabolic activity, notably impacting energy production within cells.
3.4. VEGFA Serves as a Potential Target of LIQ
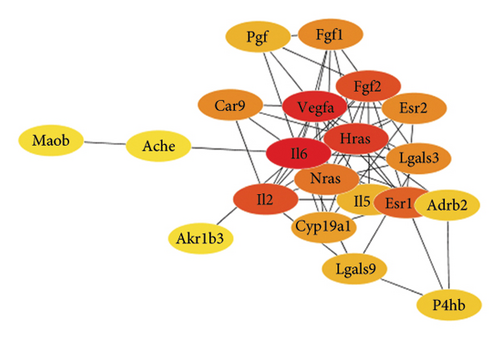
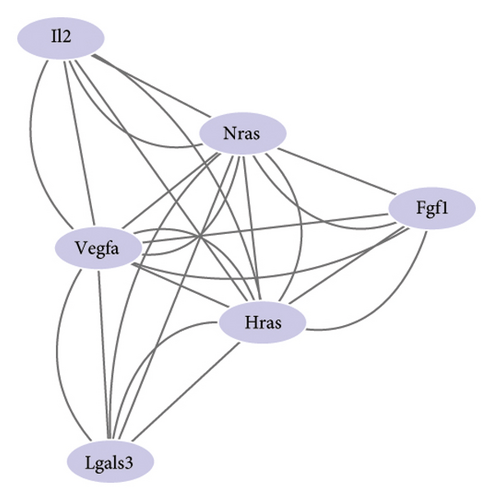
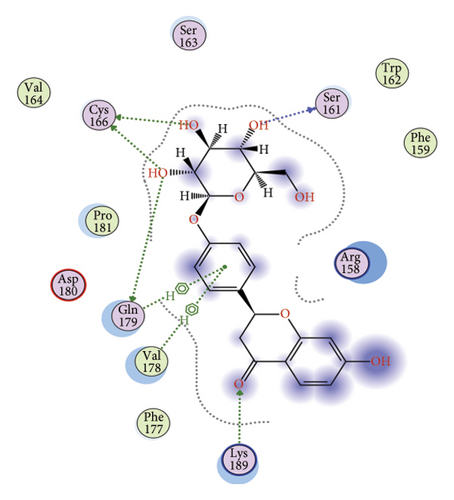
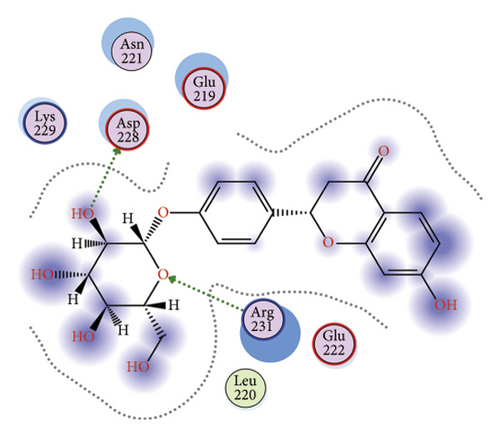
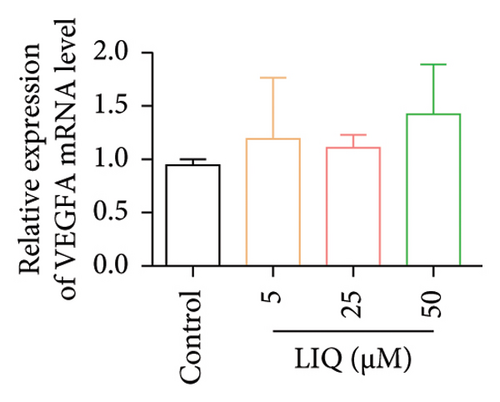
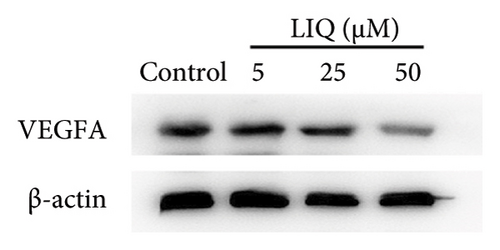
To gain a comprehensive understanding of the molecular effects of LIQ on specific genes, proteins, and biological pathways, we performed analyses using SwissTargetPrediction and STRING. As shown in Figures 4(a) and 4(b), VEGFA is positioned at the center of the target network, suggesting that VEGFA could potentially serve as the molecular target of LIQ. To further substantiate this, a MOE analysis was conducted, revealing that LIQ exhibits functional binding capabilities with both human and mouse VEGFA (Figures 4(c) and 4(d)). Based on the above results, we speculated that VEGFA might be a potential target of LIQ. Then, we examined the effects of LIQ on the expression of VEGFA. As shown in Figures 4(e) and 4(f), LIQ did not affect the mRNA expression of VEGFA, while decreased the protein levels of VEGFA in a dose-dependent manner. These results confirm the inhibitory effect of LIQ on VEGFA expression.
3.5. LIQ Promotes VEGFA Degradation Through Ubiquitin-Proteasome Pathway
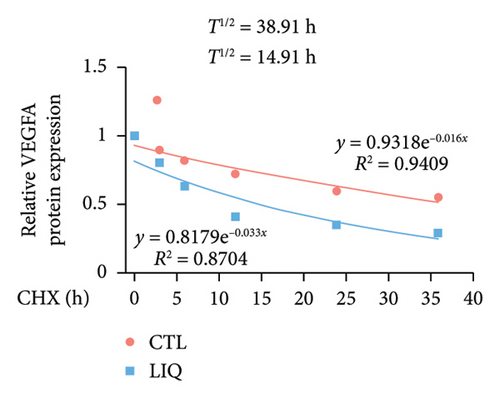
We then examined the influence of LIQ on the stability of VEGFA by the implementation of a CHX test. Western blot results showed that LIQ significantly decreased the half-life of the VEGFA protein after CHX treatment in the MPHs (Figures 5(a) and 5(b)). Subsequently, the proteasome inhibitor MG132 and lysosomal inhibitor bafilomycin A1(BAFA1) were used to further verify the degradation pathway of VEGFA. Our data showed that the effect of LIQ on VEGFA could be blocked by the proteasome inhibitor MG132 (Figures 5(c) and 5(d)). These results suggested that LIQ promotes the degradation of VEGFA protein through ubiquitin–proteasome pathway.

3.6. LIQ Improves PA-Induced Lipid Accumulation in MPHs Through VEGFA
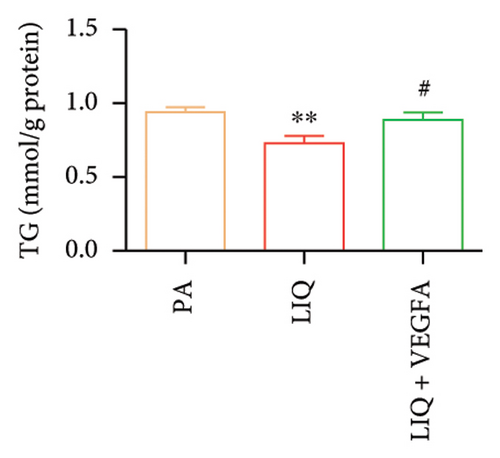
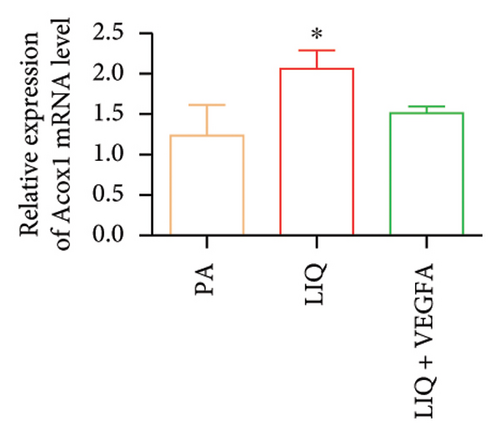
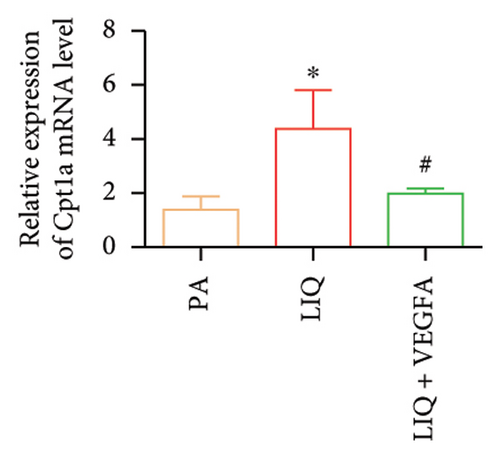
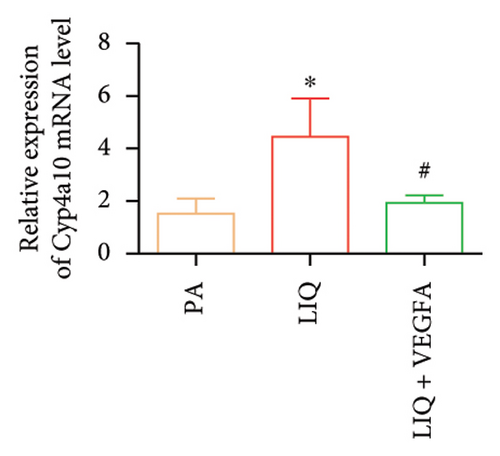
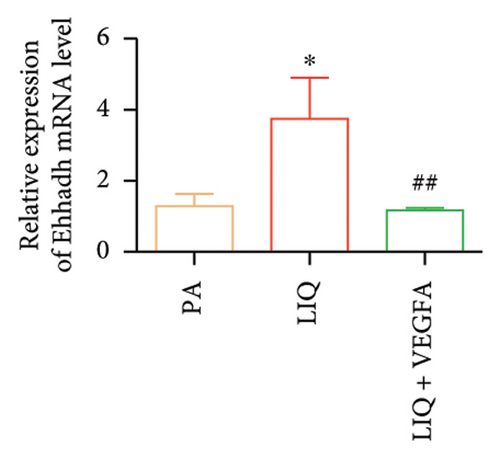
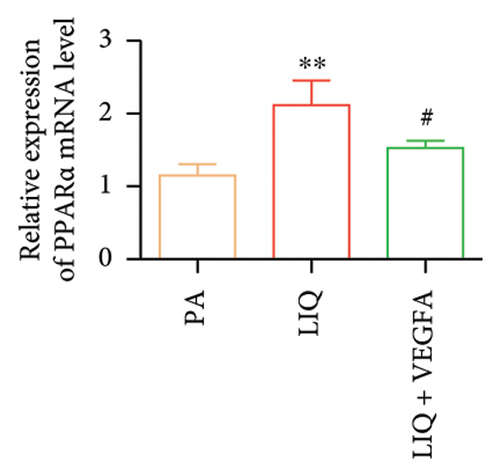
To further evaluate whether LIQ improves PA-induced lipid accumulation in MPHs through VEGFA, MPHs were treated with PA either in the presence or absence of VEGFA. As shown in Figure 6(a), cells treated with PA alone showed a marked increase in Oil Red O staining, indicating significantly elevated lipid accumulation. Notably, the introduction of LIQ treatment significantly reduced this accumulation. However, when VEGFA was administered simultaneously, its effect partially counteracted the improvement of LIQ on PA-induced lipid accumulation. Subsequently, we analyzed the triglyceride content and the relative expression levels of pertinent genes, as depicted in Figures 6(b), 6(c), 6(d), 6(e), 6(f), 6(g). Compared to PA treatment alone, LIQ treatment effectively reduced triglyceride levels. For genes, such as Acox1, Cpt1a, PPARα, Ehhadh, and Cyp4a10, LIQ significantly decreased their mRNA expression levels in PA-treated MPHs. However, VEGFA addition increased the mRNA expression of these genes, indicating that VEGFA is a critical mediator for LIQ’s hypolipidemic effects. These findings suggest that VEGFA serves as a promising target for LIQ, potentially offering therapeutic benefits for diseases characterized by lipid accumulation, such as atherosclerosis or NAFLD.

3.7. LIQ Rescues PA-Impaired Mitochondrial Respiratory Capacity of MPHs Through VEGFA
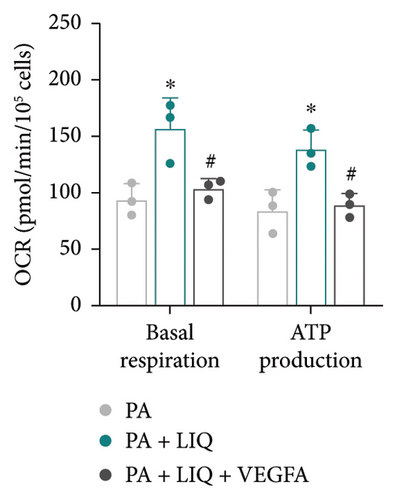
Finally, we determined whether LIQ rescues PA-impaired mitochondrial respiratory capacity of MPHs through VEGFA. As shown in Figure 7(a), the OCR values of PA-treated cells were consistently the lowest at most time points, aligning with previous reports, suggesting that PA may hinder cellular oxidative-reductive activity. In contrast, cells treated with both PA and LIQ exhibited higher OCR values compared to the PA-treated group. However, this increase was partially blocked by VEGFA. This indicates that LIQ may help restore or enhance the oxidative-reductive capacity of cells inhibited by PA treatment, potentially through the regulation of VEGFA. Additionally, the OCR data from MPH mitochondria in Figure 7(b) supported the earlier findings and conclusions. The data clearly indicate that PA treatment hinders cellular oxidative–reductive capacity. Furthermore, the inclusion of LIQ appeared to not only restore but also enhance normal cellular functions, particularly in the crucial process of ATP synthesis. However, the presence of VEGFA reversed this positive effect, emphasizing its potential involvement in cellular performance modulation. Taken together, these results suggest that LIQ improves mitochondrial respiration impaired by PA treatment, while VEGFA counteracts the effect of LIQ.
4. Discussion
Our research has uncovered the potential therapeutic role of LIQ in treating NAFLD, offering valuable insights for future investigations and potential clinical implementations. LIQ effectively reduces lipid accumulation in hepatocytes, directly targeting a critical hallmark of NAFLD [16, 19]. These findings represent a departure from the current treatment approach centered around lifestyle modifications [20]. LIQ offers a new therapeutic strategy that specifically targets lipid metabolism in hepatocytes, providing a key framework for developing innovative strategies to combat NAFLD.
Our study demonstrated that LIQ treatment promotes lipid β-oxidation and ATP production in hepatocytes, establishing a significant finding that contributes to our understanding and potential treatment of metabolic disorders, specifically NAFLD. These findings suggest that LIQ’s therapeutic effects may be attributed to its ability to enhance mitochondrial function [21], aligning with the previous study emphasizing the fundamental role of mitochondrial function in preserving metabolic health [22]. Mitochondria, the main producers of ATP within cells, play a crucial role in cellular metabolic activities. In metabolic disorders such as NAFLD, dysfunctional mitochondria result in disrupted lipid metabolism and inadequate energy production [23]. Consequently, improving mitochondrial function could be a promising approach for treating these diseases. By promoting mitochondrial β-oxidation, LIQ not only enhances ATP production but also has the potential to restore the balance of lipid metabolism [24, 25], ultimately reducing lipid accumulation in MPHs. This mechanism of action provides a scientific basis for LIQ’s potential application in treating NAFLD and may offer valuable insights for developing new therapeutic strategies [26].
Through the integration of bioinformatic analysis and molecular docking studies, our research thoroughly investigates the potential targets of LIQ, including VEGFA [27]. This approach deepens our understanding of LIQ’s interactions with its potential targets, while providing opportunities for the discovery of new therapeutic pathways. By utilizing bioinformatics analysis, we effectively analyze extensive genomic, transcriptomic, and proteomic data to identify potential targets of LIQ. Molecular docking studies then validate and confirm the interactions between these targets and LIQ. However, we found that LIQ treatment can reduce the protein expression of VEGFA, but does not affect its mRNA, suggesting that LIQ may regulate VEGFA at the post-transcriptional level. Since the ubiquitin–proteasome pathway is the main manner for protein degradation. Our results suggested that LIQ promotes the degradation of VEGFA protein through the ubiquitin–proteasome pathway. Our methods build on the research foundation established by the previous researchers [28], By refining and applying these methods, our research not only confirms the effectiveness of these techniques, but also expands their applications, making them more suitable for exploring the therapeutic potential of LIQ. Additionally, our approach has the potential to uncover the specific actions of LIQ on targets such as VEGFA, providing a foundation for developing more targeted treatment strategies. This is especially important for treating diseases involving VEGFA, such as certain types of cancer and eye diseases [29, 30].
Notably, our findings suggest that the supplementation of VEGFA can counteract the effects of LIQ, which is significant for regulating the metabolic state of liver cells. The addition of VEGFA not only potentially impacts gene expression but also may further improve the metabolic condition of liver cells. The depth and breadth of this influence indicate that LIQ and VEGFA may regulate cellular functions through different mechanisms and pathways. First, the counteraction of LIQ’s effects by VEGFA may involve direct modulation of lipid metabolism pathways. LIQ might reduce lipid synthesis or promote its breakdown by affecting specific signaling pathways, while VEGFA could impact lipid utilization and decomposition by enhancing vascular function and tissue oxygenation [31]. This suggests that when VEGFA and LIQ work together, they might balance lipid metabolism in the cell through their interactive mechanisms. Second, this combined treatment’s impact on gene expression might involve multiple metabolic pathways, including but not limited to lipid metabolism. This may include the regulation of inflammatory response pathways and cell survival mechanisms, crucial for treating and managing liver diseases. For instance, regulating these pathways could help reduce liver inflammation and enhance cellular resistance to stress, playing a therapeutic role in diseases such as NAFLD. Additionally, our findings provide new insights into the combined application of VEGFA and LIQ in drug development. This is particularly relevant in treating metabolic diseases such as NAFLD, as our discoveries open new avenues for developing innovative treatment strategies. The successful implementation of this strategy highlights the importance of considering the interactions between different compounds in designing therapeutic approaches.
In summary, this study demonstrates for the first time that LIQ ameliorates the lipid metabolism in PA-induced MPHs via the VEGFA signaling pathway. The findings suggest that supplementation with LIQ or food rich in LIQ may potentially be used as a dietary intervention for the prevention and treatment of NAFLD, providing a new mechanistic understanding of the beneficial effect of con the prevention and treatment of NAFLD. This provides important perspectives and foundations for future research and applications in treating metabolic diseases. While our findings are promising, however, the current research results are limited to in vitro models. Therefore, future research should prioritize conducting in vivo studies to validate these results and investigate their potential for clinical application. Furthermore, we plan to clarify the effect of VEGFA inhibitor (such as bevacizumab) on the improvement of NAFLD, and further study should explore the efficacy of LIQ combined with VEGFA inhibitors in the treatment of NAFLD. Additionally, the specific mechanism by which LIQ regulates VEGFA via the ubiquitin pathway requires further investigation.
Conflicts of Interest
The authors declare no conflicts of interest.
Author Contributions
Z.Q. designed the experiments, collected and analyzed the data, and wrote the first draft of the manuscript. W.Y. contributed to data collection and assisted in data analysis. X.Q., Y.L., C.J., and Z.C. provided technical support and advice. Y.Y. supervised the study, revised the manuscript, and provided important academic guidance throughout the process. All authors reviewed and approved the final version of the manuscript. Z.Q. and W.Y. are cofirst authors.
Funding
This study was supported by grants from the project of Nanjing Municipal Health Commission, Project No. YKK22233, project title: “Study on the correlation between lncRNA DLX6-AS1 regulating the miR-26a/PTEN axis and post-hepatitis liver fibrosis.”
Acknowledgments
We are grateful to the laboratory of China Pharmaceutical University for providing experimental equipment and technical support.
Supporting Information
Table S1: Lists of primer sequences for qPCR analysis.
Open Research
Data Availability Statement
The data that support the findings of this study are available from the corresponding author upon reasonable request.


