Study on the Material Basis and Mechanism of Action of Different Parts of Honey Bran Cimicifuga Rhizoma in the Treatment of IBS-D
Abstract
Background of the study: Diarrhea-predominant irritable bowel syndrome (IBS-D) is a common disease of the brain–gut axis with clinical manifestations such as abdominal pain and abdominal leakage. It is usually accompanied by anxiety and depression, which severely affects the activities of daily living of patients. After Cimicifuga Rhizoma (CR) is processed through the honey bran, the effect of replenishing qi to increase yang is enhanced, and it is often used to treat abdominal pain, diarrhea, and other gastrointestinal discomforts. Honey Bran CR (HBCR) is clinically available for the treatment of IBS-D, but there is a lack of research on its material basis and mechanism of action, among other aspects.
Aim of the study: This study aimed to investigate the material basis of HBCR for replenishing qi to increase yang and predict its mechanism of action in treating IBS-D. Materials and Methods: First, the chemical constituents of different fractionated extracts of HBCR were identified by UPLC-Q-TOF-MS/MS, and the ingredient library was established. Second, the therapeutic effects of different parts on IBS-D model rats were compared. Third, the spectrum–effect relationship between the chemical components and pharmacodynamic indexes of HBCR was established by gray correlation analysis. Network pharmacology and molecular docking techniques were utilized to validate the effectiveness of the effector components. Finally, the action mechanism of HBCR for IBS-D was further analyzed by serum metabolomics.
Results: A total of 61 chemical constituents were identified by UPLC-Q-TOF-MS/MS. They included 40 for the petroleum ether group, 48 for the dichloromethane group, 26 for the ethyl acetate group, 37 for the N-butanol group, and 19 for the water group. The results of AWR experiments showed that the IBS-D rat model was successfully constructed. The NGF and TRPV1 immunohistochemical sections; TNF-α, VIP, and 5-HT expressions in the colon; and SP, BDNF, and 5-HT expressions in the hypothalamus showed that different extracted parts of HBCR had curative effects on IBS-D model rats, and the treatment effect of the ethyl acetate group was the best. So the different extracted parts of HBCR could inhibit the release of TRPV1 and SP mediators by downregulating the expressions of BDNF and NGF. It could also affect the production of 5-HT to alleviate the development of visceral hypersensitivity and inhibit the production of inflammatory factors such as TNF-α and the downregulation of gastrointestinal motility by VIP to treat IBS-D. Six potential effective components were screened using the spectrum–effect relationship: fukiic acid (Peak 1), cimicifugic acid C (Peak 26), piscidic acid (Peak 3), cimicifugic acid B (Peak 30), cimicifugic acid A (Peak 29), and cimicifugic acid D (Peak 25). The results of network pharmacology and molecular docking showed that the effective components played a role in replenishing qi to increase yang through multiple targets and pathways. Metabolomics studies have revealed that different fractionated extracts of HBCR can regulate unsaturated fatty acid biosynthesis metabolism, arachidonic acid metabolism, pyruvic acid metabolism, and other pathways to play a therapeutic role in the treatment of IBS-D.
Conclusion: In this study, we developed a library of chemical constituents of different extracted parts of HBCR for the first time, and the effective components for replenishing qi to increase yang were screened using the spectrum–effect relationship. This study preliminarily elucidated the action mechanism of different extracted parts of HBCR for the treatment of IBS-D. This laid a foundation for the study of the pharmacokinetics and quality standards of HBCR and provided a scientific basis for its clinical application.
Summary
- •
The chemical composition of HBCR was analyzed by extracting fractions with different polarities.
- •
For the first time, the therapeutic effects of different polarized extraction sites of HBCR on IBS-D rats were investigated.
- •
We predicted and explored the effect or components of HBCR in the treatment of IBS-D and its mechanism of action.
1. Introduction
Cimicifuga Rhizoma (CR), as a kind of traditional Chinese medicine with the same origin of food and medicine, not only has significant clinical efficacy but also shows good potential for application in the field of health food. CR effuses external and outthrusting rashes, clears heat, removes toxins, and invigorates yang. Therefore, it has medicinal value. Modern research shows that CR mainly contains triterpenoid, saponins, chromones, and phenolic acids. It also contains a few alkaloids, polysaccharides, and other effective chemical components and has good antitumor, anti-inflammatory, nucleotide transport inhibitory, antiviral, and other pharmacological effects [1]. After CR is processed through the honey bran, the effect of replenishing qi to increase yang is enhanced. Modern pharmacological studies have shown that Honey Bran CR (HBCR) regulates the spleen and stomach and promotes enhanced gastrointestinal motility [2]. Replenishing qi to increase yang refers to the regulation of the normal transportation of the spleen and stomach by improving the deficiencies in the operation of qi and blood within the human body and is commonly used to treat diarrhea, and so on [3].
Diarrhea-predominant irritable bowel syndrome (IBS-D), one of the most common subtypes of irritable bowel syndrome, is a common brain–gut axis disorder with clinical manifestations such as abdominal pain and abdominal discomfort, which is also accompanied by anxiety and depression. The prevalence of this disease is high, affecting approximately 10% of the population, and the number of patients is showing an upward trend. Its clinical manifestations are abdominal pain, diarrhea, and abdominal discomfort. The main pathogenesis of IBS-D involves liver and spleen dysfunction leading to diarrhea. In Chinese medicine, treatment is often directed at soothing the liver and fortifying the spleen. HBCR is effective at replenishing qi to increase yang and is clinically used to treat IBS-D [4]. However, owing to the unclear material basis of HBCR for the treatment of IBS-D and the lack of studies on the action mechanism, the promotion and application of Chinese Herbal Medicine Decoctions are limited.
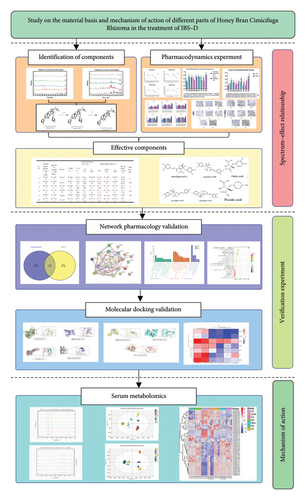
In this study, the UPLC-Q-TOF-MS/MS technology was used to identify the chemical components of different extracts of HBCR, and its therapeutic effect on IBS-D model rats was studied. Combined with the spectrum–effect relationship technology, the material basis of HBCR for replenishing qi and increasing yang was selected. The results were verified by network pharmacology and molecular docking technology. The action mechanism of different extracted parts of HBCR in the treatment of IBS-D was further investigated by serum metabolomics (Figure 1). This was aimed at providing a scientific basis for the clinical application of HBCR.
2. Materials and Methods
2.1. Materials and Reagents
CR was purchased from Jiangxi Guhan Refined Chinese Herbal Pieces Co. (batch number: 20230613), Ltd. Bran was purchased from Dongguan Dekangtang Pharmaceutical Co., Ltd. Honey was purchased from Ningbo Xinkang Apiculture Co., Ltd. Methanol, ethanol, petroleum ether (PE) (60°C–90°C), dichloromethane (DCM), ethyl acetate (EA), and n-butanol were purchased from Xilong Science Co., Ltd. MS pure methanol, acetonitrile, and formic acid were purchased from ACS Enke Chemical Co., Ltd. Rat tissue, 5-hydroxytryptamine (5-HT), brain-derived neurotrophic factor (BDNF), rat substance P (SP), vasoactive intestinal peptide (VIP), tumor necrosis factor-α (TNF-α) assay kit, and enzyme-linked immunosorbent assay (ELISA) kits were purchased from Wuhan Huamei Bioengineering Co., Ltd. CR was identified as the dry rhizome of Cimicifuga heracleifolia Kom. by Professor Ge Fei from Jiangxi University of Traditional Chinese Medicine, and HBCR was prepared in the laboratory.
The Triple TOF 5600 high-resolution mass spectrometer was purchased from SCIEX, United States of America. The CP214 electronic balance was purchased from Shanghai OHAUS Instrument Co., Ltd. The SQP electronic balance was purchased from Sedoris Scientific Instruments Co., Ltd. The GZX-9076MBE electric blower dryer was purchased from Shanghai Boxun Industrial Co., Ltd. The Universal high-speed grinder was purchased from Zhejiang Hongjingtian Industry & Trade Co., Ltd. The SHZ-DIII Yuhua brand circulating water vacuum pump was purchased from Gongyi Yuhua Instrument Co., Ltd. The KQ-500E ultrasonic cleaner was purchased from Kunshan Ultrasonic Instrument Co., Ltd. The HM-48 grinding apparatus was purchased from Shanghai Huxi Industrial Co., Ltd. The high-speed tabletop freezing centrifuge was purchased from Hunan Xiangyi Laboratory Instrument Development Co.
2.2. Animals
Ninety SD male rats (200 ± 30 g, 8 weeks of age) were provided by Spefor (Beijing) Biotechnology Co., Ltd. SD rats were housed in a barrier environment. The animal production license number is SCXK (Beijing) 2019-0010. The laboratory animal welfare and ethical review approval number is MDL2023-06-15-01.
2.3. Sample Preparation
2.3.1. Preparation of HBCR
The bran and refined honey (diluted with an appropriate amount of boiling water) were mixed well, rubbed, sieved, and dried to not stick to the hands. Each 100 kg of bran was refined with 30 kg of refined honey to obtain honey bran. The pot was heated with medium heat, and the prepared honey bran was evenly spread into the hot pot. CR was placed into the pot when the smoke began to rise. The CR was taken out when its surface was old yellow, and the honey bran was sieved and cooled. Ten kilograms of honey bran excipients were used per 100 kg CR.
2.3.2. Preparation of the HBCR Extract
One kilogram of HBCR was weighed and added to 5 portions of 75% ethanol, and reflux extraction was performed 2 times (1.5, 1.0 h) to obtain the ethanol extract. The residue was extracted with five portions of water for 2 times (1.0, 0.5 h) to obtain the water extract. The ethanol and water extracts were combined and diluted with water to 1 gmL−1. The total extract of HBCR was obtained. The total extract of HBCR was extracted with PE (60°C–90°C), DCM, EA, n-butanol, and water for five times. They were concentrated separately to obtain five different extracted parts’ extracts.
2.3.3. Preparation of the Test Solution
Different parts of the extract were weighed. The extract was placed in a 25-mL volumetric flask, fixed in methanol, and filtered through a 0.22-μm filter membrane for UPLC-Q-TOF-MS/MS injection analysis.
2.4. Chromatographic Conditions
The ACQUITY UPLC BEH C18 column (2.1 mm × 100 mm, 1.7 μm) was employed with a mobile phase consisting of 0.1% formic acid aqueous solution (A) and acetonitrile (B). The gradient elution program was set as follows: 0–1 min, 5% B; 1–20 min, 5%–25% B; 20–35 min, 25%–37% B; 35–38 min, 37% B; 38–40 min, 37%–38% B; 40–48 min, 38%–45% B; 48–68 min, 45%–95% B; 68–70 min, 95% B; 70–70.1 min, 95%–5% B; and 70.1–75 min, 5% B. The column temperature was maintained at 40°C, the injection volume was 1 μL, and the flow rate was 0.25 mL/min.
2.5. Mass Spectrometry Conditions
electrospray ionization (ESI) source was used and detected in positive and negative ion modes, respectively. The positive ion mode conditions were as follows: mass scan range of 100–1500 m/z, spray voltage (ISVF) of 5.5 kV, ion source temperature (TEM) of 500°C, declustering voltage (DP) of 100 V, collision energy (CE) of 38 V, collision energy superposition (CES) of 15 V, air curtain gas pressure (CUR) of 40 psi, nebulizing gas (GS1) and auxiliary gas (GS2) pressures of 50 psi, and data acquisition time of 75 min. The data were collected using TOF-MS-IDA-MS/MS. IDA had the six highest peaks with response values greater than 100 cps for secondary mass spectrometry scanning. The subscanning range was 50–1250 m/z, and those meeting this condition were prioritized for secondary scanning. Dynamic background subtraction (DBS) was turned on. The negative ion mode conditions were as follows: spray voltage (ISVF) of −4.5 kV, decluste voltage (DP) of −100 V, and CE of −38 V; the other parameters were the same as for the positive ions.
2.6. Effect of the Pharmacodynamic Effect
2.6.1. Animal Model Construction
Healthy SD rats were randomly divided into 8 groups: negative control (NC) group, PE, DCM, EA, n-butyl alcohol (NBA), aqueous extract (AE), positive control (PC), and model control (MC) groups. The NC group received only water and normal food and an equal dose of saline by gavage. The IBS-D model was established using senna gavage combined with chronic restraint stress in the other groups of rats. The procedure was as follows. The rats were dosed with 6 g/kgd senna decoction and placed in a homemade chronic restraint device for 2 h continuously for 14 consecutive days of modeling. The success of the IBS-D model was judged by body weight, fecal characteristics, and the abdominal withdrawal reflex (AWR) test score.
After successful modeling, each group received 4.2 g/kgd of extracts of different polar parts of HBCR and total extracts. The positive drug group received 18 mg/kgd of pivacurium bromide suspension, and the blank and model groups received equal amounts of saline for 14 consecutive days.
2.6.2. AWR Experiment
The 4.5- and 6-cm points of the middle finger of the medical rubber glove were marked [5, 6]. The glove was cut along the 6-cm point, attached to the anterior end of the 8F catheter with A medical adhesive tape, and tied tightly with a surgical suture at the 4.5-cm point to make a balloon catheter. The rats were fasted (without food and water) for 24 h after the modeling and before the end of drug administration. They were anesthetized with a small amount of ether. The airbag fixed at one end of the catheter was lubricated with paraffin oil and inserted approximately 6 cm along the anus of the rat. The balloon of the balloon catheter was lubricated with paraffin oil. Subsequently, the balloon catheter was inserted approximately 6 cm along the anus of the rats. The medical tape was wrapped around the catheter and the root of the tail of the rat to hold the airbag in place. The rats were placed in transparent plastic cages, and they were acclimatized to complete calmness. The intestines were dilated by slowly injecting gas into the air sacs. The abdominal retraction reflex was observed at pressures of 20, 40, 60, and 80 mmHg, respectively, and each dilation lasted for 20-s. Three repetitive measurements were obtained at each pressure at 5-min intervals, and the AWR scores were determined at the same time (Table 1). The degree of visceral sensitivity was based on the score.
| Score | Behavior |
|---|---|
| 0 points | No apparent behavioral response to stimulus |
| 1 point | Body remains motionless, but brief head movement occurs |
| 2 points | Abdominal muscles do not lift off the bottom but are contracted |
| 3 points | Abdominal muscles lifted off the floor, abdominal muscles contracted |
| 4 points | Body arched, pelvis raised |
2.6.3. Animal Administration
In the experiment, by consulting the 2020 edition of the Pharmacopoeia of the People’s Republic of China, we determined that the dosage of the herbal medicine Cimicifuga is 3–10 g. To ascertain the dosage for rats, we employed the body surface area conversion coefficient method, a commonly utilized dosage conversion approach in animal experiments. The conversion coefficient for human and rat dosages is 6.3. The specific conversion formula is as follows: the dosage for rats = the human dosage × conversion coefficient [7]. We calculated the dosage for rats based on the maximum human daily dosage of 10 g/70 kg, resulting in a rat dosage of 0.9 g/kg. Therefore, the fourfold dosage for rats is 3.6 g/kg.
Based on the conversion of the human clinical maximum administered dose, which is equivalent to 1 and 4 times the human daily administered dose, the low and high dose groups were used for animal pretests. The AWR– and HE–stained sections showed that HBCR had a therapeutic effect on IBS-D model mice, and the therapeutic effect was the best for the high-dose group. Therefore, the high dose was used as the administered dose group.
The extracts from different sites were dissolved to 1 g/mL by ultrasonication with water and stored at 4°C for spare parts. After successful modeling, the groups received 4.2 g/kgd of the HBCR extracts from different polar parts. The positive drug group received 18 mg/kgd of the pivacurium bromide suspension. The blank and model groups received equal amounts of saline. The animals were gavaged continuously for 14 days.
2.6.4. General Behavioral Observations
The general behavioral conditions such as body weight changes, mental status changes, fecal status, the presence or absence of fecal staining in the anus of the rats, and hair color were recorded daily.
2.6.5. Measurement of Indicators of Gastric Emptying and Intestinal Propulsion
The animals were fasted for 24 h after the last dose. They all received 2 mL of the nutritious semisolid paste by gavage and were anesthetized with sodium pentobarbital after 30 min. Blood samples were collected from the abdominal aorta. Subsequently, the gastric cardia and pylorus were ligated, followed by the removal of the gastric sac and small intestine. Subsequently, the gastric emptying rate and small intestinal propulsion rate were determined using the following formulas: Gastric emptying rate = (Total stomach weight – Net stomach weight)/Semisolid paste weight × 100%; Small intestinal propulsion rate = Distance of carbon powder thrust/Total length of small intestine × 100%.
2.6.6. Organ Harvesting
The colon tissue was washed and divided into two; one was collected in a sterile EP tube and stored in liquid nitrogen, and the other was placed in 4% paraformaldehyde awaiting assay. The rats were cut along the neck with scissors, their brain tissues were carefully stripped out, and the hypothalamus was rapidly isolated and placed in liquid nitrogen for temporary storage to maintain tissue activity. Tissues preserved in liquid nitrogen were subsequently transferred to a −80°C refrigerator pending an assay.
2.6.7. Expressions of Factors in the Colon and Hypothalamus Determined by ELISA
An ELISA was used to determine the expressions of 5-HT, VIP, and TNF-α in rat colon tissues and 5-HT, SP, and BDNF in hypothalamic tissues.
2.6.8. Expressions of NGF and TRPV1 in Rat Colon Tissue Detected by Immunohistological Studies
The colon tissues fixed in paraformaldehyde were taken and sequentially subjected to dehydration, embedding, sectioning, dewaxing and hydration, antigen repair, incubation with H2O2 at room temperature, closure, addition of primary antibody, addition of secondary antibody, addition of horseradish enzyme–labeled streptavidin, and DAB staining. The expressions of NGF and TRPV1 in the colon tissues were observed with a microscope, and the images were processed with Image-Pro Plus 6.0 software. The total positive areas for NGF and TRPV1 were calculated, and the average reaction intensities of NGF and TRPV1 were expressed as the mean density (OD).
2.7. Gray Correlation Analysis (GRA)
GRA was used to analyze the degree of correlation between each potency index and each component and determine the degree of influence of the components of HBCR on IBS-D. The pharmacodynamic indices of intestinal propulsion and gastric emptying rates were used for NGF, TRPV1, TNF-α, VIP, 5-HT, SP, and BDNF as parent sequences for the treatment of IBS-D by HBCR, and the peak areas of the chemical constituents of each extracted site were used as subsequences. The raw data were processed by the mean value method through the SPSSPRO website (https://www.spsspro.com/), and the correlation coefficients of the parent and subsequence sequences were calculated to screen for potential effective components.
2.8. Validation of Effective Components
2.8.1. Screening of Components and IBS-D Targets
The SwissTargetPrediction (http://www.swisstargetprediction.ch/) and SuperPred (https://prediction.charite.de/) databases were used to screen relevant targets for the potentially effective components. The component and disease targets were imported into the Venny 2.1.0 platform (http://www.liuxiaoyuyuan.cn/) to plot as a Wayne diagram and screened to obtain intersecting targets.
2.8.2. Construction of the Protein–Protein Interaction (PPI) Network
The PPI network of intersecting targets was constructed using the STRING database (https://cn.string-db.org/) with “Homo sapiens”’ as a filter. Degree, betweenness (BC), and closeness (CC) of the intersecting targets were obtained by Cytoscape 3.10.1 software analysis.
2.8.3. Enrichment Analysis of Intersecting Targets
The intersecting targets were analyzed for GO enrichment and KEGG pathway enrichment using the DAVID (https://david.ncifcrf.gov/) database. GO enrichment analysis histograms and KEGG enrichment analysis bubble graphs were plotted using the Microbiology Letter (http://www.bioinformatics.com.cn/) platform.
2.8.4. Molecular Docking
The structures of potential effective components and core targets were downloaded through databases such as PDB (https://www.rcsb.org) and SciFinder, and the molecular docking results were generated using software such as AutoDockTools and AutoDock Vina after the targets were dewatered and disorganized with PyMOL. The binding energy of molecular docking was used as an indicator to plot the heat map of molecular docking results via the HiPlot online website (https://hiplot.com.cn/).
2.9. Serum Metabolomics Analysis
2.9.1. Sample Preparation
Serum samples stored at −80°C were taken and thawed at 4°C. 100 μL of the serum was taken in a 2 mL centrifuge tube, 300 μL of methanol containing 0.1% formic acid was added, vortexed for 60 s, and centrifuged for 15 min at 4°C and 12,000 r/min. The supernatant was then taken and transferred to a 2 mL centrifuge tube and then concentrated and dried under vacuum at room temperature. The residue was reconstituted by adding 50 μL of 70% methanol, centrifuged at 4°C and 12,000 r/min for 15 min, and the supernatant was taken and left to be measured.
2.9.2. UPLC-Q-TOF-MS Conditions
Serum samples were detected using UPLC-Q-TOF-MS positive and negative ions on an ACQUITY UPLC BEH C18 column (2.1 × 100 mm, 1.7 μm); the mobile phase was composed of a 0.1% formic acid aqueous solution (A) and acetonitrile (B). The gradient elution procedure was as follows: 0–8 min, 10%-60% B; 8–30 min, 60%-95% B; 30–32 min, 95% B; and 32–37 min, 95%-10% B. The column temperature was set at 30°C, with a flow rate of 0.3 mL/min and an injection volume of 7 μL. For mass spectrometry analysis, an ESI source was employed. The scanning range was from m/z 100 to 1500. The positive and negative ion spray voltages (ISVF) were set at 5.5 kV and −4.5 kV, respectively. The temperature of the turbo ion spray interface (TEM) was 500°C. The declustering potential (DP) was ±100 V, the CE was ±45 V, and the cell exit potential (CES) was 15 V. The air curtain gas pressure was 40 psi, while the nebulizer gas (GS1) and heater gas (GS2) pressures were both 50 psi. The data acquisition time was 37 min.
2.9.3. Data Extrapolation and Statistical Analyses
The metabolomics results were first processed by Progenesis QI software for baseline correction, peak extraction, peak identification, and normalization of mass spectrometry data using the total peak area as the control and then imported into SIMCA-P 14.0 software for principal component analysis (PCA) and orthogonal partial least squares–discriminant analysis (OPLS–DA), according to the variable important in projection (VIP1) > 1.0 and p < 0.05. The metabolites were then imported into SIMCA-P 14.0 software for PCA and OPLS–DA and screened for differential metabolites according to weight of VIP1 > 1.0 and p < 0.05, and identified as differential metabolites according to the HMDB database. The differential metabolites were identified according to the HMDB database, and the differential metabolites were imported into the MetaboAnalyst 5.0 online website for metabolic pathway enrichment analysis.
3. Results
3.1. UPLC-Q-TOF-MS Compositional Analysis
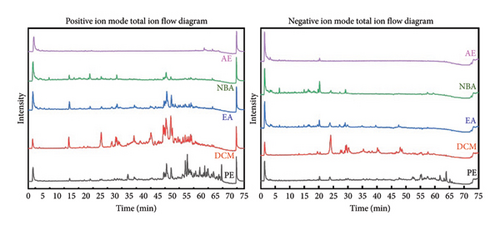
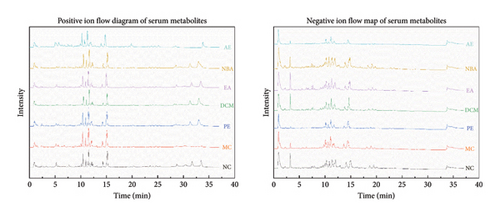
The total ion flow diagram (Figure 2) of HBCR in positive and negative ion modes was obtained after injection and detection according to the conditions. The HBCR total component library was constructed by reviewing relevant literature and databases such as TCMSP, SymMap, and TCMID. PeakView and ChemDraw software combined with ChemSpider, mzCloud, HMDB, and other databases were used to analyze and identify the compositions. Sixty-one compounds were obtained and analyzed (Table 2). There were 40 compounds in PE, 48 compounds in DCM, 26 compounds in EA, 37 compounds in NBA, and 19 compounds in AE.
| No. | Chemical name | Molecular formula | Time | MS/MS | Group |
|---|---|---|---|---|---|
| 1 | Fukiic acid | C11H12O8 | 2.27 |
|
PE, DCM, EA, NBA, AE |
| 2 | 3-hydroxy-2-methoxybenzoic acid | C8H8O4 | 3.06 |
|
PE, DCM, EA, NBA |
| 3 | Piscidic acid | C11H12O7 | 3.27 |
|
PE, DCM, EA, NBA, AE |
| 4 | Protocatechuic acid | C7H6O4 | 3.61 | 109.0284[M-H-CH2O2]- | PE, DCM, EA, NBA |
| 5 | Cimidahurine | C14H20O8 | 3.74 |
|
PE, DCM, NBA, AE |
| 6 | Cimidahurinine | C14H20O8 | 3.93 |
|
PE, DCM, EA, AE |
| 7 | Caffeic ester glucoside | C15H18O9 | 4.5 |
|
NBA |
| 8 | Grevilloside G | C14H20O8 | 4.789 |
|
EA, NBA, AE |
| 9 | Trans-4-hydroxycinnamic acid | C9H8O3 | 6.01 |
|
EA, NBA |
| 10 | 1-feruloyl-β-D-glucopyranoside | C16H20O9 | 6.13 |
|
PE, DCM, EA, NBA, AE |
| 11 | Ferulic acid 4-O-beta-D-alloside | C16H20O9 | 6.41 |
|
PE, DCM, NBA, AE |
| 12 | Methyl caffeate acid | C10H10O4 | 6.42 |
|
PE, DCM, EA, NBA, AE |
| 13 | Sinapic acid | C11H12O5 | 7.19 |
|
DCM, NBA, AE |
| 14 | Caffeic acid | C9H8O4 | 7.39 |
|
PE, DCM, EA |
| 15 | P-coumaric acid | C9H8O3 | 10.2 | 119.0489[M-H-C2H4O2]- | EA, NBA |
| 16 | Ferulic acid | C10H10O4 | 11.932 |
|
PE, DCM, EA, NBA, AE |
| 17 | Cimicifugamide A | C24H29NO10 | 12.08 |
|
PE, EA, NBA |
| 18 | Isoferulic acid | C10H10O4 | 13.019 |
|
PE, DCM, EA, NBA, AE |
| 19 | Shormaside C | C27H30O15 | 13.19 |
|
PE, DCM, NBA |
| 20 | Feruloyltyramine-4-O-beta-D-alloside | C24H29NO9 | 14.06 |
|
PE, DCM, EA, NBA |
| 21 | Fukinolic acid | C20H18O11 | 14.27 |
|
NBA |
| 22 | Isoferuloyltyramine-4-O-beta-D-glucoside | C24H29NO9 | 14.65 |
|
PE, DCM, EA, NBA |
| 23 | Cimidamide | C25H31NO10 | 14.94 |
|
PE, NBA |
| 24 | Isocimicifugamide | C25H31NO10 | 15.03 |
|
PE, DCM, NBA |
| 25 | Cimicifugic acid D | C20H18O10 | 16.16 |
|
PE, DCM, EA, NBA, AE |
| 26 | Cimicifugic acid C | C20H18O10 | 16.56 |
|
PE, DCM, NBA, AE |
| 27 | Feruloyltyramine | C18H19NO5 | 16.83 |
|
EA |
| 28 | Carboxymethyl isoferulate | C12H12O6 | 16.89 |
|
PE, DCM, EA, NBA |
| 29 | Cimicifugic acid A | C21H20O11 | 17.65 |
|
PE, DCM, EA, NBA, AE |
| 30 | Cimicifugic acid B | C21H20O11 | 18.3 |
|
PE, DCM, EA, NBA, AE |
| 31 | Cimicifugic acid J | C22H22O11 | 19.48 |
|
PE, DCM, EA, NBA |
| 32 | Cimicifugic acid E | C21H20O10 | 19.736 |
|
PE, DCM, NBA, AE |
| 33 | Cimicifugic acid F | C21H20O10 | 20.27 |
|
PE, DCM, NBA, AE |
| 34 | Cimicifugamide | C25H31NO10 | 21.094 |
|
PE, DCM, NBA, AE |
| 35 | Caffeic acid dimethyl ether | C11H12O4 | 21.73 | 135.0446[M-H-C3H4O2]- | DCM |
| 36 | Cimiracemate B | C19H18O7 | 23.806 |
|
PE, EA, NBA, AE |
| 37 | Cimiracemate A | C19H18O7 | 24.095 |
|
PE, EA, NBA, AE |
| 38 | Cimifetidanoside A | C35H54O10 | 29.17 |
|
DCM, NBA |
| 39 | Cimicifugoside H-5 | C35H52O10 | 30.09 |
|
PE |
| 40 | 23R-acetoxy-24R-15,25-trihydroxy-cycloart-7-en-16-one 3-O-β-D-xylopyranoside | C37H58O12 | 30.36 |
|
PE, DCM |
| 41 | Cimidahuside C | C37H58O12 | 31.069 |
|
PE, DCM |
| 42 | Cimicifugoside H-2 | C35H54O10 | 34.291 |
|
DCM, NBA |
| 43 | 12β-hydroxy-7(8)-ene-cimigenol | C30H46O6 | 37 | 443.2794[M-H-C3H8O]- | DCM |
| 44 | Yunnanterpenes B | C30H48O6 | 38.226 |
|
DCM |
| 45 | 15,16-seco-shengmanol C | C30H48O6 | 38.23 |
|
DCM |
| 46 | Cimifoetiside I | C36H58O11 | 39.87 | 619.3923[M-H-2CH3-H2O]- | PE |
| 47 | Cimifetidanoside H | C37H58O11 | 40.353 |
|
PE, DCM |
| 48 | Peucenin | C15H16O4 | 40.97 | 243.0700[M-H-H2O]- | DCM |
| 49 | Bugbanoside B | C35H54O10 | 43.68 | 501.2853[M-H-C5H10O4]- | NBA |
| 50 | Yunnanterpenes D | C30H48O6 | 45.02 |
|
DCM |
| 51 | 24-O-acetylshengmanol-3-O-β-D-xyl | C37H60O11 | 46.702 |
|
DCM |
| 52 | 24-epi-24-O-acetyl-7,8-didehydroshengmanol-3-O-α-L-ara | C37H58O11 | 47.67 |
|
PE, DCM |
| 53 | Beesioside III | C37H60O11 | 48.026 |
|
PE, DCM |
| 54 | 24-O-acetylhydroshengmanol 3-O-β-D-xylopyranoside | C37H60O11 | 48.61 |
|
DCM |
| 55 | Cimidahuside H | C35H54O9 | 49.15 | 369.2431[M-H-gla]- | DCM |
| 56 | 24-epi-24-O-acetyl-7,8-didehydrohydroshengmanol-3-O-β-D-xylopyranoside | C37H58O11 | 49.516 |
|
PE, DCM |
| 57 | 24-O-acetylhydroshengmanol 3-O-β-D-xyloside | C37H60O11 | 50.577 |
|
DCM |
| 58 | 25-O-acetyl-7β-hydroxycimigenol | C32H50O7 | 50.918 | 485.3241[M-H-C2H4O2]- | PE, DCM, EA, NBA |
| 59 | Yunnanterpenes C | C32H50O7 | 54.79 |
|
PE, DCM, EA |
| 60 | Heracleifolinol | C32H50O7 | 56.086 |
|
PE, DCM |
| 61 | Cimiricaside B | C36H56O9 | 59.55 |
|
DCM |
3.2. Results of the Pharmacodynamic Experiments
3.2.1. General Behavioral Observations
At the end of the modeling, the NC rats had smooth fur, agile and active movements, good mental status, clean perianal area, and pelletized feces. The modeling rats had dull fur; depressed, sedentary, and slow movements; slow response to external stimuli; increased torsion response; and perianal staining accompanied by thinning of feces. The mental status, coat color, activity, perianal staining, and fecal characteristics of the rats in the administered group improved after the intervention.
3.2.2. Results of AWR Scoring
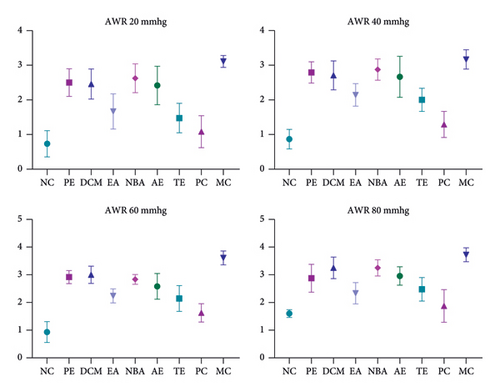
The AWR experiment revealed low visceral sensitivity in NC rats at the end of modeling and high visceral sensitivity in modeled rats. The visceral sensitization of the rats in the administered groups reduced to varying degrees after the intervention, whereas the MC rats did not show any improvement. The AWR scores at the end of the intervention are shown in Figure 3.
3.2.3. Gastric Emptying Rate and Intestinal Propulsion Rate
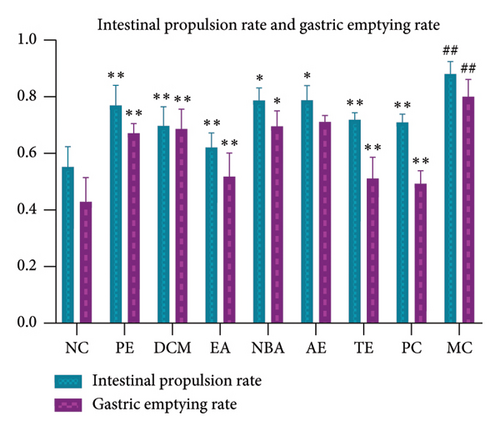
As shown in Figure 4, the gastric emptying and intestinal propulsion rates were significantly higher (p < 0.01) for the MC than for the NC group. Compared to those of MC, the gastric emptying rate of EA was not significant (p > 0.05); the gastric emptying and intestinal propulsion rates of NBA and the intestinal propulsion rate of the EA were significant (p < 0.05); and the gastric emptying and intestinal propulsion rates of the other groups were significantly decreased (p < 0.01). The gastric emptying rate was the highest for AE, followed by NBA, DCM, PE, and EA. The intestinal propulsion rate was the highest for AE, followed by NBA, PE, DCM, and EA. The different extracted parts of HBCR could reduce the intestinal propulsion and gastric emptying rates of IBS-D model rats. EA had the best mitigating effect.
3.2.4. Comparison of ELISA Results of 5-HT, TNF-α, and VIP in Rat Colon Tissues of Each Group
As shown in Figure 5, the expressions of 5-HT, TNF-α, and VIP in the colon tissue of MC rats increased relative to those of NC (p < 0.05). In contrast, the expressions of NGF and TRPV1 in the colon tissues of the rats in each administration group decreased relative to that of MC (p < 0.05). The 5-HT expression was the highest for AE, followed by DCM, NBA, PE, and EA. The VIP expression was the highest for PE, AE, NBA, DCM, and EA. The TNF-α expression was the highest for PE, followed by AE, DCM, NBA, and EA. Different extracted parts of HBCR showed therapeutic effects on IBS-D model rats, and EA had the best therapeutic effect.

3.2.5. Comparison of ELISA Results of 5-HT, SP, and BDNF in Hypothalamic Tissues of Rats in Each Group
As shown in Figure 6, the expressions of 5-HT, SP, and BDNF increased in the hypothalamic tissue of the MC relative to the NC group (p < 0.05). Compared to MC, the expressions of 5-HT, SP, and BDNF in the hypothalamic tissues of the rats were reduced in all administration groups (p < 0.05), except that the expression of BDNF in the AE was not significant (p > 0.05). The 5-HT expression was highest for NBA, followed by AE, DCM, PE, and EA. SP expression was the highest for AE, followed by NBA, PE, DCM, and EA. BDNF expression was the highest for AE, followed by DCM, NBA, PE, and EA. Different extracted parts of HBCR inhibit the expressed 5-HT, SP, and BDNF in the hypothalamic tissues of IBS-D model rats. EA had the best therapeutic effect.

3.2.6. Comparison of Positive Expressions of NGF and TRPV1 in Colon Tissues of Rats in Each Group
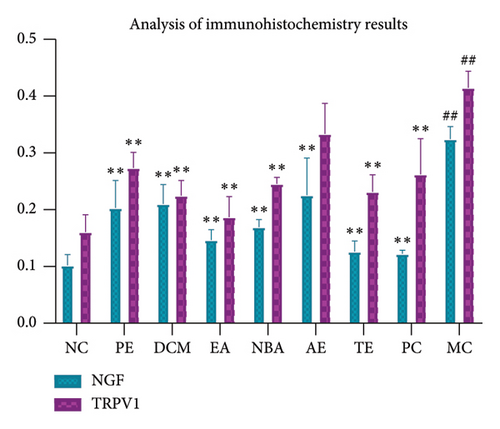
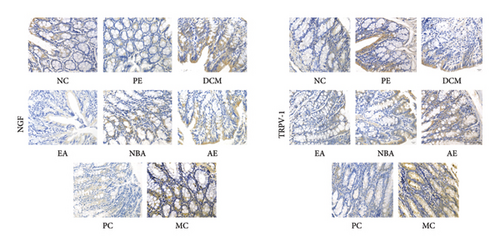
As shown in Figures 7 and 8, strong positive expressions of NGF and TRPV1 were observed for MC (p < 0.05), with an increased number of positive cells and deeper staining. The degrees of positive expressions of NGF and TRPV1 were lower than those of MC in each administration group (p < 0.05), except for the water group where TRPV1 was not significant (p > 0.05). The positive expression of NGF was the highest for AE, followed by DCM, PE, NBA, and EA. The positive expression of TRPV1 was the highest for AE, PE, NBA, DCM, and EA. Different extracted parts of HBCR expressed NGF and TRPV1 in colon tissues of IBS-D model rats. EA had the best therapeutic effect.
3.3. Analysis of Spectrum–Effect Relationship
The relationships between the peak areas of all the components and pharmacodynamic indices were determined using gray correlation (Table 3). Comprehensive analysis showed that Peak 1 (fukiic acid), Peak 26 (cimicifugic acid C), Peak 3 (piscidic acid), Peak 30 (cimicifugic acid B), Peak 29 (cimicifugic acid A), and Peak 25 (cimicifugic acid D) were ranked in the top 6 terms of correlation with each of the pharmacodynamic properties, and the correlations were higher and more stable than those for the other components. However, from the seventh constituent, the ordering of the correlations between the constituents and the pharmacodynamic indicators was highly variable and unstable. Therefore, it is hypothesized that the first six components may be the effector components of honeybush asparagus in the treatment of IBS-D.
| No. | Correlation | |||||||||||
|---|---|---|---|---|---|---|---|---|---|---|---|---|
| Intestinal propulsion rate | Gastric emptying rate | NGF | TRPV1 | Colon | Hypothalamus | Average value | Rankings | |||||
| TNF-α | VIP | 5-HT | SP | BDNF | 5-HT | |||||||
| 1 | 0.856 | 0.853 | 0.843 | 0.864 | 0.843 | 0.854 | 0.861 | 0.857 | 0.851 | 0.854 | 0.8536 | 1 |
| 2 | 0.689 | 0.686 | 0.67 | 0.675 | 0.677 | 0.688 | 0.686 | 0.687 | 0.679 | 0.684 | 0.6821 | 26 |
| 3 | 0.797 | 0.794 | 0.788 | 0.806 | 0.786 | 0.795 | 0.799 | 0.796 | 0.791 | 0.792 | 0.7944 | 3 |
| 4 | 0.717 | 0.714 | 0.699 | 0.704 | 0.706 | 0.717 | 0.716 | 0.717 | 0.709 | 0.715 | 0.7114 | 18 |
| 5 | 0.653 | 0.657 | 0.65 | 0.652 | 0.647 | 0.654 | 0.652 | 0.65 | 0.64 | 0.645 | 0.65 | 38 |
| 6 | 0.752 | 0.754 | 0.75 | 0.743 | 0.75 | 0.762 | 0.737 | 0.758 | 0.753 | 0.755 | 0.7514 | 7 |
| 7 | 0.616 | 0.621 | 0.615 | 0.617 | 0.611 | 0.617 | 0.614 | 0.613 | 0.603 | 0.607 | 0.6134 | 58 |
| 8 | 0.665 | 0.663 | 0.653 | 0.652 | 0.659 | 0.671 | 0.662 | 0.668 | 0.665 | 0.668 | 0.6626 | 32 |
| 9 | 0.683 | 0.68 | 0.662 | 0.668 | 0.67 | 0.681 | 0.68 | 0.681 | 0.672 | 0.678 | 0.6755 | 28 |
| 10 | 0.736 | 0.733 | 0.72 | 0.717 | 0.729 | 0.744 | 0.734 | 0.742 | 0.74 | 0.743 | 0.7338 | 12 |
| 11 | 0.691 | 0.695 | 0.686 | 0.686 | 0.685 | 0.693 | 0.69 | 0.69 | 0.679 | 0.685 | 0.688 | 23 |
| 12 | 0.731 | 0.728 | 0.715 | 0.713 | 0.724 | 0.738 | 0.729 | 0.735 | 0.733 | 0.736 | 0.7282 | 16 |
| 13 | 0.726 | 0.739 | 0.736 | 0.711 | 0.728 | 0.738 | 0.737 | 0.73 | 0.719 | 0.725 | 0.7289 | 15 |
| 14 | 0.652 | 0.655 | 0.654 | 0.652 | 0.651 | 0.659 | 0.651 | 0.655 | 0.651 | 0.652 | 0.6532 | 34 |
| 15 | 0.656 | 0.655 | 0.641 | 0.645 | 0.647 | 0.657 | 0.654 | 0.655 | 0.647 | 0.652 | 0.6509 | 37 |
| 16 | 0.739 | 0.749 | 0.756 | 0.729 | 0.747 | 0.76 | 0.748 | 0.751 | 0.751 | 0.751 | 0.7481 | 8 |
| 17 | 0.685 | 0.682 | 0.672 | 0.671 | 0.678 | 0.691 | 0.683 | 0.688 | 0.686 | 0.689 | 0.6825 | 25 |
| 18 | 0.731 | 0.741 | 0.75 | 0.723 | 0.739 | 0.751 | 0.74 | 0.742 | 0.741 | 0.741 | 0.7399 | 11 |
| 19 | 0.742 | 0.744 | 0.732 | 0.745 | 0.735 | 0.74 | 0.72 | 0.734 | 0.719 | 0.725 | 0.7336 | 13 |
| 20 | 0.654 | 0.653 | 0.643 | 0.644 | 0.648 | 0.658 | 0.651 | 0.656 | 0.651 | 0.654 | 0.6512 | 36 |
| 21 | 0.616 | 0.621 | 0.615 | 0.617 | 0.611 | 0.617 | 0.614 | 0.613 | 0.603 | 0.607 | 0.6134 | 59 |
| 22 | 0.717 | 0.724 | 0.716 | 0.722 | 0.714 | 0.717 | 0.699 | 0.71 | 0.693 | 0.7 | 0.7112 | 19 |
| 23 | 0.647 | 0.651 | 0.645 | 0.647 | 0.641 | 0.648 | 0.647 | 0.645 | 0.635 | 0.639 | 0.6445 | 41 |
| 24 | 0.668 | 0.672 | 0.664 | 0.669 | 0.662 | 0.668 | 0.667 | 0.665 | 0.655 | 0.66 | 0.665 | 31 |
| 25 | 0.772 | 0.767 | 0.753 | 0.753 | 0.763 | 0.778 | 0.771 | 0.776 | 0.774 | 0.777 | 0.7684 | 6 |
| 26 | 0.812 | 0.814 | 0.806 | 0.83 | 0.802 | 0.804 | 0.794 | 0.8 | 0.783 | 0.789 | 0.8034 | 2 |
| 27 | 0.603 | 0.607 | 0.607 | 0.603 | 0.603 | 0.61 | 0.601 | 0.605 | 0.601 | 0.602 | 0.6042 | 61 |
| 28 | 0.747 | 0.743 | 0.728 | 0.735 | 0.736 | 0.749 | 0.744 | 0.748 | 0.743 | 0.747 | 0.742 | 9 |
| 29 | 0.784 | 0.78 | 0.765 | 0.765 | 0.775 | 0.791 | 0.783 | 0.789 | 0.787 | 0.79 | 0.7809 | 5 |
| 30 | 0.789 | 0.784 | 0.77 | 0.769 | 0.78 | 0.796 | 0.788 | 0.794 | 0.793 | 0.796 | 0.7859 | 4 |
| 31 | 0.734 | 0.731 | 0.719 | 0.72 | 0.725 | 0.739 | 0.735 | 0.737 | 0.734 | 0.737 | 0.7311 | 14 |
| 32 | 0.723 | 0.726 | 0.717 | 0.719 | 0.716 | 0.725 | 0.724 | 0.722 | 0.712 | 0.717 | 0.7201 | 17 |
| 33 | 0.745 | 0.748 | 0.737 | 0.74 | 0.738 | 0.747 | 0.746 | 0.744 | 0.734 | 0.74 | 0.7419 | 10 |
| 34 | 0.685 | 0.694 | 0.689 | 0.677 | 0.682 | 0.69 | 0.694 | 0.685 | 0.674 | 0.68 | 0.685 | 24 |
| 35 | 0.609 | 0.621 | 0.627 | 0.612 | 0.614 | 0.619 | 0.614 | 0.611 | 0.603 | 0.606 | 0.6136 | 47 |
| 36 | 0.676 | 0.674 | 0.658 | 0.662 | 0.665 | 0.676 | 0.673 | 0.675 | 0.666 | 0.672 | 0.6697 | 30 |
| 37 | 0.617 | 0.625 | 0.627 | 0.625 | 0.619 | 0.622 | 0.607 | 0.614 | 0.604 | 0.607 | 0.6167 | 45 |
| 38 | 0.654 | 0.663 | 0.656 | 0.647 | 0.65 | 0.658 | 0.66 | 0.653 | 0.641 | 0.648 | 0.653 | 35 |
| 39 | 0.615 | 0.623 | 0.625 | 0.623 | 0.617 | 0.62 | 0.605 | 0.612 | 0.602 | 0.605 | 0.6147 | 46 |
| 40 | 0.613 | 0.625 | 0.631 | 0.616 | 0.618 | 0.623 | 0.619 | 0.615 | 0.607 | 0.61 | 0.6177 | 44 |
| 41 | 0.641 | 0.648 | 0.649 | 0.65 | 0.642 | 0.645 | 0.629 | 0.638 | 0.627 | 0.63 | 0.6399 | 42 |
| 42 | 0.621 | 0.633 | 0.64 | 0.625 | 0.626 | 0.631 | 0.626 | 0.623 | 0.615 | 0.618 | 0.6258 | 43 |
| 43 | 0.609 | 0.621 | 0.627 | 0.612 | 0.614 | 0.619 | 0.614 | 0.611 | 0.603 | 0.606 | 0.6136 | 48 |
| 44 | 0.609 | 0.621 | 0.627 | 0.612 | 0.614 | 0.619 | 0.614 | 0.611 | 0.603 | 0.606 | 0.6136 | 49 |
| 45 | 0.609 | 0.621 | 0.627 | 0.612 | 0.614 | 0.619 | 0.614 | 0.611 | 0.603 | 0.606 | 0.6136 | 50 |
| 46 | 0.668 | 0.687 | 0.696 | 0.669 | 0.679 | 0.684 | 0.672 | 0.672 | 0.662 | 0.665 | 0.6754 | 29 |
| 47 | 0.674 | 0.686 | 0.692 | 0.675 | 0.678 | 0.685 | 0.686 | 0.678 | 0.671 | 0.674 | 0.6799 | 27 |
| 48 | 0.609 | 0.621 | 0.627 | 0.612 | 0.614 | 0.619 | 0.614 | 0.611 | 0.603 | 0.606 | 0.6136 | 51 |
| 49 | 0.616 | 0.621 | 0.615 | 0.617 | 0.611 | 0.617 | 0.614 | 0.613 | 0.603 | 0.607 | 0.6134 | 60 |
| 50 | 0.609 | 0.621 | 0.627 | 0.612 | 0.614 | 0.619 | 0.614 | 0.611 | 0.603 | 0.606 | 0.6136 | 52 |
| 51 | 0.609 | 0.621 | 0.627 | 0.612 | 0.614 | 0.619 | 0.614 | 0.611 | 0.603 | 0.606 | 0.6136 | 53 |
| 52 | 0.688 | 0.702 | 0.708 | 0.694 | 0.696 | 0.699 | 0.674 | 0.687 | 0.674 | 0.677 | 0.6899 | 21 |
| 53 | 0.642 | 0.657 | 0.664 | 0.647 | 0.65 | 0.654 | 0.638 | 0.643 | 0.631 | 0.635 | 0.6461 | 40 |
| 54 | 0.609 | 0.621 | 0.627 | 0.612 | 0.614 | 0.619 | 0.614 | 0.611 | 0.603 | 0.606 | 0.6136 | 54 |
| 55 | 0.609 | 0.621 | 0.627 | 0.612 | 0.614 | 0.619 | 0.614 | 0.611 | 0.603 | 0.606 | 0.6136 | 55 |
| 56 | 0.643 | 0.656 | 0.661 | 0.646 | 0.648 | 0.654 | 0.652 | 0.647 | 0.639 | 0.642 | 0.6488 | 39 |
| 57 | 0.609 | 0.621 | 0.627 | 0.612 | 0.614 | 0.619 | 0.614 | 0.611 | 0.603 | 0.606 | 0.6136 | 56 |
| 58 | 0.697 | 0.71 | 0.716 | 0.698 | 0.701 | 0.709 | 0.7 | 0.702 | 0.695 | 0.698 | 0.7026 | 20 |
| 59 | 0.656 | 0.671 | 0.678 | 0.662 | 0.664 | 0.668 | 0.65 | 0.656 | 0.644 | 0.648 | 0.6597 | 33 |
| 60 | 0.688 | 0.699 | 0.697 | 0.687 | 0.693 | 0.697 | 0.678 | 0.69 | 0.679 | 0.682 | 0.689 | 22 |
| 61 | 0.609 | 0.621 | 0.627 | 0.612 | 0.614 | 0.619 | 0.614 | 0.611 | 0.603 | 0.606 | 0.6136 | 57 |
3.4. Validation of Active Ingredients
3.4.1. Screening Results of Components and IBS-D Targets
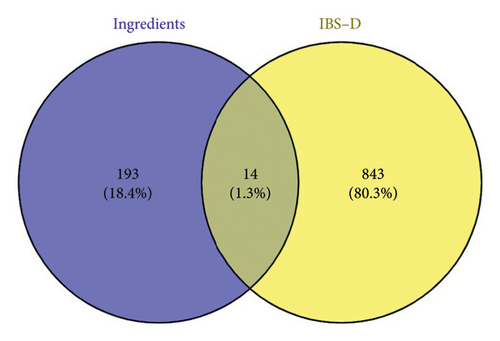
The targets of the effective components were predicted, screened, and de-emphasized using the SwissTargetPrediction and SuperPred databases. This yielded 207 component targets. Subsequently, the targets of IBS-D were predicted, screened, and de-emphasized by the OMIM and GeneCards database, and 857 disease targets were obtained. The component targets were plotted against the disease targets in a Venn diagram (Figure 9) and screened to obtain 14 intersecting targets.
3.4.2. PPI Network Construction and Core Target Screening Results
The 14 intersecting targets were imported into the STRING database to map the PPI network (Figure 10). The PPI network was imported into Cytoscape 3.10.1 software for analysis. Subsequently, seven potential core targets, including CASP3, NFKB1, NFKBIA, STAT1, MDM2, IRF1, and MAPK1, were screened by the median of the three metrics, namely, the degree, BC, and CC values (Table 4).
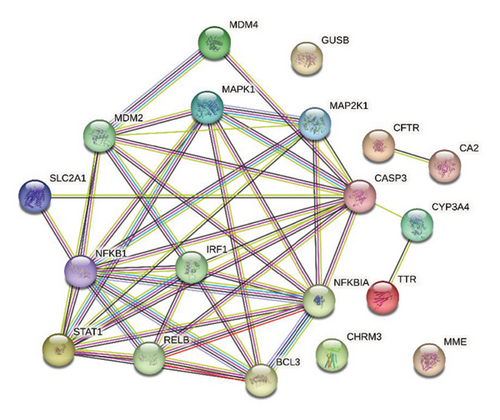
| Dene | Degree | Betweenness | Closeness |
|---|---|---|---|
| CASP3 | 11 | 64.12425 | 0.319149 |
| NFKB1 | 10 | 13.29697 | 0.306122 |
| NFKBIA | 9 | 4.29697 | 0.3 |
| STAT1 | 9 | 4.29697 | 0.3 |
| MDM2 | 8 | 7.642424 | 0.294118 |
| IRF1 | 7 | 2.163636 | 0.288462 |
| MAPK1 | 7 | 2.263636 | 0.288462 |
| MAP2K1 | 6 | 0 | 0.283019 |
| RELB | 6 | 1.181818 | 0.283019 |
| BCL3 | 6 | 0.733333 | 0.267857 |
| CYP3A4 | 2 | 24 | 0.263158 |
| MDM4 | 2 | 0 | 0.258621 |
| SLC2A1 | 2 | 0 | 0.263158 |
| TTR | 1 | 0 | 0.217391 |
| CFTR | 1 | 0 | 0.066667 |
| CA2 | 1 | 0 | 0.066667 |
3.4.3. GO Analysis and KEGG Analysis
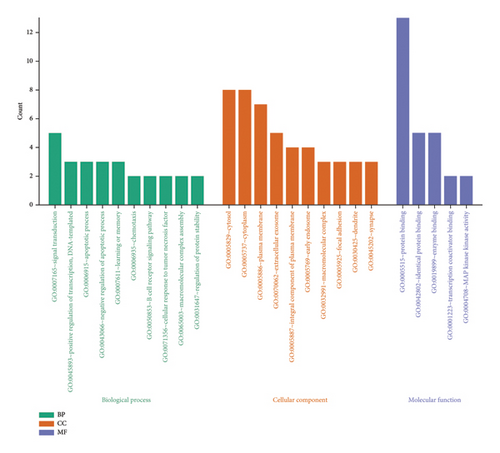
GO enrichment analysis of the intersecting targets yielded 28 biological processes (BPs), 15 cellular components (CCs), and 5 molecular functions (MFs) enriched pathways. The three modules were sorted according to the number of targets enriched by the pathways, and the top 10 pathways were selected to plot the bar graphs (Figure 11). As shown in the figure, the BP mainly involves signal transduction, positive regulation of transcription, DNA templating, and apoptotic processes. The CC mainly involves cytosol, the cytoplasm, and the plasma membrane. The MF mainly involves protein binding, identical protein binding, and enzyme binding.
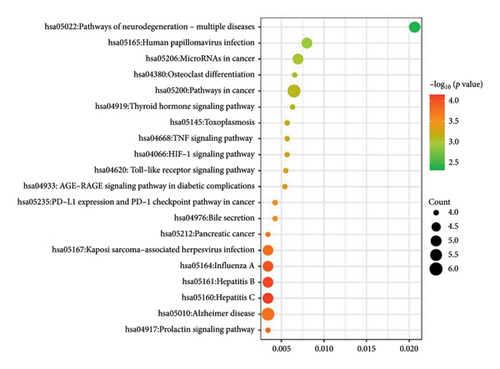
The KEGG pathway enrichment analysis was used to screen 77 pathways. The top 20 pathways were selected to draw KEGG–enriched bubble maps (Figure 12), which mainly included the pathways of neurodegenerative diseases, TNF signaling pathway, and bile secretion, among others.
3.4.4. Molecular Docking Results
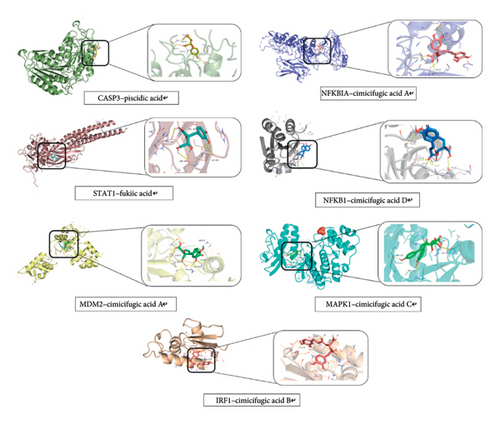
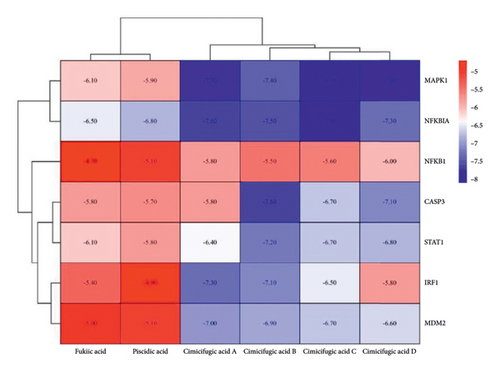
Molecular docking validation of six potential effective components to seven core targets (Figure 13) is plotted as a heat map by binding energies (Figure 14). The magnitude of the binding energy of the component to the target site responds to the binding activity between the ligand and the receptor. Binding energies less than −4.25 kcal/mol show binding activity, those less than −5.0 kcal/mol show better binding activity, and those less than −7.0 kcal/mol show strong binding activity. The thermogram results showed that the binding energies between the components and the targets were all less than −4.25 kcal/mol, indicating binding activity between the components and the targets.
3.5. Serum Metabolomics Analysis
3.5.1. Screening and Identification of Differential Metabolites
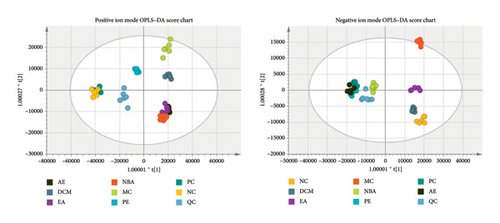
As shown in Figure 15, the trend of separation was found to be more significant than PCA by supervised OPLS–DA analysis, with different groups clearly separated from each other and the group of different extraction sites of HBCR converging to the normal group. The OPLS–DA score plot model was subjected to the replacement test, and the number of replacement tests was 200, as shown in Figure 3(c) The left side of the randomly generated R2 and Q2 are smaller than the right side, and the intersection with the Y-axis is less than 0.05, and the Q2 is greater than 0.5, which indicates that the model is accurate and reliable, and no overfitting has occurred. The OPLS–DA score plot showed that the control group and the model group showed an obvious trend of separation, indicating that the serum metabolic profiles of IBS-D rats changed significantly; the HBCR’s different parts administration group was far away from the MC and gradually converged to the NC, indicating that the serum metabolites of the IBS-D rats intervened by the HBCR’s different parts administration group had a tendency of recovering to the normal level, which demonstrated that the honey bran ascorbic acid had a certain positive regulatory effect on the metabolism of the body of the IBS-D rats.
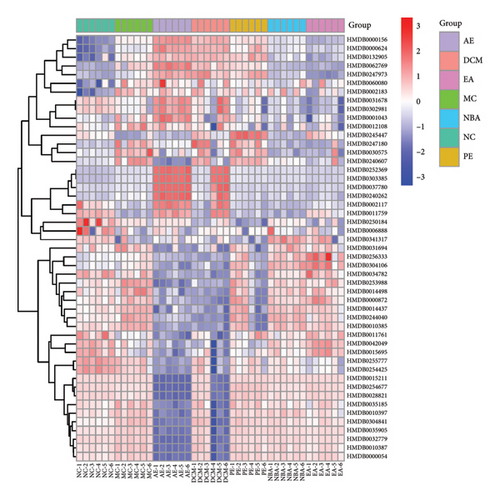
Potential differential metabolites were screened in the model and blank groups based on VIP1 value > 1.0 and t-test p value < 0.05, and a total of 50 differential metabolites were identified after m/z comparison in the HMDB database. The positive and negative ion modes identified 34 and 16 differential metabolites (Figure 16 and Table 5), respectively, of which 45 metabolites were called back by EA, 48 metabolites were called back by PE, 42 metabolites were called back by DCM, 31 metabolites were called back by PE, and 30 metabolites were called back by AE. In order to compare more intuitively the changes in the content of biometabolites at different extraction sites of HBCR, the sample content was transformed into a visualized heat map (Figure 17). The horizontal and vertical axes represent the sample and the biometabolic components, respectively, and the color shade reflects the value of the variable, with red indicating an upward adjustment of the relative content of the substance and blue indicating a downward adjustment of the relative content of the substance.
| Name | Molecular formula | Add | Inaccuracies | VIP | Categorization | HMDB |
|---|---|---|---|---|---|---|
| Epsilon caprolactam | C6H11NO | +H | −0.9 | 1.01516 | Lactams | HMDB0062769 |
| Fluoroacetic acid | C2H3FO2 | +K | 10.6 | 1.78681 | Carboxylic acids and derivatives | HMDB0252369 |
| Acryloyl chloride | C3H3ClO | +K | 1 | 1.27441 | Carboxylic acids and derivatives | HMDB0247973 |
| 2,4-Diaminopyrimidine | C4H6N4 | +K | 3.6 | 9.16343 | Diazines | HMDB0245447 |
| Cysteine hydrochloride | C3H8ClNO2S | +H | −4.1 | 2.18579 | Carboxylic acids and derivatives | HMDB0303385 |
| Fuberidazole | C11H8N2O | +H + CH3OH | 0.7 | 1.10806 | Benzimidazoles | HMDB0341317 |
| Diphenoxylate | C30H32N2O2 | +2H | −0.5 | 1.13128 | Benzene and substituted derivatives | HMDB0015213 |
| Oleamide | C18H35NO | +H | 0.6 | 1.62642 | Fatty acyls | HMDB0002117 |
| Metkephamid | C29H40N6O6S | +2H | −7.4 | 9.4545 | Carboxylic acids and derivatives | HMDB0254677 |
| Glutamylhistidine | C11H16N4O5 | +NH4 | 0.6 | 1.7053 | Carboxylic acids and derivatives | HMDB0028821 |
| Arachidonic acid | C20H32O2 | +H | 0.2 | 1.47971 | Fatty acyls | HMDB0001043 |
| Trichloroethanol glucuronide | C8H11Cl3O7 | +Na | −0.4 | 1.03604 | Organooxygen compounds | HMDB0042049 |
| Roxatidine acetate | C19H28N2O4 | +H | −1.3 | 1.02912 | Piperidines | HMDB0015695 |
| Retinol acetate | C22H32O2 | +Na | −2.5 | 1.33193 | Prenol lipids | HMDB0035185 |
| Docosahexaenoic acid | C22H32O2 | +Na | −2.5 | 1.17752 | Fatty acyls | HMDB0002183 |
| Tetramethylscutellarein | C19H18O6 | +Na | −0.8 | 1.05862 | Flavonoids | HMDB0030575 |
| Pipericine | C22H41NO | +H + CH3OH | −0.3 | 1.20202 | Fatty acyls | HMDB0031678 |
| Melinamide | C26H41NO | +Li | −0.7 | 1.2376 | Fatty acyls | HMDB0254425 |
| Solanthrene | C27 H43N | +Na | 0.1 | 3.43886 | Steroids and steroid derivatives | HMDB0302981 |
| Cholesteryl chloride | C27H45Cl | +Na | 9 | 1.5492 | Steroids and steroid derivatives | HMDB0250184 |
| N6-[2-[5-(Diethylamino)pentan-2-ylamino]-6-methyl-4-pyrimidinyl]-2-methylquinoline-4,6-diamine | C24H35N7 | +Li | −4.5 | 2.51415 | Quinolines and derivatives | HMDB0255777 |
| 17-Estradiol cyclooctyl acetate | C28H40O3 | +H + CH3OH | −2.4 | 1.37956 | Steroids and steroid derivatives | HMDB0247180 |
| Glycohyocholic acid | C26H43NO6 | +NH4 | −2 | 2.19414 | Steroids and steroid derivatives | HMDB0240607 |
| LysoPC(16:0/0:0) | C24H50NO7P | +H | 0.5 | 19.1704 | Glycerophospholipids | HMDB0240262 |
| LysoPC(17:0/0:0) | C25H52NO7P | +H | 0.8 | 3.73685 | Glycerophospholipids | HMDB0012108 |
| Cer(d18:0/14:0) | C32H65NO3 | +H | −0.9 | 3.6931 | Sphingolipids | HMDB0011759 |
| LysoPC(18:3(6Z,9Z,12Z)/0:0) | C26H48NO7P | +Na | 0.2 | 10.0961 | Glycerophospholipids | HMDB0010387 |
| LysoPC(20:5(5Z,8Z,11Z,14Z,17Z)/0:0) | C28H48NO7P | +H | 3.5 | 5.18232 | Glycerophospholipids | HMDB0010397 |
| Ganoderiol G | C31H52O5 | +K | 0.6 | 1.26921 | Prenol lipids | HMDB0037780 |
| Cer(d18:0/18:0) | C36H73NO3 | +H | −0.3 | 2.69519 | Sphingolipids | HMDB0011761 |
| Quadranguloside | C54H90O23 | +2Na | −4 | 1.35609 | Steroids and steroid derivatives | HMDB0035905 |
| Mobocertinib | C32H39N7O4 | +H | −6.8 | 1.46247 | Benzene and substituted derivatives | HMDB0304841 |
| Bilirubin | C33H36N4O6 | +NH4 | −1 | 1.49483 | Tetrapyrroles and derivatives | HMDB0000054 |
| Jujuboside A1 | C58H94O26 | +2H | 3 | 1.20791 | Prenol lipids | HMDB0032779 |
| D-Leucic acid | C6H12O3 | -H | 0.3 | 1.81829 | Fatty Acyls | HMDB0000624 |
| 3,5-Dihydroxyanisole | C7H8O3 | -H2O-H | 3.9 | 1.10414 | Phenols | HMDB0132905 |
| 2,2,2-Trifluoroethyl | C4H2F6 | -F | 2.9 | 1.70704 | Organofluorides | HMDB0244040 |
| Pentafluoropropionic acid | C3HF5O2 | -Cl | 3.7 | 1.51147 | Alkyl halides | HMDB0256333 |
| 3-(3′-methylthio)propylmalate | C9H16S3 | -H-H2O | 3.7 | 1.22051 | Hydroxy acids and derivatives | HMDB0304106 |
| Benzyl sulfate | C7H8O4S | -H | 1 | 1.00309 | Benzene and substituted derivatives | HMDB0034782 |
| Malic acid | C4H6O5 | -Br | −0.9 | 1.3244 | Hydroxy acids and derivatives | HMDB0000156 |
| 5b-Cyprinol sulfate | C27H48O8S | -2H | 6 | 1.11868 | Steroids and steroid derivatives | HMDB0006888 |
| Butyl (S)-3-hydroxybutyrate glucoside | C14H26O8 | -H2O-H | 3.5 | 1.24658 | Fatty acyls | HMDB0031694 |
| Etomidate | C14H16N2O2 | -Br | 5.8 | 2.05649 | Azoles | HMDB0014437 |
| Thyrotropin releasing hormone | C16H22N6O4 | -H | −0.4 | 1.07147 | Steroids and steroid derivatives | HMDB0060080 |
| Latanoprost acid | C23H34O5 | -F | −4.1 | 3.67182 | Fatty acyls | HMDB0253988 |
| Tetradecanedioic acid | C14H26O4 | -H | 1.6 | 1.11547 | Fatty acyls | HMDB0000872 |
| Trichloroethanol glucuronide | C8H11Cl3O7 | -H | 2.5 | 1.26391 | Organooxygen compounds | HMDB0042049 |
| Buclizine | C28H33ClN2 | -Cl | 6.2 | 4.99748 | Benzene and substituted derivatives | HMDB0014498 |
| LysoPC(18:1(11Z)/0:0) | C26H52NO7P | -Cl | 1 | 1.41293 | Glycerophospholipids | HMDB0010385 |
3.5.2. Analysis of Differential Metabolite Pathways
The HMDB ID information of different extraction sites for the treatment of different components of IBS-D was imported into the MetaboAnalyst 5.0 online website for pathway enrichment correlation analysis. As shown in Table 6, EA, NBA, and DCM may exert therapeutic effects by modulating pyruvate metabolism, arachidonic acid metabolism, glyoxylate and dicarboxylic acid metabolism, porphyrin metabolism, the citric acid cycle, the biosynthesis of unsaturated fatty acids, and the metabolism of exogenous substances by cytochrome P450. PE may exert therapeutic effects by modulating pyruvate metabolism, arachidonic acid metabolism, and unsaturated fatty acid biosynthesis.
| Pathway name | Match status | p | −log (p) | Holm p | FDR | Impact | Details |
|---|---|---|---|---|---|---|---|
| Biosynthesis of unsaturated fatty acids | 2/36 | 0.007195 | 2.143 | 0.57558 | 0.57558 | 0 | KEGG |
| Citrate cycle (TCA cycle) | 45,677 | 0.073926 | 1.1312 | 1 | 1 | 0.04412 | KEGG SMP |
| Pyruvate metabolism | 45,680 | 0.084611 | 1.0726 | 1 | 1 | 0.0283 | KEGG SMP |
| Porphyrin metabolism | 45,688 | 0.1126 | 0.94844 | 1 | 1 | 0.0528 | KEGG |
| Glyoxylate and dicarboxylate metabolism | 1/32 | 0.11605 | 0.93534 | 1 | 1 | 0 | KEGG |
| Glycerophospholipid metabolism | 1/36 | 0.12974 | 0.88694 | 1 | 1 | 0.01736 | KEGG |
| Arachidonic acid metabolism | 1/44 | 0.15657 | 0.80529 | 1 | 1 | 0.27659 | KEGG SMP |
| Metabolism of xenobiotics by cytochrome P450 | 1/68 | 0.23298 | 0.63269 | 1 | 1 | 0 | KEGG |
4. Discussion
The regulation of gastrointestinal power is enhanced after CR has been concocted with honey bran, and it is commonly used clinically for the treatment of gastrointestinal disorders such as diarrhea and gastroptosis. IBS-D is a disorder of the brain–gut axis with clinical manifestations such as abdominal pain, diarrhea, and abdominal discomfort. In the present study, the chemical constituents of different extracted parts of HBCR were analyzed using UPLC-Q-TOF-MS/MS. Senna gavage was combined with continued restraint to establish an IBS-D rat model to study the pharmacological effects of different parts of the HBCR. The potential effector components of HBCR were screened for the treatment of IBS-D by the spectrum–effect relationship technique. To validate the potential effector components with network pharmacology, the core targets were screened, the BP and the possible signaling pathways of HBCR in the treatment of IBS-D were explored, and the mechanism of action was elucidated. The good binding capacity of the effector components to the core target was demonstrated by molecular docking.
5-HT is an important neurotransmitter of the brain–gut axis, and its systemic dysfunction leads to abnormal gastrointestinal motility and visceral sensitivity [8]. The expression of 5-HT in the colon and hypothalamus was decreased, suggesting that HBCR can inhibit the expression of 5-HT in the brain–gut axis to treat IBS-D. TNF-α modulates nerve fibers in the intestinal mucosal and smooth muscle layers through neural and endocrine systems, leading to IBS-D disease [9]. VIP is an inhibitory neurotransmitter, and its aberrant expression affects the contraction of intestinal smooth muscle and promotes intestinal peristalsis, which leads to diarrhea [10]. The expressions of TNF-α and VIP in the colon of IBS-D rats were decreased to different degrees, indicating suppressed inflammatory response and improved regulation of gastrointestinal dynamics. SP is an excitatory neurotransmitter that increases gastrointestinal motility and promotes colonic motility [11]. BDNF, a functional factor in pain co-emotion regulation of the brain–gut axis, affects gut hypersensitivity in IBS-D through the activation of gut nerve fibers [12]. The expressions of SP and BDNF in the hypothalamus of IBS-D rats were decreased to different degrees, suggesting that honeybush asparagus can modulate CNS nociception, inhibit gastrointestinal motility, and reduce intestinal sensitivity by inhibiting SP and BDNF. NGF is an important mediator of inflammatory pain, and abnormal increases lead to nociceptive sensitization, which leads to visceral hypersensitivity [13]; TRPV1 is an excitatory receptor potential channel that is widely distributed in the mucosal and submucosal layers of the gastrointestinal tract, and aberrant expression affects visceral hypersensitivity, which is significantly associated with abdominal pain symptoms [14]. Immunohistochemical sections showed different degrees of decreased expressions of both NGF and TRPV1 in the colon of IBS-D rats, indicating a moderation of nociceptive sensitivity and downregulation of visceral hypersensitivity.
The pathogenesis of IBS-D is caused by disorders of the enteric and central nervous systems leading to dysregulation of gastrointestinal dynamics and visceral sensitization [15]. The hypothalamus, as a key nucleus in the central nervous system for integrating visceral sensation and autonomic nerve function, can reflect the interactive regulation state of the brain–gut axis through changes in its neurotransmitters and neurotrophic (NT) factors. Both NGF and BDNF are NTs that are key trophic factors in the regulation of neural development, survival, and function and bind to tropomyosin-related kinase (Trk) receptors to form the NTs–Trk signaling pathway (NGF–TrkA and BDNF–TrkB signaling pathway). After NTs–TrK receptor binding, the NGF–TrKA and BDNF-–TrkB complexes formed are transported to the dorsal root ganglion, which upregulates TRPV1 expression. In turn, sensitization channels open, and cations such as Na+ and Ca2+ enter the cell to stimulate the release of pain mediators such as SP. These are involved in mediating the phenomenon of hypersensitivity, resulting in the onset of visceral hypersensitization. The NTs–TrK signaling pathway can also drive the proliferation of intestinal stem cells by activating the Wnt signaling pathway, which induces 5-HT production to mediate the 5-HT signaling pathway and contribute to the development of visceral hypersensitivity. TRPV1, a key ion channel protein, is closely related to visceral hypersensitivity in the colon and reflects the activity of gut sensory neurons. NGF upregulates TRPV1 expression, participates in visceral hypersensitivity, and its changes indicate gut neuroinflammation and sensitivity. It was hypothesized that HBCR can inhibit the release of TRPV1 and SP mediators by downregulating the expressions of BDNF and NGF. HBCR can affect the production of 5-HT to alleviate the development of visceral hypersensitivity, thereby inhibiting the production of inflammatory factors such as TNF-α and downregulation of gastrointestinal motility by VIP to treat IBS-D.
The spectrum–effect relationship analysis showed that fukiic acid, cimicifugic acid C, piscidic acid, cimicifugic acid B, cimicifugic acid A, and cimicifugic acid D are potentially effective components for HBCR for invigorating spleen and replenishing Qi. Cimicifugic acids A–D have anti-inflammatory properties and significantly inhibit the expression of TNF-α. Cimicifugic acids A and B also significantly inhibit the expression of 5-HT [16]. Fukiic acid can inhibit the activities of alpha-amylase and carboxypeptidase A and relieve gastrointestinal stress [17], and Piscidic acid has antienterovirus 71 activities for the treatment of gastrointestinal disorders. These results suggest that cimicifugic acids A–D [18], fukiic acid, and piscidic acid have therapeutic effects on IBS-D. Meanwhile, the network pharmacology results showed that these six components could play a role in the treatment of IBS-D disease through multiple targets, such as CASP3, NFKB1, NFKBIA, STAT1, MDM2, IRF1, and MAPK1, as well as other signaling pathways such as the pathways of neurodegenerative diseases, TNF signaling, bile secretion, and others to treat IBS-D disease. The potentially effective components were molecular docked to the core target. The energies for the binding of these six components to the core target showed activity. Cimicifugic acids A–D showed strong binding activity. The group’s previous research found that the content of fukiic acid, piscidic acid and cimicifugic acid B increased significantly, and the content of the components of cimicifugic acids A and D was elevated after CR was concocted by honey bran. Pharmacological experiments show that HBCR is superior to CR in regulating gastrointestinal dynamics [2]. Therefore, it further confirms that these ingredients may be the effective components of it for replenishing qi to increase yang effects. These results proved the scientific validity of the potential effective components screened by spectral effect correlation analysis in this study and laid a scientific foundation for the next step of effective components’ activity research.
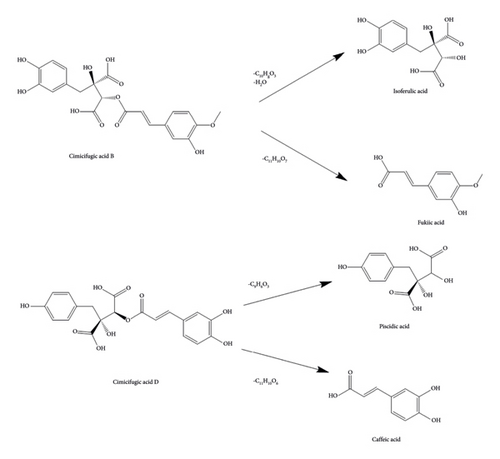
By examining the cleavage pattern of phenolic acids in honey bran asparagus, it was found that cimicifugic acids A-D could be decomposed into ferulic acid, isoferulic acid, fukiic acid, piscidic acid, caffeic acid, and other components with small molecular weights. Among them, cimicifugic acids A and B can obtain ferulic acid and isoferulic acid, respectively, and both of them produce the dehydration peak of fukiic acid; cimicifugic acids C and D can be cleaved to obtain caffeic acid and piscidic acid (Figure 18). Ferulic acid, isoferulic acid, and caffeic acid are the main active ingredients in asiatica; meanwhile, the group’s previous research found that the content of fukiic acid, piscidic acid, and cimicifugic acid B increased significantly after asiatica was concocted by honey bran, and the content of cimicifugic acids A and D was also increased. It is speculated that the content of the components of cimicifugic acids A-D, fukiic acid, and piscidic acid increased after the concoction of Ascophyllum officinale, which, when taken, enhances the tonic effect of Ascophyllum officinale, and thus acts as a therapeutic treatment for IBS-D. This process may be closely related to the high temperatures in the process of concoctions, auxiliary materials, and other factors. It is speculated that the content of the components of cimicifugic acids A-D, fukiic acid, and piscidic acid increased after the CR concoction. After taking, the efficacy of CR in replenishing qi to increase yang was enhanced and thus played a therapeutic role in the treatment for IBS-D. This process may be closely related to the high temperature and excipients in the concoction process.
The multicomponent and multitarget nature of TCM leads to the complexity and diversity of the mechanisms by which it exerts its therapeutic effects. In order to further explore the intrinsic effect mechanism of HBCR in the treatment of IBS-D, serum metabolomics was carried out by the UPLC-Q-TOF-MS technology. The results showed that HBCR could regulate unsaturated fatty acid biosynthesis metabolism, arachidonic acid metabolism, pyruvic acid metabolism, and other pathways to exert therapeutic effects on IBS-D.
Fukiic acid, cimicifugic acid C, piscidic acid, and cimicifugic acid A may modulate metabolic pathways by adjusting the NAD+/NADH ratio or activating AMPK signaling. These compounds can influence the biosynthesis of unsaturated fatty acids by affecting fatty acid synthase (FASN) and acetyl-CoA carboxylase (ACC). They may also impact arachidonic acid metabolism by altering the activity of cyclooxygenase (COX) and lipoxygenase (LOX), which are responsible for producing prostaglandins, thromboxanes, leukotrienes, and lipoxins. In addition, these compounds can affect pyruvate metabolism by influencing pyruvate dehydrogenase (PDH) and pyruvate carboxylase (PC), which are crucial for converting pyruvate into acetyl-CoA for the tricarboxylic acid (TCA) cycle or into oxaloacetate for the TCA cycle or gluconeogenesis.
Cimicifugic acid B, an antioxidant with an IC50 value of 21 μM in the DPPH assay, can reduce oxidative stress, increase the NAD+/NADH ratio, and activate AMPK. By inhibiting ACC and FASN, it indirectly affects the metabolism of unsaturated fatty acids, arachidonic acid, and pyruvate. Cimicifugic acid D, known for its anti-inflammatory properties and ability to modulate intracellular redox status, may further influence these metabolic processes by reducing the production of inflammatory mediators such as prostaglandins and maintaining intracellular homeostasis.
Among them, the lack of unsaturated fatty acids such as ω-3 would lead to an increase in inflammatory response, which in turn aggravated the condition of intestinal diseases; prostaglandins produced by the metabolism of arachidonic acid could be involved in the protection and repair of the gastric mucosa, which to a certain extent could alleviate the inflammatory response, thus alleviating gastrointestinal diseases; pyruvic acid is an important organic acid, which participates in a variety of metabolic pathways in the human body, including the TCA cycle and fatty acid synthesis. Pyruvic acid was an important organic acid that participated in various metabolic pathways in the human body, including the TCA cycle and fatty acid synthesis, and abnormal metabolism of pyruvic acid could cause intestinal diseases.
5. Conclusion
In this study, UPLC-Q-TOF-MS/MS mapping was combined with pharmacodynamic experiments to analyze the chemical constituents of different extracted parts of HBCR and screen the potential effector constituents for the treatment of IBS-D. The results showed that different extracted parts of HBCR had different therapeutic effects on IBS-D rats, with EA showing the best effect. HBCR inhibited the release of TRPV1 and SP mediators by downregulating the expressions of BDNF and NGF. It also affected the production of 5-HT to alleviate the development of visceral hypersensitivity and inhibit the production of inflammatory factors such as TNF-α and the downregulation of gastrointestinal motility by VIP to treat IBS-D. The potentially effective components of HBCR were determined using spectrum–effect relationship screening. They included fukiic acid, cimicifugic acid C, piscidic acid, cimicifugic acid B, cimicifugic acid A, and cimicifugic acid D. Meanwhile, the six effector components were validated by network pharmacology and molecular docking to treat IBS-D through multiple targets and pathways. Serum metabolomics studies have shown that honey bran asparagus can modulate unsaturated fatty acid biosynthesis metabolism, arachidonic acid metabolism, pyruvic acid metabolism, and other pathways to exert therapeutic effects on IBS-D.
Nomenclature
-
- CR
-
- Cimicifuga Rhizoma
-
- HBCR
-
- Honey Bran Cimicifuga Rhizoma
-
- IBS-D
-
- Diarrhea-predominant irritable bowel syndrome
-
- NC
-
- Negative control
-
- PE
-
- Petroleum ether
-
- DCM
-
- Dichloromethane
-
- EA
-
- ethyl acetate
-
- NBA
-
- n-Butyl alcohol
-
- AE
-
- Aqueous extract
-
- TE
-
- Total extract
-
- PC
-
- Positive control
-
- MC
-
- Model control
-
- AWR
-
- Abdominal withdrawal reflex.
Conflicts of Interest
The authors declare no conflicts of interest.
Author Contributions
Yigeng Wu, Xiaoxia Deng, and Xiao Xue integrated the data. Yigeng Wu and Jing Zhu wrote and revised the manuscript. Yigeng Wu, Xiaoxia Deng, Xiao Xue, and En Yuan accomplished the compositional analysis and pharmacological studies. Yuxuan Zou, Yiming Huang, and Lingyun Zhong executed the literature search. Li Yan, Songhong Yang, and Hao Chen directed the data processing. Jing Zhu conceptualized and designed the experimental plan. All authors participated in drafting of the manuscript and revising it before final submission. Yigeng Wu, Xiaoxia Deng, and Xiao Xue contributed equally to this work and share the first authorship. Yigeng Wu, Xiaoxia Deng, and Xiao Xue have contributed equally to this work.
Funding
This work was supported by the Jiangxi Province “Double Thousand Talents” High-end Talent Program for Youth in Science and Technology Innovation (Grant no. xsg2023201117), the Jiangxi Provincial Academic and Technical Leaders of Major Disciplines Young Talents Training Program (Grant no. 20212BCJ23019), the National Key Research and Development Program (Grant no. 2023YFC3504200), the Jiangxi Provincial Natural Science Foundation (Grant no. 20224BAB216102), the Jiangxi Provincial Key Research and Development Program “Unveiling the List of Commander-in-Chief” Project (Grant no. 20223BBG71001), and the Jiangxi University of Traditional Chinese Medicine Traditional Chinese Medicine Concoctions Technology Inheritance Innovation Team Construction Project (Grant no. CXTD22003).
Acknowledgments
The authors are thankful to the Jiangxi University of Traditional Chinese Medicine for the help in conducting this study.
Open Research
Data Availability Statement
The datasets used and/or analyzed during the current study are available from the corresponding author upon reasonable request.


