Docosahexaenoic Acid Inhibits p62-Dependent Autophagy by Targeting HSP70A1A/TGM-2 Axis to Alleviate Arecoline-Induced Oral Submucosal Fibrosis
Abstract
Background: The role of docosahexaenoic acid (DHA) in fibrosis of other organs has been studied, but its function in oral submucous fibrosis (OSF) has not been reported. This study aimed to investigate the role and mechanism of DHA in OSF.
Methods: OSF rat and cell models were established induced by arecoline. Through a series of in vivo and in vitro experiments, the function of DHA in OSF was investigated. Mechanistically, the interaction of TGM-2 with HSP70A1A and p62 proteins was validated using co-immunoprecipitation. Additionally, in cells transfected with overexpression vectors of HSP70A1A or TGM-2 and treated with DHA and arecoline or co-treated with a p62 inhibitor XRK3F2 along with DHA and arecoline, the function of the DHA/HSP70A1A/TGM-2/p62 axis in OSF was explored.
Results: In vivo, arecoline caused severe pathological damage and fibrosis in rat oral mucosal tissues and induced overexpression of HSP70A1A. Arecoline treatment also elevated tissue ROS levels and the expression of α-SMA, Collagen I, TGM-2, and LC3 II/I, while decreasing tissue p62 protein expression and serum GSH levels. Treatment with DHA reversed these changes and improved the pathological damage and fibrosis in OSF rats. In vitro, arecoline induced the expression of HSP70A1A in a concentration-dependent manner, and DHA inhibited its expression by directly binding to HSP70A1A and reducing the expression of α-SMA, Collagen I, TGM-2, LC3 II/I, and ROS levels induced by arecoline in cells, while increasing p62 protein expression and GSH levels in cell supernatants. Furthermore, arecoline induced TGM-2 expression, and overexpression of HSP70A1A counteracted the protective effect of DHA on cells and the suppression of TGM-2 expression. TGM-2 interacted with HSP70A1A and p62 proteins. Overexpression of TGM-2 or treatment with XRK3F2 activated autophagy and abolished the protective effect of DHA on cells.
Conclusion: DHA inhibits p62-dependent autophagy through targeting the HSP70A1A/TGM-2 axis, thereby alleviating arecoline-induced OSF. These results suggest that DHA and its mediated autophagy regulation mechanism can be a therapeutic target for OSF.
1. Introduction
Oral submucous fibrosis (OSF) is a collagen metabolism disorder characterized by chronic inflammation and pathological fibrosis of the oral connective tissue, primarily attributed to the habit of chewing betel nuts [1]. Arecoline, as the active ingredient in betel nuts, promotes the progression of local oral inflammation to buccal mucosa fibrosis, which is associated with sustained deposition or reduced degradation of extracellular matrix (ECM) protein in the subepithelial layer of oral mucosa and increased oxidative stress [2, 3]. Currently, the treatment of OSF mainly relies on intralesional injection of corticosteroids, but it is unable to achieve complete recovery in patients, and more alarmingly, it may lead to adverse effects such as osteoporosis, avascular necrosis, and edema [2, 4]. Therefore, it is necessary to further elucidate the pathogenesis of OSF to provide new, safe, and effective strategies for its treatment.
Heat shock protein 70 (HSP70) is a stress-induced protein essential for maintaining the folding and assembly capacity of proteins [5]. Elevated serum levels of HSP70 have been associated with pulmonary fibrosis, oxidative stress, and inflammation associated with systemic sclerosis [6]. Notably, overexpression of HSP70 appears to be a critical factor in the progression of OSF to oral squamous cell carcinoma [7, 8]. Docosahexaenoic acid (DHA) is an essential fatty acid in the human body and can act as an inhibitor of HSP70 [9]. DHA may exert antifibrotic effects by reducing the activation of hepatic stellate cells induced by TGF-β1 and promoting a fibrotic phenotype [10]. DHA has shown improvements in renal and hepatic fibrosis, as well as alleviation of oxidative stress and inflammatory responses [11–13]. A member of the heat shock protein family A, 1A (HSPA1A), is one of the most important members of the HSP70 family [14]. However, whether DHA improves OSF progression by inhibiting HSP70 family members remains to be explored.
According to a report, transglutaminase-2 (TGM-2) is a stress response protein that can be induced by oxidative stress, tissue damage, and inflammatory factors [15]. Upregulation and translocation of TGM-2 play a crucial role in inducing ECM stability and deposition, thereby promoting renal fibrosis [16]. Increased TGM-2 expression is involved in the development of hepatic fibrosis after Schistosoma japonicum infection [17]. TGM-2 activity induction promotes fibrosis in lung and heart tissues under conditions of pulmonary arterial hypertension [18]. Inhibition of TGM-2 may have a potential protective effect on skin fibrosis in patients with systemic sclerosis [19]. Interestingly, other researchers have found increased expression of TGM-2 in OSF tissue and fibroblasts induced by arecoline [20]. Furthermore, higher levels of TGM-2 can enhance the activation of the TGF-β pathway [21], which is considered a profibrotic factor in arecoline-induced OSF [22]. Additionally, there is an interaction between TGM-2 and HSP70 in acute kidney injury [23]. The interaction between TGM-2 and GRP75 (a member of the HSP70 family) maintains cellular mitochondrial homeostasis under stress [24]. However, the protective role of TGM-2 downregulation in the progression of OSF and the interaction between TGM-2 and HSP70 in OSF are still being evaluated.
Research indicates that in addition to increased oxidative stress and ECM deposition, the pathogenesis of OSF also involves excessive autophagy [25]. Autophagy is a common cellular degradation process in eukaryotes. Moderate autophagy is crucial for maintaining cellular homeostasis in response to stressors such as heat, oxidative stress, chemical damage, and pathogen infections, as it can clear damaged organelles and misfolded proteins [26]. Previous studies have reported the beneficial effects of TGM-2 inhibition [27] and DHA [28] in other diseases by regulation of the autophagy pathway. The interaction between HSP70 and Bim mediates the autophagic process in cells under stress [29]. However, the roles of DHA, HSP70 family, and TGM-2 in the progression of OSF and autophagy regulation remain unclear. Furthermore, excessive activation of fibroblasts can increase ECM generation and accumulation. It may lead to the secretion of inflammatory cytokines under inflammatory stimulation, exacerbating fibrosis and inflammatory responses in the body [30]. Therefore, in this study, we used the arecoline-induced oral mucosal fibroblasts as an in vitro research model. We simultaneously established an arecoline-induced OSF rat model to investigate the role of DHA in the progression of OSF and explore its mechanism.
2. Materials and Methods
2.1. Construction and Intervention Treatment of OSF
Model rats were obtained from Hunan Slake Jingda Laboratory Animal Co., Ltd (China). The rats were kept at 22°C–24°C with a 12:12 h light-dark cycle. The rats were randomly divided into the Control group, Model group, Model + DHA-L (DHA-Low) group, Model + DHA-M (DHA-Moderate) group, Model + DHA-H (DHA-High) group, and Model + DKK (Jiawei Danxuan Koukang) group, with 6 rats in each group.
An arecoline-induced OSF rat model was established by submucosal injection of arecoline in the oral mucosa [30]. Specifically, every two days, rats were injected submucosally under the cheek with 10 mg/mL of arecoline hydrobromide (B20112, yuanye, China) at a dosage of 0.2 mL per injection. For the drug intervention groups, model rats were orally gavaged with low, medium, and high doses of DHA (6.25, 12.5, 25 mg/kg) once daily [31]. Additionally, a DKK group (12 g/kg, five days a week) was set as a positive control [32]. Control rats were injected with saline every two days as a negative control [33]. After 49 days from the start of the experiment, all the rats were euthanized, and blood (serum) and buccal mucosa tissues were collected for further analysis. All experiments in this study were approved by the Laboratory Animal Ethics Committee of Hunan University of Traditional Chinese Medicine (Approval No. HN-LL-GZR-2023-43), and the regulations regarding the use of animals in the study were followed.
2.2. Histological Examination
The oral mucosa was fixed using 4% paraformaldehyde and then dehydrated with conventional gradient alcohol before making it transparent with xylene. The sample was soaked in melted paraffin for 3 h for the embedding process and was then cut into slices, 5 μm in thickness. After baking at 60°C for 12 h, paraffin sections were placed in xylene for 20 min, repeated 3 times. Subsequently, sections were soaked in series of ethanol concentrations—twice in 100%, then 95%, 85%, and finally 75%, with each stage lasting for 5 min. Sections were then immersed in distilled water for 5 min.
Next, hematoxylin and eosin (H&E) (AWI0001a and AWI0029a, Abiowell, China) staining and Masson (AWI0253, Abiowell) staining were performed on the baked paraffin sections as per standard protocols. The pathological changes and fibrosis of oral mucosa were observed under a microscope.
2.3. Molecular Docking Validation
The 3D structure diagram of DHA was downloaded from the PubChem database (https://pubchem.ncbi.nlm.nih.gov/). The 3D structure of HSP70A1A is obtained by RCSB PDB (https://www.rcsb.org/). VINA software was used to study the docking of compounds and proteins.
2.4. Cell Culture and Treatment
Rat oral fibroblasts (CP-R230, Procell) were cultured in fibroblast-specific culture medium (AW-MC027, Abiowell) and maintained in a 37°C humidified incubator with 5% CO2. Lipofectamine 2000 reagent (11668-019, Invitrogen, USA) was used to separately transfect the overexpression plasmids of TGM-2 (oe-TGM-2, HG-RO019386, HonorGene, China) and HSP70A1A (oe-HSP70A1A, HG-RO031971, HonorGene) into rat oral fibroblasts. The TGM-2 gene ID is 56083. HSP70A1A gene ID is 24472. The overexpression vectors of oe-TGM-2 and oe-HSP70A1A were constructed using pcDNA3.1.
Rat oral fibroblasts were treated with different concentrations of DHA (0, 0.5, 1, 2.5, 5, 7.5, 10, and 12.5 μg/mL) and arecoline (0.05, 0.10, 0.15, 0.20, and 0.30 mM) to determine the optimal treatment concentrations using the Cell Counting Kit-8 (CCK-8) assay. Based on the screening results, cells were treated with the corresponding concentrations of arecoline alone or in combination with DHA for 48 h, either in transfected or nontransfected cells. Additionally, nontransfected cells were treated with corresponding concentrations of arecoline, DHA, and 5 μM XRK3F2 (p62-ZZ inhibitor) [34] for 48 h.
2.5. CCK-8 Assay
5 × 10³ cells were inoculated in a 96-well plate for culture. After the required treatments, 10 μL of CCK-8 solution was added to each well, followed by incubation at 37°C for 4 h. The optical density of each well at 450 nm was measured using a microplate reader (MB580, HEALES, China).
2.6. Migration Assay
2 × 10⁵ cells in serum-free culture medium were seeded into transwell chambers (3428, Corning) with 500 μL of medium containing 10% FBS in the lower chamber. After 48 h of incubation, the cells on the upper surface of the chamber were fixed with 4% paraformaldehyde (N1012, NCM, China) and stained with 0.1% crystal violet staining solution (AWC0333a, Abiowell). Finally, the cells on the upper chamber surface were observed under a microscope (DSZ2000X, Cnmicro, China).
2.7. ROS Detection
Cells were collected and treated with a suitable volume of DCFH-DA (S0033M, Beyotime, China) at a final concentration of 10 μM. After a 20-minute incubation at 37°C in a cell culture incubator, cells were washed three times with serum-free cell culture medium to remove any unincorporated DCFH-DA. The fluorescence of each group cell was observed under a fluorescence microscope, and images were captured.
Rat oral mucosal tissues were minced and homogenized. 1 mL of DCFH-DA working solution was added to the cell suspension and incubated at room temperature for 30 min. The stained cells were then analyzed for ROS levels by flow cytometry to detect positive signals.
2.8. Western Blot (WB)
Total proteins were extracted from tissues and cells using RIPA lysate (AWB0136, Abiowell). BCA protein concentration assay kit (PC0020, Solarbio, China) was used to determine the concentration of the samples. Protein samples were separated on 10% SDS-PAGE, transferred to nitrocellulose membranes, and blocked with 5% skim milk (AWB0004, Abiowell). The membranes were incubated with primary antibodies including HSP70A1A (HY-P80712, 1:10000, Mouse, MCE, USA), α-SMA (55135-1-AP, 1:2000, Rabbit, Proteintech, USA), Collagen I (14695-1-AP, 1:2000, Rabbit, Proteintech), TGM-2 (15100-1-AP, 1:20000, Rabbit, Proteintech), LC3 (14600-1-AP, 1:2000, Rabbit, Proteintech), Vimentin (WA01208, 1:000, Mouse, Abiowell), Snail1 (13099-1-AP, 1:500, Rabbit, Proteintech), E-cadherin (20874-1-AP, 1:5000, Rabbit, Proteintech), p62 (18420-1-AP, 1:4000, Rabbit, Proteintech), and β-actin (66009-1-Ig, 1:5000, Mouse, Proteintech) at 4°C overnight. The membranes were then incubated with secondary antibodies, followed by detection using ECL Plus ultra-sensitive chemiluminescence reagent (AWB0005, Abiowell) and imaging in a gel imaging system. Finally, the exposed protein bands were analyzed by Quantity One professional grayscale analysis software to obtain the grayscale value of each protein and calculate the grayscale ratio between the target protein and the β-actin protein. Then the average gray value of 3 repetitions was taken as the relative expression of each target protein.
2.9. GSH Assay
Cellular or serum samples were collected, and the levels of GSH in rat serum and cell supernatant were measured using a microplate-reduced glutathione assay kit (A006-2-1, Nanjing Jiancheng, China).
2.10. Reverse Transcription Quantitative Polymerase Chain Reaction (RT-qPCR)
Total RNA was extracted from cells using TRIZOL (15596026, Thermo, USA). The extracted RNA was reverse transcribed into cDNA using a reverse transcription kit (CW2569, Cowin, China), followed by a qPCR reaction using the UltraSYBR Mixture kit (CW2601, Cowin). Data analysis was performed using the 2−ΔΔCt method and normalized to β-actin. The primer sequences are listed in Table 1.
| Primer | Sequences (5′-3′) | Product length (bp) |
|---|---|---|
| HSP70-F | CGAGGAGGTGGATTAGAGGC | 119 |
| HSP70-R | GCAGACCGAACGAAGGAGTTA | |
| β-Actin-F | ACATCCGTAAAGACCTCTATGCC | 223 |
| β-Actin-R | TACTCCTGCTTGCTGATCCAC | |
2.11. Transmission Electron Microscopy (TEM)
Cells were treated with 2.5% glutaraldehyde and fixed with 1% osmium tetroxide. The cells were dehydrated in graded ethanol (30∼90%) and stained with 2% uranyl acetate and lead citrate before observation under a transmission electron microscope (JEM1400, JEOL, Japan) to examine autophagosomes.
2.12. Co-Immunoprecipitation (Co-IP)
Protein was extracted from the cells using IP lysate. The protein supernatant was co-incubated with Anti-TGM2 (15100-1-AP, Proteintech) primary antibody or Anti-lgG (ab150077, Abcam) at 4°C overnight, and protein A/G agarose beads pretreated with lysate were added and incubated at 4°C for 2 h. After Co-IP, the obtained precipitated protein was eluted by boiling in 2 × SDS sample buffer, and WB analysis was performed.
2.13. Data Analysis
Statistical analysis of differences between multiple groups was performed using one- or two-way analysis of variance followed by a Tukey post hoc test. All data are presented as mean ± SD and analyzed using GraphPad Prism 8.0 software. A p value < 0.05 was considered statistically significant.
3. Results
3.1. DHA Inhibition of HSP70A1A Expression Improves Disease Characteristics in OSF Rats
To investigate the role of DHA in OSF, we established an arecoline-induced OSF rat model. Observation through H&E staining and Masson staining revealed that the oral mucosal tissues of rats in the Control group appeared normal with no significant fibrosis. In contrast, the oral mucosal tissues of rats in the Model group exhibited pathological damage and severe fibrosis. However, after treatment with DHA and DKK, the pathological damage and fibrosis showed improvement (Figures 1(a) and 1(b)). Furthermore, WB analysis showed that compared to the Control group, the expression of α-SMA, Collagen I, Vimentin, and Snail proteins significantly increased in the arecoline-induced Model group. In contrast, the expression of E-cadherin significantly decreased (Figure 1(c)). Flow cytometry results indicated that arecoline significantly induced ROS production (Figure 1(d)).
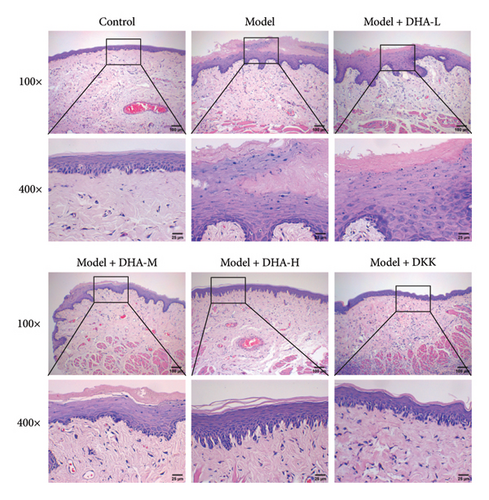
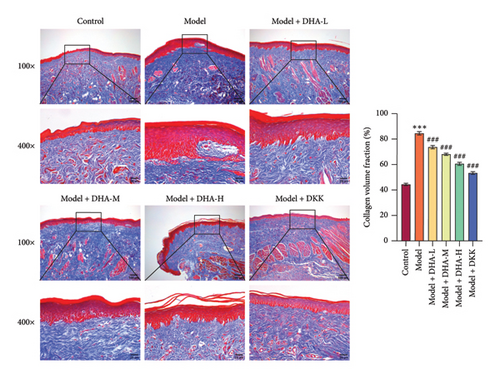
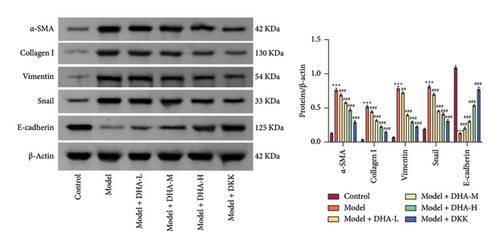
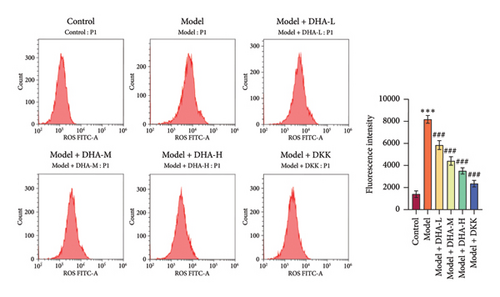
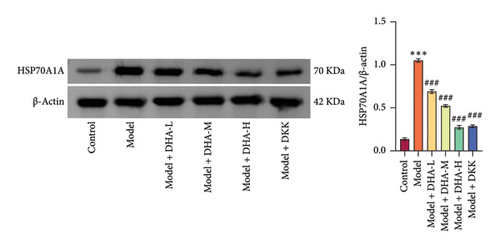
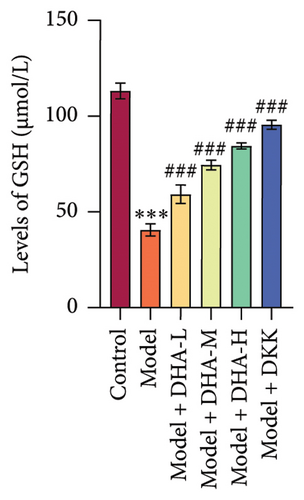

We also evaluated the influence of DHA on the protein expression family of HSP70A1A. WB detection found that arecoline significantly induced the protein expression of HSP70A1A (Figure 1(e)). ELISA detection showed that arecoline significantly inhibited GSH levels (Figure 1(f)). Finally, we assessed the changes in TGM-2 expression. WB analysis showed that arecoline significantly induced the protein expression of TGM-2. Treatment with DHA and DKK significantly reversed these changes. Importantly, the improvement effect of high-concentration DHA was superior to low and medium concentrations. These results suggest that DHA has a beneficial effect on pathological damage and fibrosis in arecoline-induced OSF rats, which may be associated with the downregulation of HSP70A1A and TGM-2.
3.2. DHA Inhibits the Expression of HSP70A1A by Binding to HSP70A1A
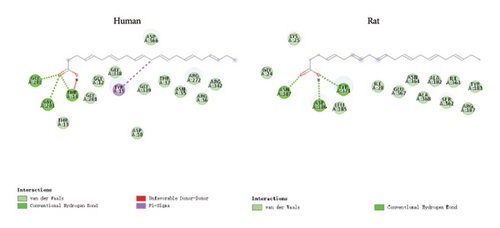
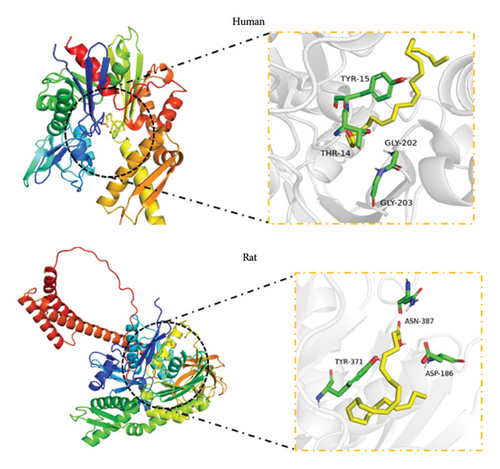
Molecular docking analysis revealed that the binding energy of DHA with human HSP70A1A protein was −6.8 kcal/mol, and with rat HSP70A1A protein was −5.5 kcal/mol. Their binding energies were less than −5 kcal/mol, indicating that DHA can spontaneously bind well to the HSP70A1A protein (Figures 2(a) and 2(b)).
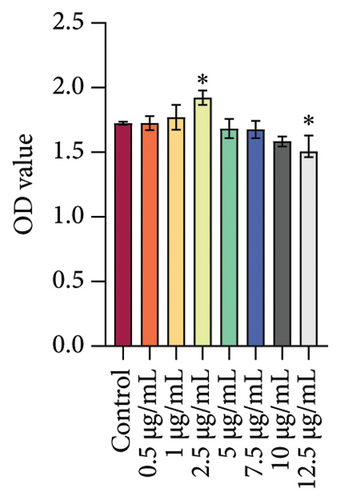
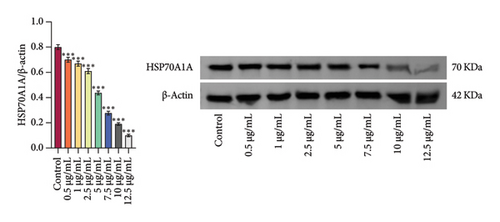
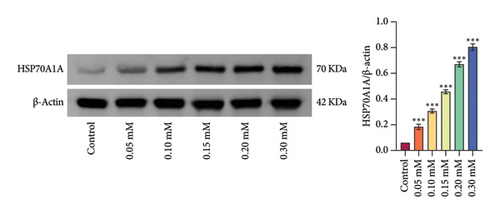
We treated rat oral fibroblasts with different concentrations (Control, 0.5, 1, 2.5, 5, 7.5, 10, and 12.5 μg/mL) of DHA. According to the detection results of CCK-8, DHA concentrations of 5 μg/mL and above inhibited cell viability with the increase of concentration, so we selected 2.5 μg/mL DHA as the cell intervention concentration (Figure 2(c)). Meanwhile, we found that DHA could inhibit the protein expression of HSP70A1A in a concentration-dependent manner (Figure 2(d)).
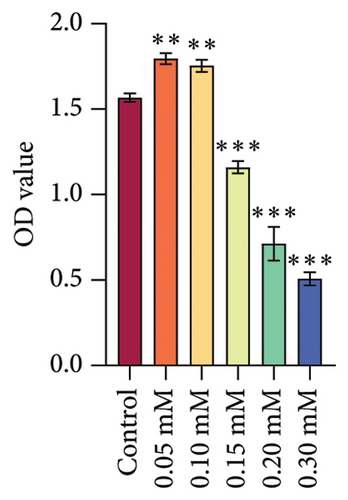
Subsequently, we treated rat oral fibroblasts with different concentrations of arecoline (Control, 0.05, 0.10, 0.15, 0.20, and 0.30 mM). CCK-8 assay showed that 0.05∼0.1 mM of arecoline significantly activated cell viability, while 0.15 mM of arecoline significantly inhibited cell viability. Therefore, 0.1 mM arecoline was used to model OSF cells in vitro (Figure 2(e)). At the same time, we investigated the effect of arecoline on HSP70A1A expression and found that arecoline significantly promoted HSP70A1A protein expression in a concentration-dependent manner (Figure 2(f)). These results suggest that DHA may inhibit its expression by directly binding to HSP70A1A, thereby improving pathological damage and fibrosis in OSF rats.
3.3. DHA Binding to HSP70AIA Inhibits Oxidative Stress and Fibrosis in Arecoline-Induced Rat Oral Fibroblasts
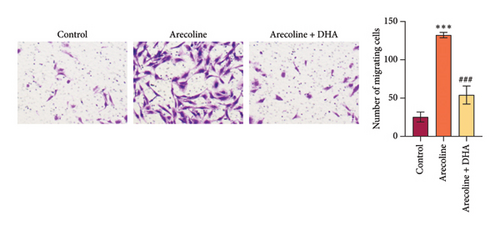
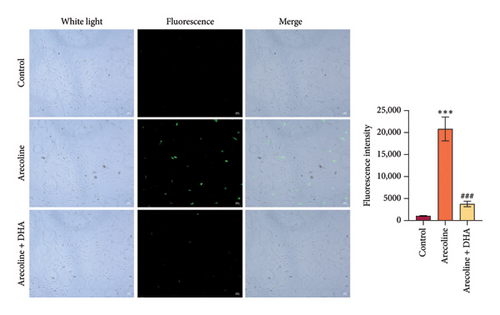
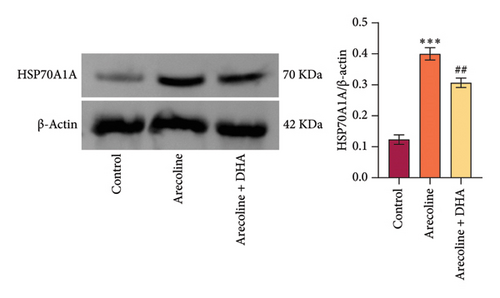
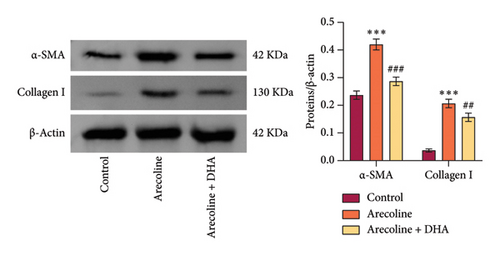
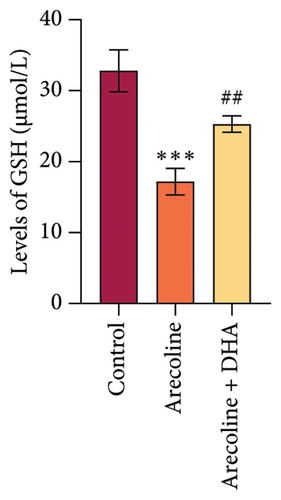
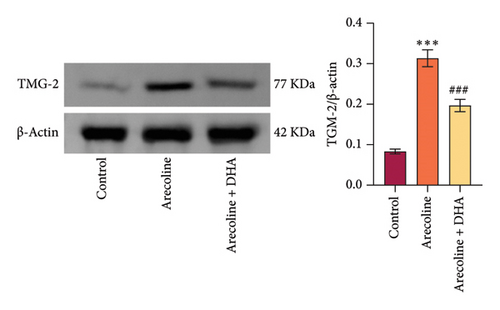
To investigate the role of DHA in OSF in vitro, we treated rat oral fibroblasts with arecoline alone or in combination with DHA. As expected, arecoline significantly promoted cell migration and increased ROS levels (Figures 3(a) and 3(b)). Arecoline also induced the expression of HSP70A1A, α-SMA, and Collagen I proteins (Figures 3(c) and 3(d)). Arecoline reduced the levels of GSH in cells (Figure 3(e)) and induced the expression of TGM-2 (Figure 3(f)). However, compared to treatment with arecoline alone, simultaneous treatment with DHA significantly reversed these changes. These results indicate that DHA inhibits oxidative stress and fibrosis in arecoline rat oral fibroblasts by binding to HSP70AIA, and this may be associated with the reduction in TGM-2 expression.
3.4. DHA Inhibits the HSP70A1A/TGM-2 Axis to Alleviate Oxidative Stress and Fibrosis in Arecoline-Induced Rat Oral Fibroblasts
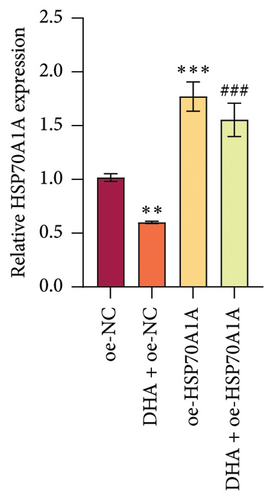
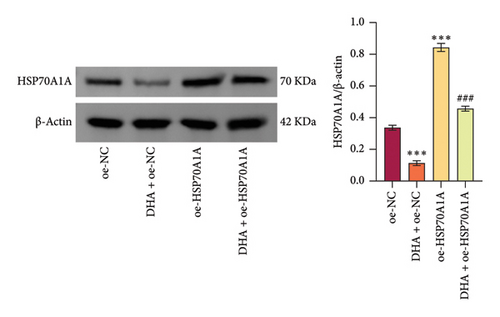
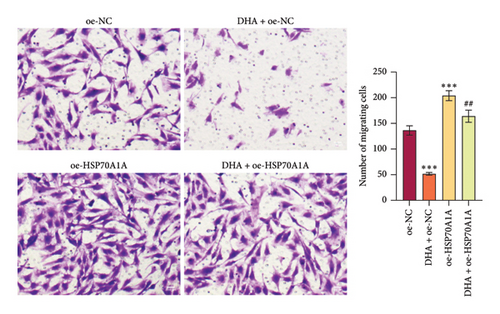
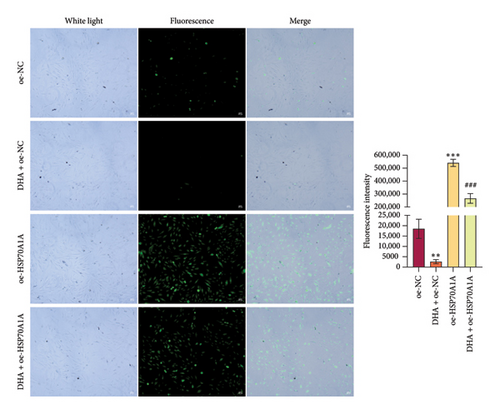
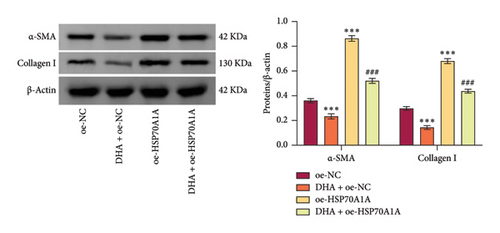
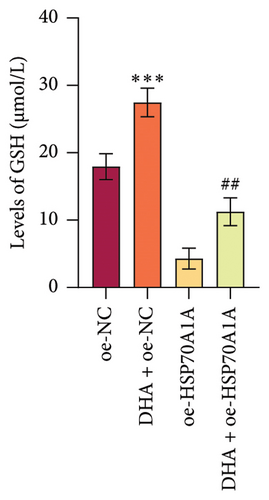
To further explore the mechanism of action of DHA in OSF, we constructed rat oral fibroblast cells overexpressing HSP70A1A and treated them with arecoline and DHA. Consistent with previous findings, RT-qPCR and WB analysis results revealed that DHA treatment significantly reduced the expression of HSP70A1A and TGM-2 (Figures 4(a) and 4(b)). Transwell assay results showed that DHA treatment significantly inhibited cell migration (Figure 4(c)). Immunofluorescence probe detection of ROS levels showed that DHA treatment significantly decreased ROS levels (Figure 4(d)). WB analysis indicated that DHA treatment significantly inhibited the protein expression of α-SMA and Collagen I, and increased the level of GSH (Figures 4(e) and 4(f)). This suggests that DHA treatment can inhibit oxidative stress and profibrotic phenotypes of arecoline-induced cells.
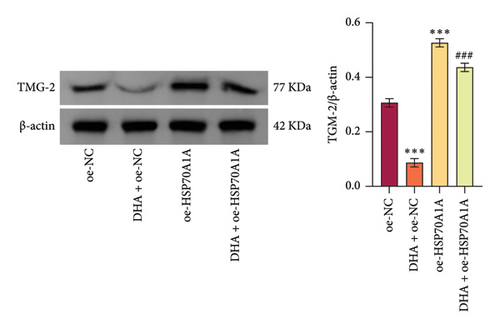
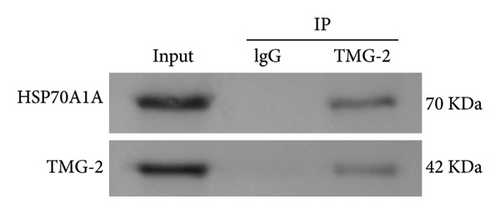
However, compared to the oe-NC group, overexpression of HSP70A1A in the oe-HSP70A1A group significantly exacerbated cell oxidative stress and fibrotic phenotype. When compared to the DHA + oe-NC group, in the DHA + oe-HSP70A1A group, overexpression of HSP70A1A reversed the improvement of DHA on cell oxidative stress and fibrosis (Figures 4(a), 4(b), 4(c), 4(d), 4(e), and 4(f)). Additionally, overexpression of HSP70A1A significantly promoted the protein levels of TGM-2 (Figure 4(g)). Finally, we confirmed the interaction between HSP70A1A and TGM-2 proteins through Co-IP analysis (Figure 4(h)). These results suggest that DHA alleviates oxidative stress and fibrotic phenotype induced by arecoline through inhibition of the HSP70A1A/TGM-2 axis.
3.5. DHA Targets the HSP70A1A/TGM-2 Axis to Inhibit p62-Dependent Autophagy and Alleviate Oxidative Stress and Fibrosis in Arecoline-Induced Rat Oral Fibroblasts
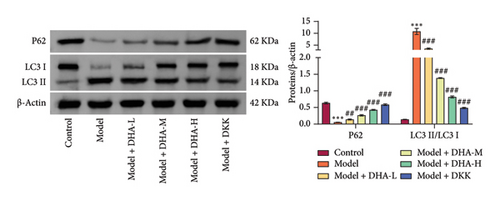
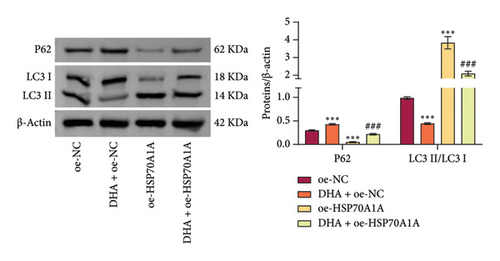
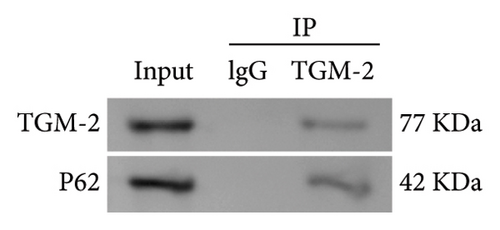
To explore the role of autophagy in the pathogenesis of OSF, we further investigated the expression of autophagy-related proteins. Results showed that arecoline significantly increased the expression of LC3 II/I and reduced p62 expression in rat oral mucosal tissues, compared with the Control group. At the same time, DHA and DKK markedly reversed this change, and the effect of high-concentration DHA was better than that of medium concentration (Figure 5(a)). Additionally, compared with the Model group, DHA treatment significantly decreased the expression of cellular LC3 II/I induced by arecoline and increased p62 expression. Compared to the oe-NC group, in the oe-HSP70A1A group, overexpression of HSP70A1A further promoted the expression of LC3 II/I induced by arecoline and further reduced p62 expression. In the DHA + oe-HSP70A1A group, overexpression of HSP70A1A reversed the inhibitory effect of DHA on LC3 II/I and its promotional effect on p62, compared to the DHA + oe-NC group (Figure 5(b)). Importantly, we confirmed the interaction between TGM-2 and p62 proteins through Co-IP analysis (Figure 5(c)).
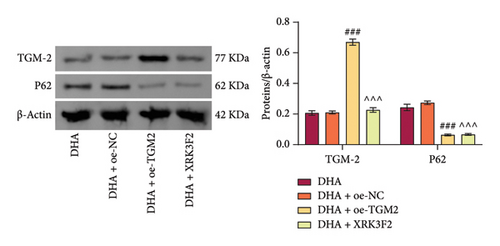

Next, we pre-overexpressed TGM-2 in cells and then treated them with DHA and arecoline or with DHA, arecoline, and XRK3F2 simultaneously. WB detection results showed that compared to the DHA + oe-NC group, the DHA + oe-TGM-2 group exhibited significantly increased TGM-2 expression and decreased p62 protein levels. Compared to the DHA group, in the DHA + XRK3F2 group, TGM-2 expression did not significantly change, while p62 protein levels significantly decreased (Figure 5(d)).
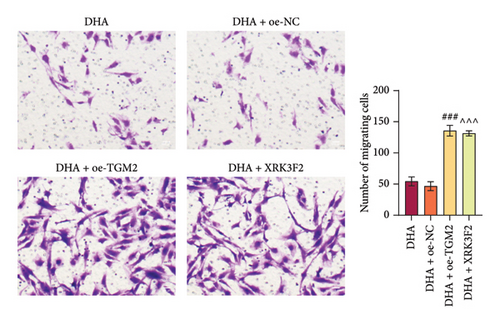
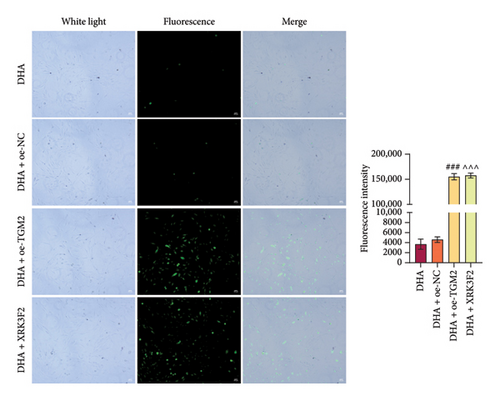
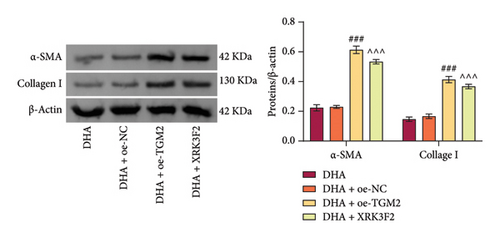
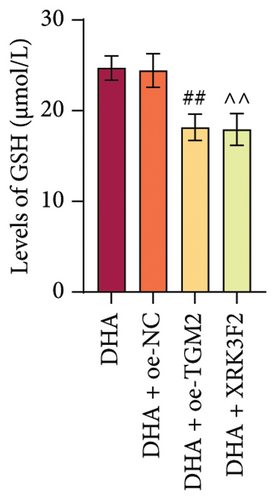
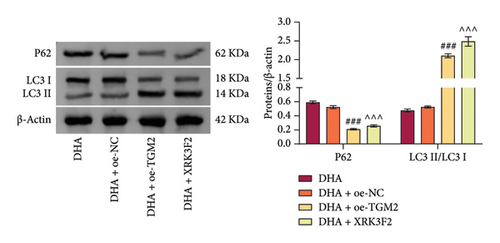
Furthermore, transwell and immunofluorescence probe detection results revealed that, compared to their respective control groups, the cell migration ability and ROS levels were significantly increased in the DHA + oe-TGM2 group and DHA + XRK3F2 group (Figures 5(e) and 5(f)). WB results showed that, compared to their respective control groups, the expression of α-SMA and Collagen I and the ratio of LC3 II/I were significantly increased, while p62 expression was significantly decreased in the DHA + oe-TGM2 group and DHA + XRK3F2 group (Figures 5(g) and 5(i)). ELISA results indicated that, compared to their respective control groups, the GSH levels in cells were significantly decreased in the DHA + oe-TGM2 group and DHA + XRK3F2 group (Figure 5(h)). TEM observed that the number of mitochondrial autophagosomes in DHA + oe-TGM-2 and DHA + XRK3F2 groups was increased compared with their control groups (Figure 5(j)). These results suggest that DHA may alleviate OSF by targeting the HSP70A1A/TGM2 axis to inhibit p62-dependent autophagy.
4. Discussion
While significant efforts have been made in research on OSF, the mechanisms underlying the progression of OSF remain incompletely understood. This study demonstrates that the administration of DHA exerts a protective effect in OSF rat models and OSF cell models induced by arecoline. Mechanistically, DHA administration regulates p62-dependent autophagy in oral fibrotic cells through the HSP70/TGM-2 axis, thereby conferring oral protective effects.
In the past, the role of DHA in fibrosis in other organs has been studied in animal models and clinical trials. Studies have reported an association between decreased DHA levels and kidney damage and fibrosis [35], and Polyporus umbellatus may improve renal fibrosis by upregulating levels of DHA metabolites [36]. Clinical trials have confirmed that supplementation with DHA can improve lung function in patients with cystic fibrosis [37] and reduce inflammation [38]. DHA may alleviate lung fibrosis, which could be related to reduced ECM deposition [39]. Our study found that in vivo administration of DHA suppresses the expression of fibrotic markers α-SMA and Collagen I and improves the pathological changes and tissue fibrosis in the oral mucosa of OSF rats. DHA-rich krill oil has been reported to alleviate liver and spleen fibrosis and promote the balance of oxidative-reduction reactions [40]. Our study found that DHA administration in vivo could reduce the increase of oxidative stress in oral mucosal tissues, as shown by DHA reversing arecoline-induced decrease of GSH level and increase of ROS level, which is consistent with the previously reported regulatory effects of DHA on ROS and GSH [41, 42]. In conclusion, our study suggests that DHA plays an interventional role in arecoline-induced OSF rats.
In addition, epithelial–mesenchymal transition (EMT) is characteristic of epithelial barrier damage and may contribute to the transformation of OSF into oral cancer [43]. Among them, α-SMA, Collagen I, Vimentin, Snail, and E-cadherin are the key markers of EMT [44, 45]. Our study found that in vivo administration of DHA can reduce the expression of key EMT proteins Vimentin and Snail in oral mucosal tissues, while promoting E-cadherin expression. This result suggests that DHA may help improve epithelial barrier damage in the oral mucosa and reduce the likelihood of OSF malignant transformation. At the cellular level, in vitro administration of DHA inhibits oxidative stress in oral fibroblasts, reducing Collagen I and α-SMA expression. Our findings are consistent with the potential protective role of DHA in fibrosis in multiple organs such as the lungs [46, 47], liver [48], and kidneys [49] and with its trend of inhibiting oxidative stress [50]. In this work, we have revealed for the first time the protective effects of DHA on OSF.
Research has shown that inhibition of HSP70 can reduce collagen production in fibrotic skin diseases [51]. Selenium-enriched probiotics decrease the expression of HSP70 in liver tissues and alleviate inflammation and liver fibrosis in heat-stressed rats [52]. HSP70A1A is one of the most important members that play the role of stress-induced survival [53]. In this study, we found that the expression of HSP70A1A was increased in the oral mucosal tissues of OSF rats, with HSPA1A showing the most significant difference in expression. Interestingly, through molecular docking and cellular experiments, we discovered that DHA inhibits its expression by directly binding to HSP701A. Moreover, it is known that arecoline can induce the expression of TGM-2 in gingival fibroblasts [54], which is involved in OSF progression [55]. DHA enhances the sensitivity of breast cancer cells to tamoxifen by reducing TGM-2 expression [56]. Our study found that TGM-2 expression is increased in the oral mucosal tissues of OSF rats and OSF cell models. DHA administration reduces arecoline-induced TGM-2 expression, consistent with previous research trends.
As a molecular chaperone, HSP70 has been shown to function by interacting with other proteins [57]. Knockdown of TGM-2 improves renal fibrosis by disrupting its interaction with PANX1 [58]. In this study, we found that HSPA1A interacts with TGM-2 proteins in fibroblasts, and overexpression of HSPA1A reverses the inhibition of TGM-2 by DHA, leading to increased expression of Collagen I and α-SMA in fibroblasts. In addition, previous studies have reported the regulatory effect of TGM-2 on ROS [59]. Consistent with this, we found that overexpression of TGM-2 reversed the inhibitory effect of DHA on ROS and GSH. This suggests that the protective effect of DHA in OSF may be achieved by reducing the expression of HSP70 and TGM-2 and disrupting their interaction.
Other researchers have proposed that autophagy levels are significantly increased in OSF tissues and in normal oral cells treated with betel nut alkaloids, which may be related to the pathogenesis of OSF [60]. Li et al. found that inhibiting autophagy can improve the fibrotic phenotype of TGF-β-induced OSF cells [61]. Importantly, previous studies have shown that DHA [62] and HSP70 [63] are involved in regulating cellular autophagy. Our experimental results indicate that protein levels of p62 are significantly reduced, and LC3 expression is significantly increased in OSF rat and OSF cell models. After DHA administration, autophagy levels decrease in OSF rat and OSF cell models. However, overexpression of HSPA1A reverses the inhibitory effects of DHA on fibroblast autophagy.
Additionally, multiple studies have revealed that the inhibition of TGM-2 expression or activity has an inhibitory effect on fibrotic diseases and autophagy. For example, inhibiting TGM-2 activity can improve fibrosis in lung and heart tissues under pulmonary arterial hypertension [64]. The antifibrotic effects of pirfenidone [65] and C-peptide [66] are achieved by reducing TGM-2 expression. Inhibiting TGM-2 can also suppress autophagy [67]. Consistent with the trend of TGM-2 regulation of fibrosis and autophagy reported in these studies, our research found that overexpression of TGM-2 can reverse the inhibitory effect of DHA on arecoline-induced fibrotic phenotypes in fibroblasts, promoting autophagy and oxidative stress. Posteriorly, our study revealed an interaction between TGM-2 and p62 proteins. Treatment with a p62 inhibitor, XRK3F2, reverses the protective effect of DHA on OSF cells and activates autophagy, similar to the effects of overexpressing HSP70A1A or TGM-2 in canceling the protective effect of DHA. These results suggest that DHA improves OSF by inhibiting p62-dependent autophagy through the HSP70A1A/TGM-2 axis.
However, despite confirming the protective effects of DHA on OSF and its potential mechanisms through animal and cell experimental models, further clinical trials are required to verify the therapeutic effects of DHA in the clinical treatment of OSF, which is also a limitation of this study. In terms of DHA dosage safety for rats, we point to a study by Gezer et al. exploring the role of DHA in diabetic rats with keratopathy [68]. The study found daily DHA dosage up to 100mg/kg to be safe. Another study by Sanchez-Trigueros et al. also cooperates with this by indicating a daily dosage of 3 mg/kg of DHA to be safe [69]. These findings imply that a daily DHA intake ranging from 6 to 25 mg is safe for rats. Therefore, it is relatively safe to use 6.25, 12.5, and 25 mg as low, medium, and high doses of DHA in this study to study their effects in OSF rats.
In conclusion, in this study, we have elucidated for the first time the protective effects of DHA on the pathological deterioration of OSF rats and the profibrotic phenotype of OSF cells. Importantly, we have revealed that DHA administration reduces the expression of TGM-2 and HSPA1A, disrupts the interaction between TGM-2 and HSP70A1A, and inhibits p62-dependent autophagy to exert a protective effect, providing new molecular mechanisms for the treatment of OSF.
Conflicts of Interest
The authors declare no conflicts of interest.
Author Contributions
Zhaoyong Hu: data curation, formal analysis, investigation, methodology, validation, visualization, writing–original draft, and writing–review and editing. Yuzhe Dai, Chenwei Wang, and Yanli Liu: data curation, formal analysis, investigation, methodology, and validation. Qun Li and Qiaojuan Zuo: data curation, formal analysis, investigation, and validation. Ruiyi Chen: data curation. Jin Tan: funding acquisition, project administration, resources, supervision, and writing–review and editing.
Funding
This work was supported by funds from the National Natural Science Foundation of China (grant number 82374530) and the 2022 “Disciplinary Reveal System” project of Hunan University of Chinese Medicine (grant number 22JBZ046).
Open Research
Data Availability Statement
All data found and analyzed during this study are included in this paper or available from the corresponding author on reasonable request.


