Detection of Pathogenic Intronic Variants for COL4A5 Gene in X-Linked Alport Syndrome: Developing a Novel Methodology
Abstract
COL4A5 gene variants could result in the X-linked Alport syndrome 1, dominant inheritance (XLAS1) (Online Mendelian Inheritance in Man (OMIM) #301050). The splicing changes can be identified through targeted RNA sequencing (RNA seq), but obtaining accessible patient samples from urine cells and skin fibroblasts is challenging. Moreover, extracted COL4A5 transcripts cannot be amplified due to their nonexpression in peripheral blood mononuclear cells (PBMCs). In the study, we induced patient-derived PBMCs to differentiate into induced pluripotent stem cells (iPSCs) and lymphoblasts (using phytohemagglutinin (PHA)). Through cDNA Sanger sequencing, we identified the true pathogenicity of two cis-intron variants of the COL4A5 gene in lymphoblasts and iPSCs. Furthermore, the results were also verified by minigene assay in vitro. Through RNA seq and real-time PCR, we further confirmed that the expression level of COL4A5 in lymphoblasts is sufficient for Sanger sequencing to detect splicing changes. In conclusion, we have devised a straightforward, cost-effective, noninvasive, and robust method for detecting abnormal transcripts resulting from pathogenic variants in the COL4A5 gene. Furthermore, this method is equally suitable for genes that are expressed in lymphoblasts but not in PBMCs. Finally, splicing changes account for a relatively high proportion of patients with XLAS who were overlooked through routine whole-exome sequencing (WES), and the c.4822-12T>C variant may become a target for specific antisense oligonucleotide therapies.
1. Introduction
In the era of precision medicine, whole-exome sequencing (WES) may prove to be a vital tool for pinpointing the underlying causes of chronic kidney disease (CKD) in children and adults [1]. Six distinct α-chains (ɑ1–ɑ6) of Type IV collagens (COL4s) have been identified, which are encoded by the genes COL4A1–COL4A6 [2]. The collagen heterotrimers, which are interwoven with ɑ3, ɑ4, and ɑ5 chains and are transcribed from the genes COL4A3–COL4A5, make up the glomerular basement membrane (GBM) (Figure 1(a)) [3]. Pathogenic variants in the three COL4 genes are known to cause Alport syndrome, among which variants in the COL4A5 gene can result in X-linked Alport syndrome Type 1, a dominant inheritance disorder (XLAS; Online Mendelian Inheritance in Man (OMIM) #301050) [4]. Alport syndrome is a COL4 disorder characterized by GBM dysfunction, leading to progressive glomerular disease, including kidney failure, sensorineural hearing loss, and ocular abnormalities [3].

Because they have only one X chromosome, men carrying the COL4A5 variant often exhibit a more severe clinical phenotype, including microscopic hematuria from birth, proteinuria in the very early years, followed by a decreased glomerular filtration rate (GFR), and eventually renal failure in late teens [5, 6]. Truncating variants in the COL4A5 gene from large deletions or nonsense variants could cause early-onset kidney failure [5, 6]. Meanwhile, missense variants could result in late-onset kidney failure in the 30s or 40s due to the slow progression [5, 6]. Women, on the other hand, exhibit different degrees of severity partly depending on the X-inactivation rate, and they theoretically exhibit a milder phenotype compared to men [7]. At birth, microscopic hematuria was observed in women, while proteinuria appears very late, with a median age of 7 years [8]. In Japanese and European populations, there was a 10%–15% risk of developing end-stage kidney disease (ESKD) by the age of 40 and a 30%–40% risk by the age of 60 [8, 9].
Based on the Human Gene Mutation Database (HGMD), the splicing changes could be estimated to make up 22.8% of COL4A5, among which the intronic variants contributed a lot. And some literatures have reported that splicing changes in the COL4A5 gene could be detected through RNA sequencing (RNA seq) analysis from urine cells or cultured skin fibroblasts [10, 11]. However, urine cells, particularly those from males and children, are scarce and difficult to collect from the children. Additionally, urine is highly susceptible to contamination, which could result in RNA degradation. Culturing skin fibroblasts, while a viable option, requires extensive time (more than 15 days) and involves complex procedures that demand technical expertise and specific culture conditions. Besides, obtaining skin dermis is an invasive procedure that can be particularly traumatic for individuals prone to scarring. Thus, it is urgent to develop a new method to induce COL4A5 gene expression in easily accessible samples to overcome the aforementioned limitations. peripheral blood mononuclear cells (PBMCs) are the first choice, but COL4A5 is not normally expressed in PBMCs. In this study, we transformed PBMCs into lymphoblasts through phytohemagglutinin (PHA) stimulation, in which COL4A5 expression was observed. Using this method, we have verified the intronic variant, c.4822-12T> C, which resulted in a splicing alteration. This finding was derived from a large family suffering from Alport syndrome, with two cis-intron variants in the COL4A5 gene: c.465+29T>G and c.4822-12T>C.
2. Material and Methods
2.1. Compliance With Ethical Standards
This study was approved by the Medical Ethics Committee of the Children’s Hospital affiliated with Shandong University (Ethics Approval No. SDFE-IRB/P-2023057). Written informed consent was obtained from the subjects or their parents/guardians for the children prior to conducting any clinical and laboratory examinations. All procedures performed in this study were in strict accordance with the ethical standards of the Declaration of Helsinki.
2.2. Sample Collection
Blood samples from the proband and other family members were collected in EDTA vacutainer for DNA or RNA extraction and heparin vacutainer for PBMC extraction. At the same time, we followed the aseptic principle and extracted 3.5 mL of peripheral blood from the proband to the heparin vacutainer for PBMC culture differentiated into lymphoblasts and induced pluripotent stem cells (iPSCs).
2.3. Next-Generation Sequencing (NGS) and Variant Analysis
Blood DNA extraction was performed using a QIAamp DNA Blood Midi Kit (Qiagen, Shanghai, China) and measured using a NanoDrop 2000 ultraviolet spectrophotometer (Thermo Fisher, United States). NGS was carried out on the NovaSeq 6000 platform (Illumina, United States), and GenCap MedE006 Capture Kit (MyGenostics, Beijing, China) was used to screen for variants in the probands. The exomes of 23,000 genes were detected, and the mean exome coverage achieved for the target regions exceeded 95% (> 10 coverage), with an average depth exceeding 100×. GRCh37/hg19 of the human genome were applied for aligning the sequencing data. Copy number variation (CNV) also was analyzed. 1000 Genomes, ESP6500, Exome Aggregation Consortium (ExAC), Genome Aggregation Database (gnomAD), and in-house databases were adopted to exclude the variants (suballelic frequency > 5%). Standardized Human Phenotype Ontology (HPO) was prioritized to analyze the likely pathogenic variants. The software tools, variantTaster, REVEL, Human Splicing Finder Pro, and SpliceAI, were used to evaluate the novel variant pathogenicity. Moreover, the reported variations were analyzed through HGMD and ClinVar database. According to the American College of Medical Genetics and Genomics (ACMG) guidelines [12], the variant pathogenicity was classified. The highly suspicious variations were verified by Sanger sequencing with their segregation analysis. OMIM database, Single Nucleotide Polymorphism Database (dbSNP), Decipher database, and the literature were reviewed to analyze the function of the variants.
2.4. mRNA Extraction, Reverse Transcription, PCR, and Sanger Sequencing
According to the Trizol method protocol, we mixed peripheral blood and Trizol (Invitrogen, United States) at 1:3 ratio or added 500 μL Trizol to 5 × 10⁶ cells. First, cells were lysed by vortexing Trizol reagent. Next, aqueous and organic phases were separated by adding the chloroform, and RNA was retained in the aqueous phase. Then, RNA was precipitated by isopropanol. The concentration for RNA was quantified by the NanoDrop 2000 ultraviolet spectrophotometer (Thermo Fisher Scientific, United States). cDNA was gotten using reverse transcription kit (R212; Vazyme). The cDNA sequence fragments including the variant were amplified, and the PCR primer sequences are listed in Table S1. Finally, the possible cDNA alterations caused by the variants were detected by sanger sequencing (ABI Prism 3700).
2.5. Cell Culture and Plasmid Transfection
In the study, the tool cell, HEK293T cell, was used, which is cultured in Dulbecco’s modified Eagle medium (DMEM) supplemented with 10% fetal bovine serum (FBS). The medium is replaced every other day, and when the cells reach 90% confluence, they were passaged at 1:3 ratio. For cell transfection, when the cells reach 60% confluence, plasmid liposome transfection is performed using the transfection reagent (Lipofectamine 3000, Invitrogen). After 12 h of transfection, fresh medium is replaced to prevent liposome-induced cellular toxicity. The transfected cells are harvested after 48 h for subsequent experiments.
2.6. Lymphoblasts Obtained From PBMCs and Identified
PBMCs were isolated from 0.5 mL peripheral blood using Ficoll (1.077 g/mL) (G&E Healthcare) and cultured in a 6-well plate, each well with 1 × 10⁶ PBMCs in Roswell Park Memorial Institute (RPMI) 1640 medium including PHA (final concentration: 200 μg/mL) and 10% FBS for 3 days at 37°C, 5% CO2, in which the lymphocytes are transformed into lymphoblasts. Then, the lymphoblasts were harvested for subsequent experiments. Simultaneously, a culture without PHA was used as the negative control to compare the proportion of lymphoblasts induced by PHA. The cells were fixed with 4% paraformaldehyde and then stained with Giemsa. The number of transformed cells among 200 lymphocytes was counted under an oil immersion lens, and the transformation rate was calculated. Identification of mature small lymphocytes and lymphoblasts is based on cytomorphological criteria and cell size. Lymphocytes are 6–8 μm in size, with densely stained nuclei, absent nucleoli, a high nucleus-to-cytoplasm ratio, and a lightly basophilic cytoplasm. Lymphoblasts, on the other hand, are larger cells, ranging from 20 to 30 μm, characterized by irregular shapes often with small protrusions, enlarged nuclei with loosely stained chromatin and one to two nucleoli, and a broader cytoplasm frequently containing vacuoles. The transformation rate of lymphoblasts is well within the range of 60%–80%.
2.7. The PBMC iPSCs Obtained From PBMCs
PBMCs were isolated from 4 mL of peripheral blood using Ficoll (1.077 g/mL) (G&E Healthcare) and cultured in a 6-well plate with erythroid medium (PeproTech) for 7 days at 37°C and 5% CO2. PBMCs 2 × 10⁶ were collected and electroporated with nonintegrating vectors harboring pluripotent factors (0.5 μg pEV-SFFV-BCL-XL-Wpre, 1 μg pEV-SFFV-KLF4-Wpre, 1 μg pEV-SFFV-Myc-Wpre, and 2 μg pEV-SFFV-OCT4-E2A-SOX2-Wpre) (Novo Biotechnology, Beijing, China) using Amaxa P3 Primary Cell Nucleofector Kit (V4xp-3024, Lonza) in 4D Nucleofector System (program EO-100). Then, cells were resuspended and plated onto a 12-well plate precoated with murine embryonic fibroblasts (MEFs), which had been treated with mitomycin (Stem Cell Technologies). During the first 7 days, the medium was supplemented with ReproTeSR (Stem Cell Technologies) every 2 days and then was full changed. After about 15 days, iPSC colonies were manually picked into the 12-well plate precoated with Matrigel (62.5 μg/mL, BD Biosciences) and further expanded in mTeSR1 medium (Stem Cell Technologies). iPSC colonies require daily replacement of the culture medium, cultivation at 37°C, and 5% CO2 conditions and passage every 5 days [13, 14].
2.8. The Skin Fibroblast Acquisition
The skin tissue is placed into physiological saline containing penicillin and streptomycin and gently shaken for 2 mins. Then, the tissue is transferred to a 6-cm culture dish and trimmed off the subcutaneous tissue. To cut the tissue block into smaller pieces and immerse them in 0.25% trypsin containing EDTA at 4°C for 16–18 h. After that, wash the tissue three times with phosphate-buffered saline (PBS), and peel off the gray–yellow epidermal layer, leaving the white dermal layer. Then, the cut tissue into pieces approximately 1 × 1 mm in size, and transfer these pieces to a 6-cm culture dish precoated with FBS, spacing each piece about 5 mm apart cultivated at 37°C and 5% CO2 conditions for 4 h. Whereupon, little FBS is added around the tissue pieces to moisten them, and 2 mL DMEM including 10% FBS is also replenished around the edge of the culture dish. After 24 h, enough complete DMEM is added to fully submerge the tissue. Subsequently, the tissue pieces are observed daily under a microscope for the emergence of fibroblasts around them, and the medium is changed every 3 days.
2.9. The Urine Cell Acquisition
A total of 200-milliliter morning urine is collected and centrifuged at 4°C, 400 g for 5 min. Then, discard the supernatant, wash twice with PBS, and store the urine sediment with Trizol at −80°C for subsequent experiments.
2.10. Minigene Assay
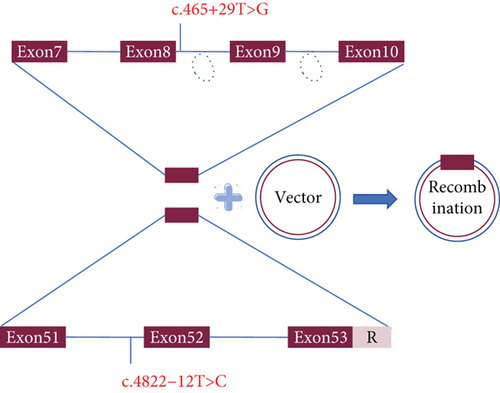
To confirm the possible splicing effects resulting from the variants, in vitro minigene splicing assay was conducted. The minigene regions of COL4A5 spanning Exon 7, Intron 7, Exon 8, parts of Intron 8, Exon 9, parts of Intron 9, and Exon 10 for the c.465+29T>G variant and spanning Exon 51, Intron 52, and Exon 53 for the c.4822-12T>C variant were amplified from the gDNA of the patient and control using the forward primer with the restriction endonuclease site BamHI and the reverse primer with the restriction site XhoI. pMini-CopGFP vector was used to clone the amplified products by recombinant cloning kit (Vazyme, Nanjing, China). Then, the cloned colonies were amplified and verified through sanger sequencing, and both wild-type and mutant plasmids were obtained (Magen, Guangzhou, China). HEK293T cells are used as tool cells for transfection and overexpression. After 48-h cell transfection and culture, we extracted the total RNA using Trizol method, and reverse transcription polymerase chain reaction (RT-PCR) was executed using the aforementioned primers.
2.11. RNA seq
Total RNA was extracted according to the standard process (Novogene), and the quality control method mainly relies on Agilent 2100 bioanalyzer to accurately detect RNA integrity. mRNA was enriched by Oligo (dT) magnetic beads, and then, the obtained mRNA was randomly fragmented by divalent cations in fragmentation buffer. Using fragmented mRNA as templates and random oligonucleotides as primers, the first cDNA strand was synthesized in the Moloney murine leukemia virus (M-MuLV) reverse transcriptase system; then, the RNA strand was degraded with RNaseH, and the second cDNA strand was synthesized using deoxynucleoside triphosphates (dNTPs) as raw materials in the DNA polymerase I system. cDNA of about 370–420 bp was selected using AMPure XP beads, followed by PCR amplification. The produces were sequenced by Illumina. The sequencing throughput was 6G for lymphoblasts, iPSC, fibroblasts, and urine cells. Peripheral blood contains high hemoglobin mRNA, and the sequencing throughput was 10G.
After bioinformatics processing, the off-machine data is converted into Fastq format. Through various software and databases, we analyze and compare gene expression levels, differential gene expression, differential gene enrichment, gene set enrichment, differential gene protein network interactions, alternative splicing and SNPs, etc.
2.12. Quantitative Real-Time PCR
Total RNA was obtained by Trizol method. The first-strand cDNA was synthesized from 1 μg total RNA using the First Strand cDNA Synthesis Kit (Vazyme). Quantitative PCR was carried out using ChamQ SYBR Color qPCR Master Mix (Vazyme) according to the standard procedure. The primer sequences utilized could be found in Table S1, with ACTIN or GAPDH as the endogenous control.
3. Results
3.1. Patients
The proband, a 5-year-10-month-old boy, was admitted to the hospital due to a 1-month history of enuresis. Upon urine routine examination, erythrocytes were 88 p/μL (Ref: 0–5 p/μL), 3+ in urine occult blood (Ref: NEG), and 1+ in urine protein (Ref: NEG). However, other symptoms such as frequent urination, urgency, or pain during urination were absent, and the color and appearance of the urine were normal. The proband had no eyelid edema, abdominal pain, or diarrhea. Following treatment, the patient’s enuresis was resolved; however, subsequent urine routine tests persistently showed abnormalities, including red blood cells and proteinuria, for six consecutive tests over a period of 2 months.
By inquiring about the family history, we found that the patient’s grandpa and great-aunt died of uremia; thus, we highly suspected that the child suffered from hereditary nephropathy. Although gene sequencing revealed two intronic variants in the COL4A5 gene, their pathogenicity was uncertain. We then tested the urine of other family members and found erythrocytes and proteinuria in the mother, younger brother, and aunt as well. Additionally, the patient’s mother claimed that the hearing and vision of the grandpa and great-aunt remained normal even at the end stage of renal failure. Furthermore, after 2.5 years of follow-up, the male patients showed more significant changes in kidney function with increasing age. The laboratory test results are shown in Table 1.
| The proband | Mother | Aunt | Uncle | Brother | Sister | Female cousin | Cousin | ||
|---|---|---|---|---|---|---|---|---|---|
| Urine | Leukocyte (LEU) (0–23) | 16.1/19.2a | 31/25.1a | 3.6/7.9a | 0.7/1a | 8.6/4.7a | 23.2/17a | 9.1/7a | 2.2/3.1a |
| Erythrocyte (RBC) (≤ 18) | 374.9/300a | 369.8/279.3a | 461.5/278a | 4.7/3.2a | 347.5/273a | 7.4a | 1/1a | 1/1a | |
| Occult blood (BLD) (NEG) | +++/+++a | +++/+++a | +++/+++a | +/−a | +++/+++a | −/−a | −/−a | −/−a | |
| Proteinuria (PRO) (NEG) | +/+a | −/−a | −/−a | −/−a | +/+−a | −/−a | −/−a | −/−a | |
| Ketone body (KET) (NEG) | ++/++a | −/−a | −/−a | −/−a | ++/−a | −/−a | −/−a | −/−a | |
| Serum | Creatinine (Cr) | 32 | 55 | 48 | ND | 39 | ND | ND | ND |
| Urea (2.7–7.1) | 3.66 | 4.71 | 4.08 | ND | 4.31 | ND | ND | ND | |
| Total protein (TP) (60–80) | 66.2 | 64.9 | 43.5 | ND | 67.3 | ND | ND | ND | |
| Cholesterol (TC) (0–5.17) | 3.86 | 2.84 | 3.23 | ND | 3.47 | ND | ND | ND | |
| HDL-C (0.8–1.5) | 1.09 | 1.27 | 1.56 | ND | 1.12 | ND | ND | ND | |
| LDL-C (0–3.36) | 2.88 | 1.42 | 1.53 | ND | 2.73 | ND | ND | ND | |
| Triglyceride (0–1.69) | 0.61 | 0.41 | 0.37 | ND | 0.76 | ND | ND | ND | |
- aThe test results at the first diagnosis 2.5 years ago.
3.2. Genetic Analysis
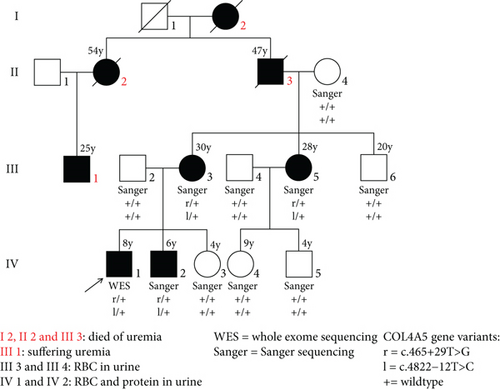
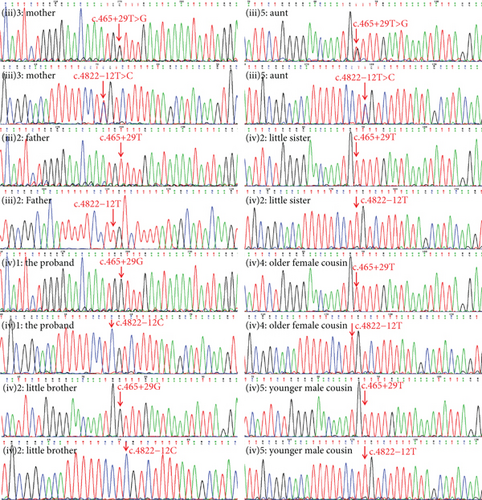
According to clinical phenotypes and family history, WES was conducted on the proband. The result showed two cis-intron variations found in the COL4A5 gene (NM_033380) on the X chromosome, c.465+29T>G and c.4822-12T>C. The variants in the COL4A5 gene could cause X-linked Alport syndrome, which is an X-linked dominant inheritance (XLD) disorder affecting the kidney, eye, and ear. The two intronic variations were absent from the in-house database, ExAC, ESC6500, and 1000 Genomes Project. Since the COL4A5 gene is located on the X chromosome, the two intronic variations, being cis-variations, were located on the same chromosome. Sanger sequencing (Figure 2) revealed that the two cis-variations originated from the mother. Other patients who had erythrocytes in their urine, including the mother, aunt, and little brother, all carried the two cis-variations.
3.3. Bioinformatics Analysis
The two intronic variants were both novel and unreported, and their pathogenicity had not been further studied. Therefore, we predicted the pathogenicity of the variants using bioinformatics methods. First, neither intronic variant generates new exon cleavage sites, such as “GU-AG” or “AU-AC.” Moreover, the online RNA Splicer tool was used to assess the potential effects on the splicing of the two variants. The delta scores for the c.465+29T>G and c.4822-12T>C variants, as predicted by the deep learning algorithm SpliceAI, were both zero. Additionally, no potential abnormal splice patterns were found using the RNA splicer tool Rare Diseases Data Center (RDDC) (Figures S1A and S1B). Otherwise, the tool Human Splicing Finding Pro showed that the c.465+29T>G variant could result in the creation of a new donor splice site (score mutation: 78.04; delta: 53.32%) while the c.4822-12T>C variant has no significant impact on splicing signals (Figures S1C and S1D).
3.4. Splicing Study by RT-PCR Sanger Sequencing From Proband Blood or PBMC-Induced Lymphoblasts and iPSC Cells
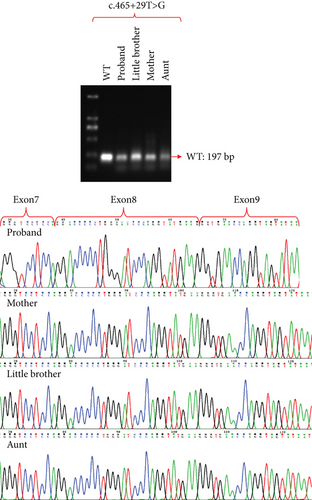
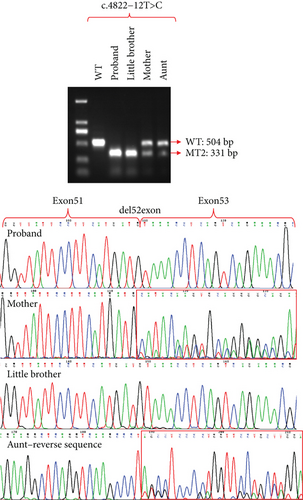
The attempt to extract RNA from urine samples proved unsuccessful and did not meet the experimental requirements. Consequently, we collected peripheral blood samples, extracted RNA from them, and also obtained PBMC-induced lymphoblasts (Figure S2) and iPSCs (Figure S3). After reverse transcription into cDNA, we performed exon amplification and sequencing to analyze variants. Due to the minimal expression of COL4A5 in peripheral blood, we were unable to detect its amplification at the cDNA level, which is consistent with the University of California Santa Cruz (UCSC) database. However, COL4A5 was expressed in both PBMC-induced lymphoblasts and iPSCs, and we successfully amplified it. Sanger sequence showed that the intronic variant, c.465+29T>G, did not cause exon splicing changes, whereas the intronic variant c.4822-12T>C induced the deletion of Exon 52 in the COL4A5 cDNA (Figures 3 and 4). Since males have only one X chromosome, we could clearly identify that the c.4822-12T>C variant causes Exon 52 skipping. These results were verified in both PBMC-induced lymphoblasts (Figure 3) and iPSCs (Figure 4). Furthermore, agarose gel electrophoresis of RT-PCR products was used to confirm the band specificity. The amplified band from the c.465+29T>G variant showed a single band (197 bp), while the band from the c.4822-12T>C variant showed two bands: the wild type (504 bp) and the mutant type (331 bp) with the deletion of Exon 52 (Figures 3 and 4).

3.5. Splicing Study of Two Intronic Variants by Minigene Assay
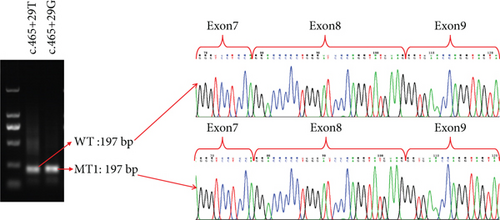
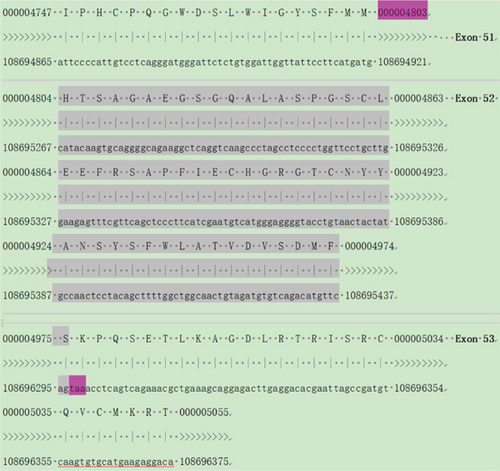
To further confirmed the pathogenicity of the c.465+29T>G and c.4822-12T>C variants, we adopted the minigene assay for the intronic variations, including the wild types and mutant types, to confirm whether they had the abnormal splicing sequences. RT-PCR products were detected by agarose gel electrophoresis, and two same-length bands were detected for the intronic c.465+29T>G variant plasmid (197 bp) and the intronic c.465+29T wild-type plasmid (197 bp) (Figure 5(a)). Otherwise, two different bands for the intronic c.4822-12T>C variant plasmid (331 bp) and the intronic c.4822-12T wild-type plasmid (504 bp) were observed, resulting in the truncated protein p.M1601fsTer1 (Figures 5(b), 5(c), and 5(d)). For the intronic c.465+29T>G variant plasmid, only normal splicing sequencing was observed in the variant (Figure 5(a)). These results were dissimilar from the predicted outcome by the SpliceAI and online RNA Splicer tool (Figures S1A–S1D). The truncated protein p.M1601fsTer1 only lost 84 amino acids at the C-terminus of the protein, which may have little effect on its function. Hence, the patients had a later onset age and milder symptoms with minimal influence on hearing and vision.

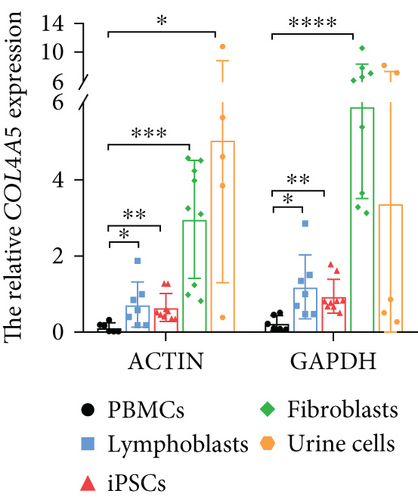
3.6. RNA seq and Real-Time PCR Detection of COL4A5 Gene Expression in PBMCs, Lymphoblasts, iPSCs, Fibroblasts, and Urine Cells
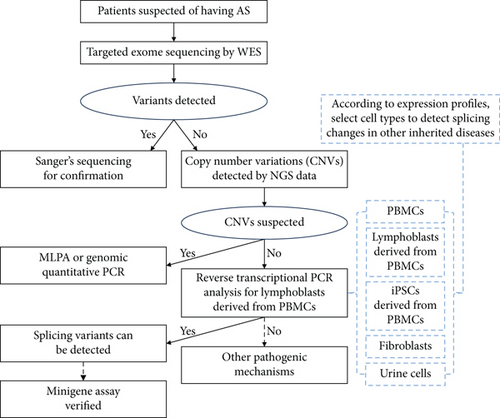
To detect the COL4A5 gene expression, we have collected 47 samples including PBMCs (13 samples), lymphoblasts (12 samples), iPSCs (8 samples), fibroblasts (9 samples), and urine cells (5 samples). Through RNA seq, we found that COL4A5 had almost no expression in the PBMCs (less than 0.01 fragments per kilobase million (fpkm)) and very little expression in lymphoblasts (less than 0.1 fpkm) which is enough to detect the mRNA variation by Sanger sequencing. Meanwhile, the expression of COL4A5 in iPSCs, fibroblasts, and urine cells is relatively high (more than 1 fpkm) (Table 2). The results from real-time PCR also verified the above conclusion (Figure 6(a)). To address COL4A5 nonexpression in PBMCs and find a method to promote COL4A5 expression in them, we hypothesized that lymphoblasts, which share stem cell characteristics with iPSCs, might also promote COL4A5 expression. Therefore, we induced lymphoblasts using PHA, and the results confirmed the feasibility of this approach. Finally, to effectively identify pathogenic variants including splicing variants, we conducted a stepwise genetic analysis for patients suspected of XLAS, and the expression profiles of the five cell types could also be applied for detecting splicing changes in other inherited diseases, as shown in Figure 6(b).
| PBMCs | Lymphoblasts derived from PBMCs | IPSCs derived from PBMCs | Fibroblasts | Urine cells | |
|---|---|---|---|---|---|
| fpkm | < 0.01 | 0.01–0.1 | 1–5 | 1–10 | 10–25 |
4. Discussion
Since COL4A5 is not expressed in PBMCs, fortunately, we had obtained the patient’s iPSCs, which were induced from PBMCs. And we detected the mRNA status of iPSCs and confirmed that c.4822-12T>C was pathogenic, while c.465+29T>G was a benign variant. However, the preparation of iPSCs derived from PBMCs is time-consuming, is costly, and has a low success rate, making it unsuitable for clinical diagnosis [15]. We are exploring how to induce the expression of COL4A5 in PBMCs, which are easily accessible in clinical settings, to facilitate the verification of the pathogenicity of gene variants. The mitogen PHA can stimulate human peripheral lymphocytes to become lymphoblasts, a process that is widely used in cell culture for chromosome preparation experiments involving human PBMCs [16]. Therefore, we transformed PBMCs into lymphoblasts using PHA to detect COL4A5 gene expression. Interestingly, although the expression level of COL4A5 in lymphoblasts is low, its cDNA could still be amplified by reverse transcription PCR and is sufficient for subsequent amplification and direct sequencing. Compared to urine cells and cultured skin fibroblasts for detecting COL4A5 expression [10, 11], lymphoblasts derived from PBMCs are more easily obtained with patient or guardian consent and with the advantages of being cost-effective, noninvasive, highly operational, and relatively quick to process, which is highly suitable for clinical testing. The advantages and disadvantages of these five cell types for detecting mRNA expression are summarized in Table 3. Although the mRNA expression profiles of these cell types are different, they can complement and validate each other in detecting splicing changes. Otherwise, the truncated mRNA was confronted with the nonsense-mediated mRNA Decay (NMD). Boisson et al. [11] found that emetine, an NMD inhibitor, could inhibit the NMD and improve the detection rate of COL4A5 alternative splicing in cultured fibroblasts. This effect should also be observed in cultured lymphoblasts.
| Tissue source | RNA degradation | Acquisition difficultya | Acquisition time | Expense (¥) | |
|---|---|---|---|---|---|
| PBMCs | Blood | No | - | Immediately | - |
| Lymphoblasts | Blood | No | + | 3 days | 60 |
| IPSCs | Blood | No | ++++ | ~2 months | 2–3∗104 |
| Fibroblasts | Skin | No | +++ | ~20 days | 2000 |
| Urine cells | Urine | Yes | +++ | Immediately | - |
- Note: ¥: renminbi (RMB).
- aFive levels from easy to difficult: “-” and “+ to ++++.”
Clinical characteristics of two female and two male patients were collected in detail within the family. The two male patients had already developed proteinuria and relatively high erythrocyte counts during childhood when the disease was diagnosed, and these indicators worsened as they aged (over 2 years). However, the female patients were adults at the time of diagnosis, and only erythrocytes were detected in their urine. Compared with patients reported in the literatures [7, 11], our patients exhibited later onset and milder severity, possibly related to the variation located at the C-terminus of the protein, resulting in less functional loss. Alternatively, the milder onset in females may be associated with X chromosome inactivation, where a partially normal X chromosome still functions, thereby partially rescuing the function of the renal basement membrane [17].
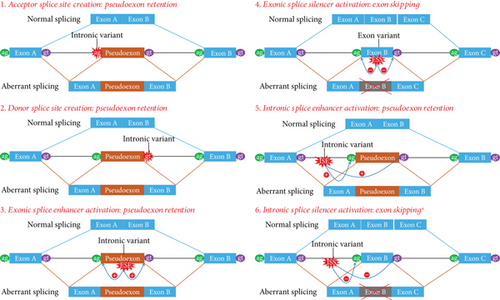
It is estimated that noncoding variants affecting gene expression, regulation, or splicing contribute to approximately 15%–30% of human Mendelian diseases [11, 15, 16]. More than 20% of XLAS patients carry intronic variants, and most of these, including those near exon–intron boundaries and deep-intronic variants, create new splicing sites that are pathogenic [18]. The pathogenic mechanisms of these variants involve splicing changes such as acceptor splice site creation (pseudoexon retention), donor splice site creation (pseudoexon retention), exonic splice enhancer activation (pseudoexon retention), exonic splice silencer activation (exon skipping), intronic splice enhancer activation (pseudoexon retention), and intronic splice silencer activation (exon skipping) (Figure 1(b)) [11, 19–22]. Our variant, c.4822-12T>C, activates an intronic splice silencer, resulting in Exon 52 skipping. This finding underscores the importance of alternative splicing caused by intronic variants in Mendelian diseases.
The specific antisense oligonucleotide (ASO) therapies targeting intronic variants that affect splicing offer hope for patients and their families [23]. ASO therapy was first reported in 1995 for Duchenne muscular dystrophy (DMD) through exon skipping [24, 25]. Currently, four ASO therapies have been approved by the Food and Drug Administration (FDA): eteplirsen for DMD, nusinersen for spinal muscular atrophy, mipomersen for hypercholesterolemia, and inotersen for amyloidosis [24, 26–28]. Reports indicate that eteplirsen exhibits weaker activity than expected, possibly due to a significant portion of the drug being rapidly filtered by the glomerulus into the urine, resulting in limited reach to skeletal muscle [24]. Consequently, the development of ASO therapies for kidney diseases appears highly promising and straightforward. Yamamura et al. [23] have demonstrated promising efficacy of ASO therapy for XLAS in a mouse model.
4.1. Lessons
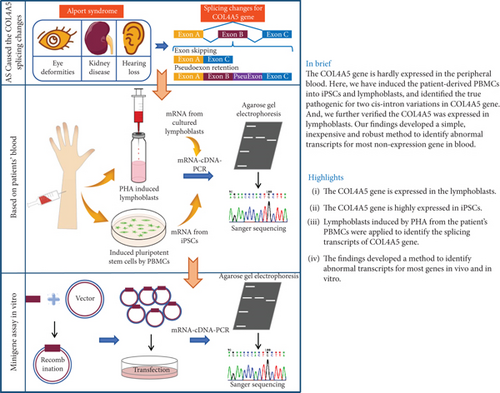
In this study, we employed a novel method to confirm the pathogenicity of c.4822-12T>C, which activates an intronic splice silencer, resulting in Exon 52 skipping. Our findings introduced a straightforward, cost-effective, and reliable approach to detect aberrant transcripts for the majority of nonexpressed genes in blood. Nevertheless, certain genes remain unexpressed in both peripheral blood and lymphoblasts. To address this, three other distinct cell types were utilized, which complemented each other. Otherwise, the schematic diagram of this is presented in Figure 7.
Ethics Statement
The study was approved by the Medical Ethics Committee of the Children’s Hospital of Shandong University (Ethics Approval No. SDFE-IRB/P-2023057). Written informed consent was obtained from the parents of the patients for clinical and laboratory examinations. All the procedures in the study strictly followed the Declaration of Helsinki. The information about the patients was anonymized prior to submission.
Conflicts of Interest
The authors declare no conflicts of interest.
Author Contributions
K.Z. designed and wrote the paper. K.Z., Y.L., Q.G., and W.Z. collected the clinical data. Y.L., R.T., Y.H., Y.Y., and H.X. do the experiment. D.W., H.Z., and Y.Lv. collected gene data. Y.L. analyzed RNA seq data. B.N. and K.L. collected the skin tissues. All authors consent to the publication of this study.
Funding
This work was financially supported by the Key Project of Medical and Health Science and Technology in Shandong Province (202401030123), the Jinan Science and Technology Bureau Project (202328017 and 202430054), the Natural Science Joint Foundation of Shandong Province (ZR202108140004), the Shandong Province Traditional Chinese Medicine Technology Project (Z-2022004 and M-2022007), and Jinan Science and Technology Innovation Development Project (202019071, 202019072).
Acknowledgments
We are grateful for the support, cooperation, and trust of the patient and their family. We also thank for the support by the project of “Shandong Provincial Clinical Research Center for Children’s Health and Disease,” “Jinan Clinical Medical Research Center for Children’s Genetic Metabolic Diseases,” and “Jinan High level Talent Project” to ensure the successful completion of the study. The authors are grateful to the patients and their parents for their contribution to the study.
Supporting Information
Additional supporting information can be found online in the Supporting Information section.
Open Research
Data Availability Statement
The data presented in the study are deposited in the NODE Bioproject repository, accession number OEP005557. The direct link is https://www.biosino.org/upload/submission/detail/OEP005557.


