Preservation Potential of Fenugreek Seed and Leaf Extracts in Mayonnaise: Impact on Antioxidant Activity, Peroxide Value, and Sensory Quality
Abstract
Fenugreek extracts have remarkable antioxidant properties and can be used as natural preservatives for products containing a large amount of oil, such as mayonnaise. In this study, mayonnaise was enriched with phenolic extracts of fenugreek seeds (FSE) and fenugreek leaves (FLE), and the quality attributes of the enriched mayonnaises were investigated during storage. FSE and FLE were added to mayonnaise at three different levels (0.05, 0.10, and 0.20%), and the samples were stored at 4°C for 12 weeks and at 25°C for 6 weeks. Antioxidant activity, peroxide value, titratable acidity, color change, and microbial and sensory analysis were performed. As a result, enrichment of mayonnaise with FSE and FLE improved its quality properties during storage. The antioxidant activities of the added FSE and FLE samples were preserved ∼87% and ∼47% at 4°C, and 81% and ∼27% at 25°C, respectively. Furthermore, the increase in the peroxide values of the enriched mayonnaise with extracts during storage was less than that of the added synthetic antioxidant (EDTA) samples. The highest total color change (ΔE) was observed for FLE-added samples for all levels of addition. Multifactorial ANOVA showed significant effects (p < 0.05) of type and concentration of additives, storage time, and their interactions on antioxidant activity, peroxide value, titratable acidity, and color change at both storage temperatures (4°C and 25°C). R2 and adj-R2 values indicated highly accurate models for all parameters. The addition of FLE and FSE at the highest level (0.20%) prevented the growth of total aerobic mesophilic bacteria by 2.1 and 3.2 logs and the growth of total yeast/mold by 1.0 and 1.3 logs at 25°C, respectively. Sensory attributes (color, odor, taste, texture, and general acceptance) of the mayonnaises added to FSE and FLE had higher scores than the control sample at the end of storage.
1. Introduction
Mayonnaise is a low pH oil-in-water emulsion that has 65–85% fat and is considered a sauce with rich flavor and thick texture [1, 2]. Mayonnaise is generally formulated with mixing vegetable oil, water, egg yolk, vinegar, sugar, and some spices such as mustard, black pepper, and garlic. In this recipe, oil is the dispersed phase, vinegar and water are the continuous phases, and egg yolk is the emulsifier [3]. Even though mayonnaise is a highly consumed food product, storage conditions can negatively affect its physical, microbial, and sensory attributes due to large amounts of bound unsaturated fatty acids [4]. One of the major problems that producers face is the autooxidation of unsaturated fatty acids, and the quality of mayonnaise is generally related to oxidative stability during storage [5]. To overcome the oxidation and rancidity, synthetic antioxidants such as butylated hydroxyanisole (BHA), butylated hydroxytoluene (BHT), and ethylenediaminetetraacetic acid (EDTA) are preferred in the food industry [3, 5]. On the other hand, the possible toxic effects of these synthetic antioxidants and the huge demand of consumers for the replacement of chemical ingredients with natural ones have attracted attention to the natural antioxidants obtained from the edible plants [6, 7]. The use of natural antioxidants derived from fruits, essential oils, and polysaccharides has gained considerable attention. Previous studies have highlighted the antioxidant properties of various fruit extracts, such as grape seed, which demonstrated the effectiveness in inhibiting lipid oxidation and extending the shelf life of food products. Essential oils have also been recognized for their antioxidant activity, as demonstrated by Noruzi et al. [8], where tarragon essential oil exhibited significant antioxidant capacity. Furthermore, polysaccharides obtained from Vaccinium arctostaphylos L. [9] and mucilage of Sepestan fruit [10] have shown promising antioxidant effects, suggesting their potential application as natural antioxidants in food systems.
Due to the trend for clean labeling among consumers, some natural antioxidant sources have been used in the production of mayonnaise production such as gallic acid [11], lycopene [12], mustard [13], anthocyanins [14], grape seed extract [15], and fenugreek extract [16]. Fenugreek (Trigonella foenum-graecum L.) is a plant used for culinary and medicinal uses [17]. Fenugreek seeds and fenugreek leaves are the main parts consumed in the diet, and fenugreek leaves have been used as medicines to treat some chronic diseases such as diabetes and high blood pressure [18, 19]. Even though having a bitter taste of fenugreek seed extracts, it can be possible to evaluate them in some food formulations. Research has shown that extracts derived from both fenugreek seeds and leaves contain phenolic compounds with high antioxidant activities [19–22]. These attributes of fenugreek extracts enable their utilization in model foods at exceptionally low concentrations.
Although there are many studies to improve storage stability and sensory attributes of mayonnaise during storage with natural antioxidant sources, a few studies have been found in the literature for the use of plants and/or plant extracts in mayonnaise formulations. Kishk and Elsheshetawy [23] revealed the effect of the ginger powder on the oxidative stability of mayonnaise. They reported that 1.25% of the usage of ginger powder in the mayonnaise formulation slowed autooxidation for 20 weeks of storage at 4°C. Altunkaya et al. [15] used grape seed extract in mayonnaise to improve oxidative stability and sensory characteristics at 8 weeks of storage. However, the results showed that the use of 0.15% grape seed extract in the mayonnaise formulation prevented the high peroxide values but with lower sensory acceptance. Baranauskienė et al. [24] produced mayonnaise enriched with tansy extracts that have a high antioxidant capacity, and the researchers revealed that the oxidative stability of the mayonnaise was increased. Martillanes et al. [7] used rice bran extract in a mayonnaise-type emulsion to evaluate its antioxidant and antimicrobial properties. The ethanolic rice bran extract (2%) reduced mold and yeast growth and the autooxidation process after 1 week of storage at 4 and 20°C. Alizadeh et al. [1] examined the reducing effects of Ferulago angulata extract on the oxidative stability of mayonnaise. Although there are some studies on the enrichment of mayonnaise content in the literature, there is no comprehensive study on the evaluation of the physical, chemical, microbial, and sensory quality of mayonnaise with added phenolic extract.
In this study, the addition of both phenolic fenugreek seed extract (FSE) and leaf extract (FLE) was investigated in the mayonnaise formulation considering the overall quality of the product. For this purpose, antioxidant activity, pH, titratable acidity, peroxide values, color change, microbial, and sensory attributes of mayonnaise enriched with FSE and FLE were compared with control samples without extracts (negative control) and with a synthetic antioxidant (positive control) during storage at 4°C for 12 weeks and 25°C for 6 weeks.
2. Materials and Methods
2.1. Materials
Phenolic extracts of fenugreek seeds (FSE) and fenugreek leaves (FLE) were obtained from previous studies of Dastan et al. [19] and Isleroglu and Turker [22], respectively. Both extracts were freeze-dried using a laboratory-scale freeze dryer (CHRIST, Alpha 1–4 LSC, Germany) until the dry matter was reduced to 10% (wet base). Concentrated extracts were used directly in mayonnaise formulations. The ingredients (sunflower oil, eggs, grape vinegar, lemon juice, sugar, and salt) used in the production of mayonnaise were purchased from a local market.
2.2. Chemicals
Potassium persulfate (K2S2O8), sodium acetate (CH3COONa), potassium iodide, chloroform, potato count agar, and potato dextrose agar were purchased from Merck Chemicals (Darmstadt, Germany). 96% ethanol was purchased from Tekkim Chemicals (Istanbul, Turkey). EDTA was obtained from Carlo Erba Reagents (Val de Reuil, France). Sodium hydroxide (NaOH), 2,2′-azino-bis(3-ethylbenzothiazoline-6-sulfonic acid) diammonium salt (ABTS), and Trolox were purchased from Sigma-Aldrich Co. (Steinheim, Germany). All chemicals used were of better analytical quality/grade.
2.3. Mayonnaise Production and Storage
The plain mayonnaise recipe for a 100 g sample is as follows: 76.09 g of sunflower oil, 11.96 g of egg yolk, 3.26 g of grape vinegar, 3.26 g of lemon juice, 2.17 g of sugar, 1.63 g of salt, and 1.63 g of drinkable water. First, all ingredients except vegetable oil were mixed for 30 seconds using a laboratory-scale homogenizer (IKA-Works, Ultra Turrax T-18 Basic, Germany). Subsequently, vegetable oil was dropped into the mixture with a burette at a rate of 5 ml/min and continuously mixed with the homogenizer at 15600 rpm to form an emulsion. FSE and FLE were added to mayonnaise at three different levels such as 0.05, 0.10, and 0.20% (w/w), determined with preliminary tests. An EDTA solution (10%, w/v) was also added to the plain mayonnaise at a level of 0.20% for comparison. FSE-added samples coded as FSE5, FSE10, and FSE20, and FLE-added samples coded as FLE5, FLE10, and FLE20 for 0.05, 0.10, and 0.20% of the extract addition levels, respectively. The mayonnaise samples were then stored in sealed 50 ml tubes and stored at 4°C for 12 weeks and at 25°C for 6 weeks. The samples were tested once a week for 25°C and once every two weeks for 4°C.
2.4. Analysis Methods
2.4.1. Antioxidant Activity
The antioxidant activity analysis of the mayonnaise samples was carried out according to the method of Re et al. [25] with some modifications. First, an ABTS-K2S2O8 solution was prepared for the analysis of ABTS-reducing antioxidant activity. For this purpose, 7 mM of ABTS stock solution and 2.45 mM of K2S2O8 solution were mixed on an equal basis and incubated at room temperature in the dark for 16 h. After incubation, 1 ml of this solution was diluted with 54 ml of buffer solution (20 mM sodium acetate, pH 4.5) to obtain an absorbance value of 0.700 at a wavelength of 734 nm. 150 µL of sample and 2850 µL of adjusted ABTS solution were mixed and vortexed for 5 min. The mixture was incubated for 25 min at room temperature in the dark and then centrifuged at 3120 x g for 3 min. The antioxidant activity (ABTS) of the samples was presented as µmole Trolox/100 g dry sample. The antioxidant activity of FLE and FSE was determined as 54.43 ± 1.01 and 89.57 ± 2.16 mmole Trolox/100 g dry sample, respectively.
2.4.2. Peroxide Value
Before measuring the peroxide value of the mayonnaise samples, all samples were frozen at −80°C for 24 h. The frozen samples were then thawed at 4°C for 2 hours to break the emulsion. After breaking the emulsions, the samples were centrifuged at 850 x g (3000 rpm on a 1620 A rotor, Universal 320 R centrifuge, Andreas Hettich GmbH and Co. KG, Tuttlingen, Germany) for 15 minutes. The separated oil phase was used for the determination of the peroxide value [2]. Peroxide value of the mayonnaise samples was determined according to AOCS Cd 8 b-90 [26]. Chloroform/ethanol mixture (1 : 1) was used to dissolve the extracted oil phases of the different samples, and these mixtures were mixed with saturated potassium iodide. The final solution was titrated with 0.001 N sodium thiosulfate, and the peroxide value of the samples was measured as meq O2/kg oil.
2.4.3. pH and Titratable Acidity
2.4.4. Color Measurement
Here, , subscript “0” indicates the reference value of the sample on day zero, and the subscript “t” indicates the measured values at specific storage time intervals.
2.4.5. Total Aerobic Mesophilic Bacteria and Total Yeast/Molds
The total aerobic mesophilic bacteria count of the samples was determined using the spread plate technique with plate count agar (PCA) at 30°C for three days. Total yeast/molds were determined using the spread plate technique on potato dextrose agar (PDA) at 25°C for five days. PDA was aseptically acidified with 10% tartaric acid. Serial 1 : 10 to 1 : 1000 dilutions of mayonnaise samples were prepared. The colony counts were expressed as colony forming units (CFU) using a logarithmic scale in one gram of mayonnaise (log CFU/g mayonnaise) [28].
2.4.6. Sensory Analysis
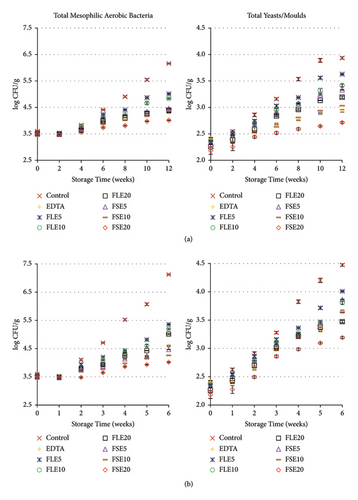
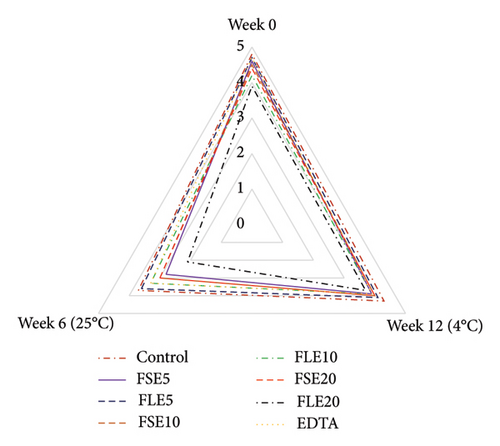
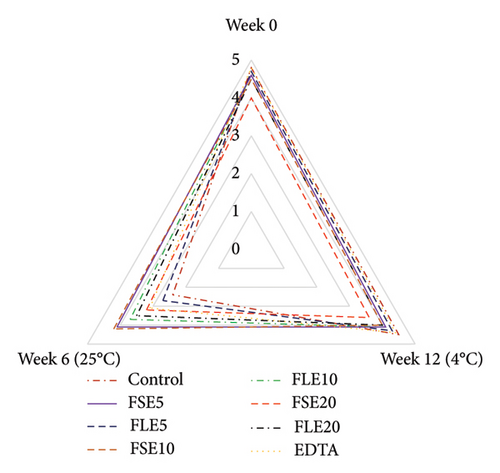
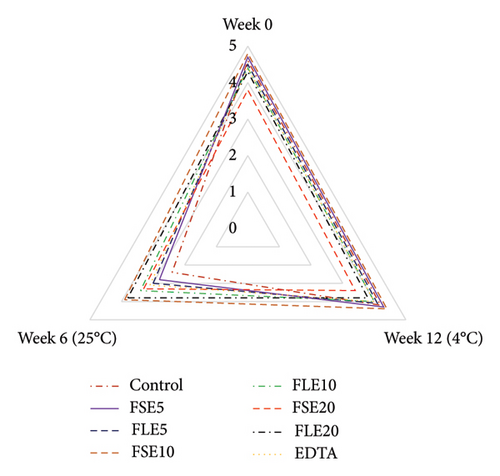
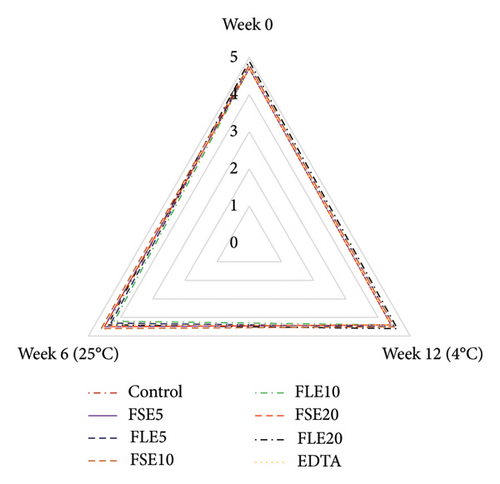
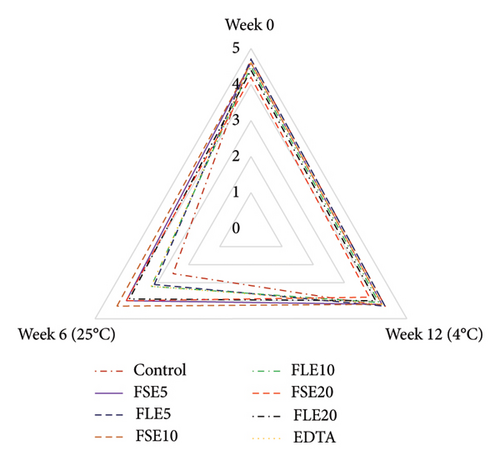
Sensory analysis of the different samples was evaluated using a five-point hedonic scale by 10 trained panelists, who were employees (associates and research assistants) and PhD students of Tokat Gaziosmanpaşa University Faculty of Engineering and Architecture, Department of Food Engineering. Sensory evaluation was performed at the beginning and end of storage for both temperatures (all samples were safe in terms of microbial quality as shown in Figure 1), and three sensory analyses were conducted in total (Figure 2). The ages of the panelists were in the range of 25 to 45. Four male and six female panelists attended the sensory analysis. The panelists were orientated for attribute identification before the sensory analysis. Also, the samples were introduced to the panelists, and they were informed that the extracts used in the study were obtained from fenugreek seeds and leaves. The mayonnaise samples were presented on white plates, and all different samples were coded with blind codes. Mayonnaise samples were taken from the refrigerator 10 minutes before the tests and stored at 25°C. Different samples (∼50 g) were presented to the panelists to evaluate their color, odor, taste, texture, and general acceptances [29].
2.5. Statistical Analysis
To demonstrate the effects of the multiple independent variables (type of additive, concentration of additives, and storage time) for 4°C and 25°C storage temperatures, data were analyzed using multifactorial ANOVA at a 95% confidence interval, and general linear models were generated. All models’ R2 and adjusted R2 (adj-R2) values were given, and the effects of the independent variables and their interactions on the model were determined according to their “p” value. Also, differences in analysis results were determined using Duncan’s post hoc test at a 95% confidence interval (IBM SPSS 21.0, USA). The complete set of statistical analysis is given in supplementary File 1.
3. Results and Discussion
3.1. Antioxidant Activity and Peroxide Value of Mayonnaise
The antioxidant activities of the controls and the phenolic extracts added mayonnaise samples during storage are shown in Table 1. On day zero, the highest antioxidant activity was found in FSE20 (442.91 µmole Trolox/100 g sample) and the lowest was the negative control (28.25 µmole Trolox/100 g sample) (p < 0.05). Although they had the same dry matter content as the initial phenolic extracts (10%, w/v), FSE20 had greater antioxidant activity than their FLE20 counterparts, 2.84 and 4.67 times at 4°C and 25°C at the end of storage, respectively. The antioxidant activity of the negative control sample (without extracts) gradually decreased, and no antioxidant activity was detected in the last storage periods. However, none of the extract-enriched samples lost their antioxidant activity. FSE20 and FLE20 had higher antioxidant activities than the positive control sample (with EDTA) for both storage conditions (p < 0.05). While the antioxidant activities of the FLE20 sample preserved ∼47 and ∼27%, FSE20 sample preserved ∼87 and ∼81% at 4 and 25°C for the end of storage, respectively (Table 1). The effect of the type of additives, concentration of additives and storage time, and their interactions on antioxidant activity was investigated for both storage temperatures. The statistical analysis results showed that the generated models for 4°C and 25°C of storage temperatures were significant (p < 0.05). R2 and adj-R2 values were 1.00 and 0.99 for 4°C of storage temperature, and both 1.00 for 25°C of storage temperature. For both storage temperatures, all independent variables and all interactions of the independent variables (type of additive-concentration of additives, type of additive-storage time, concentration of additives-storage time, and type of additive-concentration of additives-storage time) affected the model significantly (p < 0.05).
| Antioxidant activity (µmole Trolox/100 g sample) | |||||||||
|---|---|---|---|---|---|---|---|---|---|
| ST (weeks) | C | EDTA | FLE5 | FLE10 | FLE20 | FSE5 | FSE10 | FSE20 | |
| 0 | 28.25 (±1.29)gA | 219.63 (±6.44)dA | 69.26 (±2.58)eA | 155.84 (±1.29)eA | 287.98 (±2.58)cA | 219.63 (±1.29)dA | 324.44 (±2.58)bA | 442.91 (±2.58)aA | |
| 4 | 2 | 29.25 (±0.64)gA | 216.53 (±2.58)dAB | 60.70 (±1.29)eB | 145.45 (±3.87)eB | 217.90 (±3.22)cB | 211.07 (±2.58)dB | 299.92 (±1.93)bB | 428.88 (±1.29)aB |
| 4 | 23.79 (±0.64)hB | 196.03 (±1.93)dC | 50.67 (±2.58)fC | 111.73 (±1.29)fD | 199.67 (±3.22)cC | 171.42 (±3.22)eC | 272.58 (±3.22)bC | 412.47 (±1.29)aD | |
| 6 | 17.86 (±3.87)hC | 178.71 (±3.22)dD | 45.66 (±1.93)fD | 107.17 (±1.29)fE | 187.83 (±3.22)cD | 159.58 (±4.51)eD | 266.66 (±5.16)bC | 405.64 (±1.93)aE | |
| 8 | 8.29 (±0.64)hE | 164.13 (±8.38)dE | 41.56 (±2.58)fDE | 95.33 (±1.29)fG | 171.42 (±1.93)cE | 147.73 (±4.51)eE | 247.52 (±6.44)bEF | 397.43 (±0.64)aF | |
| 10 | 6.01 (±1.29)gEF | 138.61 (±4.51)cF | 30.17 (±0.64)eF | 73.00 (±4.51)eI | 141.80 (±9.02)cG | 129.96 (±1.29)dF | 241.60 (±8.38)bF | 387.41 (±1.93)aG | |
| 12 | nd | 131.32 (±4.51)cF | 24.70 (±1.93)eG | 56.59 (±4.51)eK | 134.97 (±5.80)cH | 124.03 (±0.64)dG | 229.29 (±3.87)bG | 382.85 (±1.93)aG | |
| 25 | 1 | 30.17 (±0.64)gA | 206.96 (±7.09)dBC | 59.33 (±1.93)eB | 141.35 (±4.51)eC | 212.43 (±0.64)cB | 205.14 (±1.93)dC | 294.00 (±1.29)bB | 423.86 (±1.93)aC |
| 2 | 11.48 (±1.29)hD | 155.02 (±1.93)dE | 40.65 (±1.29)fE | 99.43 (±0.64)fF | 168.69 (±1.93)cE | 150.01 (±1.29)eE | 259.37 (±2.58)bD | 386.50 (±3.22)aG | |
| 3 | 5.56 (±0.64)hF | 139.98 (±1.29)dF | 37.00 (±1.29)fE | 85.76 (±3.22)fH | 149.55 (±3.22)cF | 131.32 (±0.64)eF | 249.80 (±1.93)bE | 377.39 (±3.22)aH | |
| 4 | 1.00 (±0.64)hG | 129.96 (±5.16)cF | 30.17 (±0.64)fF | 65.71 (±0.64)fJ | 123.12 (±1.93)dI | 109.45 (±1.93)eH | 227.93 (±1.93)bG | 372.83 (±0.64)aH | |
| 5 | nd | 95.33 (±5.16)cG | 12.85 (±3.22)fH | 40.65 (±1.29)fL | 90.31 (±0.64)dJ | 85.76 (±3.22)eI | 209.24 (±3.87)bH | 364.63 (±1.93)aI | |
| 6 | nd | 67.07 (±2.58)dH | 8.29 (±1.93)eH | 21.96 (±3.22)eM | 76.64 (±3.22)cK | 68.44 (±4.51)dJ | 195.57 (±1.29)bI | 357.79 (±5.16)aJ | |
- C: control sample, EDTA: sample containing 0.20% ethylenediaminetetraacetic acid, FLE5: sample containing 0.05% leaf extract, FLE10: sample containing 0.10% leaf extract, FLE20: sample containing 0.20% leaf extract, FSE5: sample containing 0.05% seed extract, FSE10: sample containing 0.10% seed extract, FSE20: sample containing 0.20% seed extract, ST: storage time, nd: value not determined. a-hMeans with unusual superscripts within a row are significantly different (p < 0.05). A-MMeans with unusual superscripts within a column are significantly different (p < 0.05).
Kishk and Elsheshetawy [23] studied the effect of the ginger powder (0–1.25%) on the stability of mayonnaise and reported that the antioxidant activity of the prepared mayonnaises was due to the high antioxidant capacity of the ginger extracts. Li et al. [14] added purple corn extracts to mayonnaise and revealed the effect of the extracts during storage. Researchers reported that mayonnaise containing 0.4 g/kg of anthocyanin-rich purple corn husk extract showed the strongest antioxidant performance. Rasmy et al. [30] studied the effect of the sage extracts on the shelf life of mayonnaise. They also revealed that the ethanolic extract (400 µg/g, the highest concentration used in the study) gave an excellent antioxidant effect on the stability of mayonnaise.
The observed differences in antioxidant activity between FSE and FLE extracts can be attributed to their distinct phenolic compositions. Fenugreek seeds are known to contain a variety of phenolic compounds such as flavonoids, saponins, and alkaloids, which have been reported to exhibit potent antioxidant properties [17]. These compounds are believed to scavenge free radicals and inhibit oxidative processes by donating hydrogen atoms or electrons, thereby preventing lipid oxidation and preserving the overall quality of food products during storage. Fenugreek leaves also contain phenolic compounds but typically in different proportions compared to the seeds. The higher antioxidant activity observed in FSE20 compared to FLE20 may be linked to the specific phenolic profile of the seed extract, which includes higher concentrations of certain bioactive compounds known for their antioxidant potential [17]. The presence of these compounds in the mayonnaise samples enriched with fenugreek extracts likely contributed to their superior antioxidant performance throughout the storage period, as evidenced by the sustained levels of antioxidant activity compared to the negative control.
The peroxide value is one of the most important quality parameters for high-fat-containing food products. The results of the peroxide value analysis of the samples added to the control and phenolic extracts during storage are given in Table 2. The initial peroxide values of the different samples ranged between 0.65 and 0.68 meqO2/kg oil (p > 0.05). The peroxide values of all samples increased with increasing storage time at 4°C. At the end of storage at 4°C, FLE5, FLE10, and FLE20 samples showed a 5.90, 5.79, and 4.96 times increase in peroxide value, respectively. The same trend was observed for the FSE samples, and the peroxide values of FSE5, FSE10, and FSE20 increased 5.85, 4.79, and 3.2 times compared to their initial values. However, the peroxide values of the negative and positive control samples showed an increase of 8 and 5.30 times, respectively. The highest increase was observed for the negative control sample, and the peroxide value of the positive control was higher than that of FSE10, FSE20, and FLE20 (p < 0.05). Among all samples, FSE20 was the best preventive measure of increase in peroxide values (p < 0.05). The statistical analysis of peroxide value indicated that the models generated using the independent variables (type of additive, concentration of additives, and storage time) were significant at 4°C and 25°C storage temperatures (p < 0.05). For the 4°C storage temperature, the R2 and adj-R2 values were 0.993 and 0.991, respectively. All independent variables, as well as their interactions, had a significant effect on the model for 4°C of storage temperature (p < 0.05). When all the data for the antioxidant activity and peroxide value are evaluated, the antioxidant properties of FSE and FLE could have prevented the autooxidation of unsaturated fatty acids in mayonnaise (Tables 1 and 2). Shabbir et al. [5], Martillanes et al. [7], and Włodarczyk et al. [31] reported similar results for the addition of antioxidant extracts of different plants to mayonnaise.
| Peroxide value (meq O2/kg oil) | |||||||||
|---|---|---|---|---|---|---|---|---|---|
| ST (weeks) | C | EDTA | FLE5 | FLE10 | FLE20 | FSE5 | FSE10 | FSE20 | |
| 0 | 0.68 (±0.06)aK | 0.67 (±0.05)aFG | 0.66 (±0.07)aK | 0.63 (±0.06)aK | 0.66 (±0.05)aG | 0.67 (±0.05)aI | 0.66 (±0.07)aE | 0.65 (±0.06)aE | |
| 4 | 2 | 0.79 (±0.04)aK | 0.64 (±0.06)cF | 0.75 (±0.03)abK | 0.68 (±0.06)bcJK | 0.66 (±0.05)cG | 0.68 (±0.06)bcI | 0.65 (±0.07)cE | 0.64 (±0.06)cE |
| 4 | 1.41 (±0.09)aJ | 0.71 (±0.10)deFG | 0.90 (±0.04)bJ | 0.82 (±0.04)bcIJ | 0.88 (±0.06)bG | 0.82 (±0.03)bcdHI | 0.73 (±0.05)cdeE | 0.67 (±0.10)eE | |
| 6 | 2.13 (±0.12)aI | 0.85 (±0.02)deF | 1.04 (±0.04)bI | 0.94 (±0.04)cHI | 0.83 (±0.03)deG | 0.86 (±0.03)cdH | 0.82 (±0.05)deE | 0.77 (±0.03)eE | |
| 8 | 3.24 (±0.17)aF | 2.13 (±0.18)bD | 2.12 (±0.13)bH | 2.01 (±0.18)bcG | 1.56 (±0.15)dF | 2.08 (±0.08)bG | 1.81 (±0.15)cD | 1.16 (±0.10)eD | |
| 10 | 4.18 (±0.18)aE | 2.51 (±0.13)cC | 2.82 (±0.14)bE | 2.67 (±0.09)bcD | 2.12 (±0.13)dD | 2.82 (±0.13)bE | 2.13 (±0.13)dC | 1.41 (±0.09)eC | |
| 12 | 5.44 (±0.15)aC | 3.55 (±0.16)cA | 3.90 (±0.11)bD | 3.65 (±0.19)bcC | 3.25 (±0.18)dC | 3.92 (±0.14)bC | 3.16 (±0.20)dB | 2.13 (±0.26)eA | |
| 25 | 1 | 1.33 (±0.05)aJ | 0.82 (±0.03)dFG | 1.07 (±0.05)bI | 1.01 (±0.05)bcH | 0.71 (±0.09)eG | 0.95 (±0.02)cH | 0.71 (±0.03)eE | 0.65 (±0.06)eE |
| 2 | 3.01 (±0.06)aG | 2.13 (±0.06)dD | 2.51 (±0.05)bF | 2.37 (±0.05)cE | 1.80 (±0.17)eE | 2.28 (±0.05)cF | 1.81 (±0.04)eD | 1.15 (±0.07)fD | |
| 3 | 4.88 (±0.12)aD | 2.43 (±0.25)fC | 4.35 (±0.11)bC | 3.76 (±0.09)cC | 3.10 (±0.09)eC | 3.45 (±0.08)dD | 2.18 (±0.18)gC | 1.53 (±0.12)hC | |
| 4 | 2.81 (±0.13)aH | 1.82 (±0.12)dE | 2.30 (±0.06)bG | 2.21 (±0.04)bcF | 1.57 (±0.09)eF | 2.12 (±0.09)cG | 1.65 (±0.05)eD | 0.79 (±0.14)fE | |
| 5 | 8.94 (±0.26)aB | 3.04 (±0.09)fB | 7.14 (±0.12)bB | 6.59 (±0.14)cB | 5.86 (±0.19)dB | 5.00 (±0.17)eB | 3.12 (±0.12)fB | 1.95 (±0.12)gB | |
| 6 | 9.78 (±0.21)aA | 3.20 (±0.14)fB | 7.68 (±0.09)bA | 6.98 (±0.18)cA | 6.16 (±0.28)dA | 5.46 (±0.26)eA | 3.38 (±0.24)fA | 2.07 (±0.08)gAB | |
- C: control sample, EDTA: sample containing 0.20% ethylenediaminetetraacetic acid, FLE5: sample containing 0.05% leaf extract, FLE10: sample containing 0.10% leaf extract, FLE20: sample containing 0.20% leaf extract, FSE5: sample containing 0.05% seed extract, FSE10: sample containing 0.10% seed extract, FSE20: sample containing 0.20% seed extract, ST: storage time, nd: value not determined. a-hMeans with unusual superscripts within a row are significantly different (p < 0.05). A−KMeans with unusual superscripts within a column are significantly different (p < 0.05).
At 25°C of storage, the peroxide values of the mayonnaise samples followed different trends than those obtained at 4°C. All peroxide values increased until the third week of storage, then decreased at the fourth week, and followed the secondary increase trend until the end of storage (Table 2). This phenomenon can be explained by the generation of secondary oxidation products caused by the degradation of hydroperoxides [4]. Sørensen et al. [32] also reported that the declining trend of peroxide values at a certain time could be related to the breakdown of lipid hydroperoxides into secondary fragments, and the secondary increasing trend could be explained by the acceleration of oxidation during the rest of storage time. Alizadeh et al. [1] studied the effect of the tocopherol, rosemary essential oil, and Ferulago angulata extracts on the oxidative stability of mayonnaise and reported similar results for the peroxide value. At the end of the storage time for 25°C (6 weeks), the peroxide values of the mayonnaise samples followed the order of FSE20 < EDTA = FSE10 < FSE5 < FLE20 < FLE10 < FLE5 < C (Table 2). In addition, according to statistical results, the R2 and adj-R2 values were both 0.997 for the 25°C storage temperature. All independent variables and their interactions had also significant effects on the model for 25°C of storage temperature (p < 0.05).
3.2. pH and Titratable Acidity of Mayonnaise
Mayonnaise can be considered as an acidic food product. For a mayonnaise sample, the pH value and acidity are two important parameters that have an effect on microbial quality and sensorial perspective [33]. The pH values of the samples were measured during certain intervals for different storage temperatures, and there were significantly different pH values between the samples and storage times (p < 0.05) (Table 3). The initial pH values of the samples were close to each other, but samples having FSE had slightly higher pH values, possibly due to the initial pH value (6.40 ± 0.04) of the extract (p < 0.05). When considering all samples, pH remained the same until 4th week of storage. After that period, the pH values of the samples were reduced, and the highest decrease was observed for the control samples (p < 0.05). On the other hand, the lowest decrease was observed for the FSE10 and FSE20 samples in the 12th week for 4°C (p < 0.05). The pH decreases of the FLE5 and FLE10 samples were similar to both control samples and higher than that of the rest of the other samples (p < 0.05) (Table 3). Similar results were obtained for 25°C, and the highest pH value was observed for the FSE10 and FSE20 samples at the end of storage (p < 0.05) (Table 3). The reduction in pH values for all samples can be explained by the activity of the lactic acid bacteria [23]. The statistical results also showed that the generated models were significant (p < 0.05) for both 4°C and 25°C storage temperatures. The R2 and adj-R2 values were 0.999 and 0.998, respectively, for the 4°C storage temperature, and both were 1.00 for the 25°C storage temperature. For 4°C of storage temperature, the linear effects of type of additive, concentration of additives, and storage time on the model were significant (p < 0.05). Interactions of the type of additive-concentration of additives and concentration of additives-storage time did not affect the model significantly (p > 0.05). Except these two interactions, all other ones had significant effects on the model for 4°C of storage temperature (p < 0.05). For the 25°C storage temperature, all independent variables, as well as their interactions, significantly influenced the model (p < 0.05).
| pH | |||||||||
|---|---|---|---|---|---|---|---|---|---|
| ST (weeks) | C | EDTA | FLE5 | FLE10 | FLE20 | FSE5 | FSE10 | FSE20 | |
| 0 | 4.52 (±0.00)dB | 4.53 (±0.01)cdB | 4.53 (±0.01)cB | 4.55 (±0.00)bC | 4.56 (±0.01)aA | 4.55 (±0.00)aC | 4.56 (±0.00)aC | 4.56 (±0.00)aA | |
| 4 | 2 | 4.52 (±0.00)eB | 4.53 (±0.00)eB | 4.53 (±0.00)dB | 4.55 (±0.01)cBC | 4.56 (±0.01)bA | 4.56 (±0.00)bC | 4.56 (±0.00)abB | 4.57 (±0.00)aA |
| 4 | 4.52 (±0.00)eB | 4.53 (±0.00)dB | 4.53 (±0.00)dB | 4.54 (±0.00)cC | 4.55 (±0.00)bB | 4.55 (±0.00)bC | 4.56 (±0.00)bC | 4.56 (±0.00)aA | |
| 6 | 4.48 (±0.00)fC | 4.48 (±0.00)gC | 4.49 (±0.00)eC | 4.50 (±0.00)dD | 4.52 (±0.01)aC | 4.51 (±0.00)cD | 4.51 (±0.00)cD | 4.51 (±0.00)bB | |
| 8 | 4.39 (±0.00)fE | 4.40 (±0.00)eE | 4.41 (±0.00)dE | 4.42 (±0.00)bcF | 4.42 (±0.00)bE | 4.42 (±0.00)cF | 4.42 (±0.00)bF | 4.43 (±0.00)aD | |
| 10 | 4.21 (±0.00)bF | 4.23 (±0.00)bF | 4.23 (±0.00)bF | 4.23 (±0.00)bG | 4.23 (±0.00)bF | 4.23 (±0.01)bG | 4.23 (±0.01)bG | 4.26 (±0.00)aE | |
| 12 | 4.03 (±0.01)cH | 4.02 (±0.00)cH | 4.03 (±0.01)cH | 4.03 (±0.00)cI | 4.04 (±0.00)bH | 4.04 (±0.00)bI | 4.04 (±0.00)abI | 4.04 (±0.00)aG | |
| 25 | 1 | 4.52 (±0.00)gB | 4.53 (±0.01)fA | 4.51 (±0.01)eB | 4.55 (±0.00)dB | 4.56 (±0.00)cA | 4.56 (±0.00)bcB | 4.57 (±0.00)abB | 4.57 (±0.00)aA |
| 2 | 4.53 (±0.00)fA | 4.53 (±0.00)eA | 4.54 (±0.01)dA | 4.56 (±0.00)cA | 4.56 (±0.00)bA | 4.57 (±0.00)aA | 4.57 (±0.00)aA | 4.57 (±0.00)aA | |
| 3 | 4.42 (±0.00)eD | 4.44 (±0.00)dD | 4.44 (±0.00)dD | 4.45 (±0.00)cE | 4.46 (±0.00)cD | 4.46 (±0.00)cE | 4.46 (±0.00)bE | 4.47 (±0.00)aC | |
| 4 | 4.11 (±0.00)dG | 4.12 (±0.00)bcdG | 4.12 (±0.00)bcdG | 4.12 (±0.00)cdH | 4.12 (±0.00)bcG | 4.12 (±0.00)bH | 4.12 (±0.00)aH | 4.12 (±0.00)aF | |
| 5 | 3.92 (±0.00)eI | 3.92 (±0.00)eI | 3.92 (±0.00)eI | 3.92 (±0.00)dJ | 3.93 (±0.00)dI | 3.93 (±0.00)cJ | 3.93 (±0.00)bJ | 3.94 (±0.00)aH | |
| 6 | 3.80 (±0.00)fJ | 3.80 (±0.00)eJ | 3.80 (±0.00)fJ | 3.82 (±0.00)dK | 3.82 (±0.00)cJ | 3.82 (±0.00)bK | 3.83 (±0.00)aK | 3.83 (±0.00)aI | |
- C: control sample, EDTA: sample containing 0.20% ethylenediaminetetraacetic acid, FLE5: sample containing 0.05% leaf extract, FLE10: sample containing 0.10% leaf extract, FLE20: sample containing 0.20% leaf extract, FSE5: sample containing 0.05% seed extract, FSE10: sample containing 0.10% seed extract, FSE20: sample containing 0.20% seed extract, ST: storage time. a-gMeans with unusual superscripts within a row are significantly different (p < 0.05). A−KMeans with unusual superscripts within a column are significantly different (p < 0.05).
The titratable acidity values of the mayonnaise samples followed a trend opposite to the pH values as the lower titratable acidity showed by higher pH value. The titratable acidity values of the negative control samples were the highest at the end of storage for both conditions and those of the FSE20 sample were the lowest (p < 0.05) (Table 4). FLE5, FLE10, and FLE20 samples also showed lower titratable acidity values than the negative control samples, but their values were higher than those of FSE20 (p < 0.05). The generated models for both storage temperatures were found to be significant when type of additive, concentration of additives, and storage time were considered as independent variables (p < 0.05). For the 4°C storage temperature, the R2 and adj-R2 values were 0.987 and 0.983, respectively. Similarly, for the 25°C storage temperature, the R2 and adj-R2 values were 0.989 and 0.985. All independent variables and their interactions had a significant effect on the titratable acidity values at both 4°C and 25°C storage temperatures.
| Titratable acidity (%) | |||||||||
|---|---|---|---|---|---|---|---|---|---|
| ST (weeks) | C | EDTA | FLE5 | FLE10 | FLE20 | FSE5 | FSE10 | FSE20 | |
| 0 | 0.74 (±0.02)aH | 0.73 (±0.01)aG | 0.69 (±0.03)bH | 0.69 (±0.02)bI | 0.69 (±0.02)bH | 0.71 (±0.02)abJ | 0.71 (±0.02)abH | 0.70 (±0.03)abG | |
| 4 | 2 | 0.74 (±0.02)aH | 0.68 (±0.03)cH | 0.69 (±0.02)bcH | 0.68 (±0.01)cI | 0.63 (±0.01)dI | 0.71 (±0.02)bJ | 0.69 (±0.01)cH | 0.63 (±0.01)dI |
| 4 | 0.78 (±0.03)aGH | 0.73 (±0.02)bcG | 0.76 (±0.04)abG | 0.68 (±0.03)dI | 0.67 (±0.01)dH | 0.75 (±0.02)bI | 0.71 (±0.02)cH | 0.67 (±0.01)dH | |
| 6 | 0.90 (±0.03)aF | 0.80 (±0.02)cF | 0.86 (±0.01)bF | 0.81 (±0.02)cG | 0.77 (±0.01)dG | 0.82 (±0.02)cG | 0.75 (±0.01)dG | 0.72 (±0.02)eFG | |
| 8 | 1.09 (±0.02)aE | 0.87 (±0.03)dE | 0.98 (±0.01)bE | 0.93 (±0.02)cF | 0.87 (±0.03)dE | 0.97 (±0.02)bE | 0.87 (±0.02)dE | 0.74 (±0.02)eEF | |
| 10 | 1.19 (±0.04)aD | 0.96 (±0.03)dD | 1.09 (±0.02)bD | 1.03 (±0.03)cD | 0.97 (±0.04)dD | 1.01 (±0.02)cD | 0.93 (±0.03)dD | 0.77 (±0.02)dDE | |
| 12 | 1.23 (±0.01)aD | 1.02 (±0.00)eC | 1.14 (±0.01)bC | 1.12 (±0.01)cC | 1.07 (±0.02)dC | 1.12 (±0.02)bcC | 1.02 (±0.02)eC | 0.80 (±0.02)fCD | |
| 25 | 1 | 0.81 (±0.03)aG | 0.79 (±0.02)aF | 0.78 (±0.02)abG | 0.74 (±0.01)cdH | 0.74 (±0.02)cdG | 0.78 (±0.02)aH | 0.75 (±0.02)bcG | 0.71 (±0.03)eFG |
| 2 | 0.93 (±0.03)aF | 0.79 (±0.02)dF | 0.84 (±0.02)bcF | 0.81 (±0.01)cdG | 0.76 (±0.02)efG | 0.86 (±0.02)bF | 0.78 (±0.01)deF | 0.73 (±0.03)fFG | |
| 3 | 1.08 (±0.04)aE | 0.84 (±0.02)cE | 0.98 (±0.02)bE | 0.96 (±0.04)bE | 0.83 (±0.05)cF | 0.98 (±0.01)bE | 0.86 (±0.03)cE | 0.77 (±0.02)dDE | |
| 4 | 1.30 (±0.06)aC | 1.00 (±0.05)dC | 1.14 (±0.02)bC | 1.13 (±0.01)bC | 1.07 (±0.01)cC | 1.12 (±0.02)bC | 0.99 (±0.02)dC | 0.81 (±0.02)eC | |
| 5 | 1.42 (±0.04)aB | 1.24 (±0.01)cdB | 1.32 (±0.03)bB | 1.25 (±0.03)cB | 1.19 (±0.02)eB | 1.20 (±0.04)deB | 1.13 (±0.01)fB | 0.88 (±0.02)gB | |
| 6 | 1.58 (±0.08)aA | 1.34 (±0.04)cA | 1.44 (±0.01)bA | 1.36 (±0.02)cA | 1.30 (±0.02)cA | 1.32 (±0.01)cA | 1.20 (±0.04)dA | 0.96 (±0.03)eA | |
- C: control sample, EDTA: sample containing 0.20% ethylenediaminetetraacetic acid, FLE5: sample containing 0.05% leaf extract, FLE10: sample containing 0.10% leaf extract, FLE20: sample containing 0.20% leaf extract, FSE5: sample containing 0.05% seed extract, FSE10: sample containing 0.10% seed extract, FSE20: sample containing 0.20% seed extract, ST: storage time. a-gMeans with unusual superscripts within a row are significantly different (p < 0.05). A−IMeans with unusual superscripts within a column are significantly different (p < 0.05).
The low oxidative stability of the negative control sample can be explained by its higher acidity. The lower pH and higher titratable acidity of the negative control samples can cause the breakage of the iron bridges, and the released iron molecules can activate the oxidative enzymes found in egg yolk [23, 34]. Hence, the higher pH and lower acidity of the added extract samples could also have prevented oxidation by restricting iron release.
3.3. Color Change
One of the most important parameters that affect consumers’ choice is the color of food products. The consumer’s demand to buy or taste a new mayonnaise is first related to the color of the mayonnaise [31]. Generally, the typical pale yellowish color, which originates primarily from egg yolk and oil, is preferred by consumers [35]. The total color difference (ΔE) of the mayonnaise samples is shown in Table 5, and all the mayonnaises produced are shown in Figure 3 All values were calculated using the initial L∗, a∗, and b∗ of each sample on day zero as a reference. At the beginning of storage, the L∗, a∗, and b∗ values of the negative control sample were 65.36 ± 0.36, −1.95 ± 0.03, and 50.71 ± 0.65, respectively. The mayonnaise samples did not have observable differences in colors (Figure 3). For all samples, the values of L∗ and b∗ decreased and the values of a∗ increased for all storage conditions (p < 0.05). The decrease in L∗ values may be related to nonenzymatic browning reactions and the production of some brown oxypolymers during the storage by the lipid oxidation process [35]. At day zero, the highest values of a∗ were determined for the FLE20 sample (−0.89 ± 0.05). On the other hand, the a∗ values of the FSE5, FSE10, and FSE20 samples were close to the control sample (−2.13, −2.08, and −2.06, respectively). These results can be associated with the initial color values of FLE and FSE. The values of L∗, a∗, and b∗ for the FLE samples were 20.36 ± 0.18, 9.17 ± 0.06, and 1.77 ± 0.02, and for the FSE samples were 37.30 ± 0.33, 3.77 ± 0.17, and 35.27 ± 0.24, respectively. The positive control sample (with EDTA) had similar color properties to the negative control (L∗ = 65.37 ± 0.31, a∗ = −1.98 ± 0.03, and b∗ = 50.33 ± 0.06) (Figure 3). Altunkaya et al. [15] reported similar findings for the grape seed extract-added mayonnaise samples, L∗ values decreased, and a∗ values increased for the extract-added mayonnaise. They also reported that color change during storage can be associated with oxidative degradation, resulting in undesirable, brown-colored products.
| ΔE | |||||||||
|---|---|---|---|---|---|---|---|---|---|
| ST (weeks) | C | EDTA | FLE5 | FLE10 | FLE20 | FSE5 | FSE10 | FSE20 | |
| 4 | 2 | 0.60 (±0.25)bH | 0.62 (±0.47)bG | 0.68 (±0.36)bG | 0.81 (±0.21)bG | 0.53 (±0.34)bI | 1.48 (±0.17)aG | 0.38 (±0.21)bH | 0.62 (±0.21)bI |
| 4 | 0.48 (±0.22)cH | 0.48 (±0.13)cH | 0.75 (±0.23)bcG | 0.55 (±0.09)cGH | 0.53 (±0.18)cI | 0.85 (±0.25)abH | 0.65 (±0.12)bcG | 1.09 (±0.20)aH | |
| 6 | 0.63 (±0.10)bH | 0.77 (±0.14)abG | 0.71 (±0.05)abG | 0.78 (±0.23)abGH | 1.00 (±0.29)aH | 0.80 (±0.25)abH | 0.71 (±0.16)abG | 0.82 (±0.21)abI | |
| 8 | 2.69 (±0.07)aF | 1.47 (±0.06)efF | 1.45 (±0.19)efF | 2.10 (±0.09)bF | 1.64 (±0.15)cdG | 1.79 (±0.09)cFG | 1.32 (±0.07)fF | 1.56 (±0.12)deG | |
| 10 | 4.55 (±0.10)aE | 3.54 (±0.37)bcD | 3.44 (±0.18)bcD | 4.68 (±0.16)aD | 3.68 (±0.06)bE | 3.34 (±0.12)cE | 3.46 (±0.24)bcD | 2.55 (±0.03)dE | |
| 12 | 6.13 (±0.04)bD | 6.17 (±0.06)bB | 5.84 (±0.14)cC | 6.32 (±0.12)bC | 7.67 (±0.13)aC | 5.55 (±0.13)dC | 5.00 (±0.22)fC | 5.22 (±0.12)eC | |
| 25 | 1 | 1.43 (±0.47)aG | 0.50 (±0.18)bH | 0.58 (±0.18)bG | 0.51 (±0.27)bH | 0.61 (±0.32)bI | 0.81 (±0.22)bH | 0.62 (±0.12)bG | 0.64 (±0.24)bI |
| 2 | 0.48 (±0.16)cH | 0.63 (±0.34)cG | 0.27 (±0.05)dH | 1.90 (±0.10)aF | 0.90 (±0.18)bH | 0.49 (±0.17)cH | 0.61 (±0.08)cG | 0.26 (±0.07)dJ | |
| 3 | 2.59 (±0.06)cF | 1.36 (±0.03)gF | 2.56 (±0.04)cE | 3.45 (±0.05)aE | 3.10 (±0.08)bF | 1.90 (±0.03)fF | 2.30 (±0.03)dE | 2.11 (±0.05)eF | |
| 4 | 6.52 (±0.05)aC | 3.02 (±0.06)hE | 5.54 (±0.10)dC | 6.17 (±0.04)bC | 5.90 (±0.07)cD | 3.87 (±0.05)fD | 3.56 (±0.09)gD | 4.42 (±0.08)eD | |
| 5 | 9.71 (±0.17)bB | 5.95 (±0.14)gC | 8.52 (±0.28)cB | 8.51 (±0.11)cB | 9.96 (±0.09)aB | 6.22 (±0.16)fB | 7.33 (±0.09)eB | 8.18 (±0.12)dB | |
| 6 | 14.28 (±0.15)aA | 11.50 (±0.17)eA | 12.37 (±0.13)cA | 13.11 (±0.07)bA | 13.09 (±0.09)bA | 11.97 (±0.15)dA | 11.13 (±0.08)fA | 11.00 (±0.39)fA | |
- ΔE: total color difference, C: control sample, EDTA: sample containing 0.20% ethylenediaminetetraacetic acid, FLE5: sample containing 0.05% leaf extract, FLE10: sample containing 0.10% leaf extract, FLE20: sample containing 0.20% leaf extract, FSE5: sample containing 0.05% seed extract, FSE10: sample containing 0.10% seed extract, FSE20: sample containing 0.20% seed extract, ST: storage time. a-hMeans with unusual superscripts within a row are significantly different (p < 0.05). A−JMeans with unusual superscripts within a column are significantly different (p < 0.05).
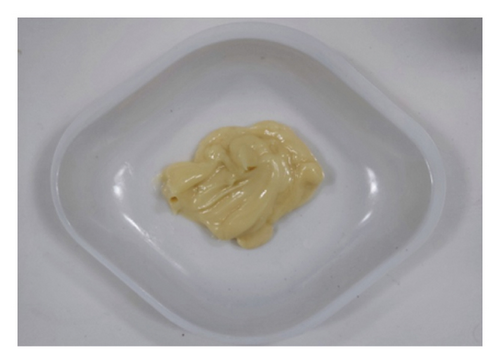
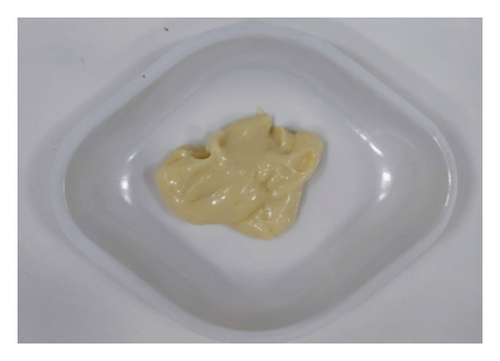
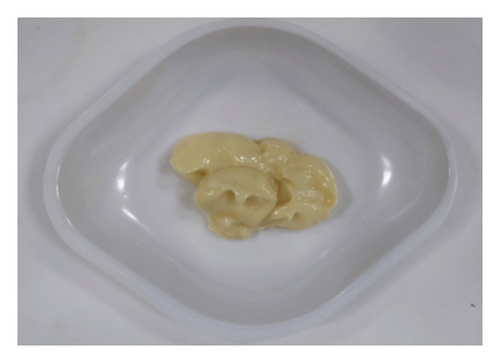
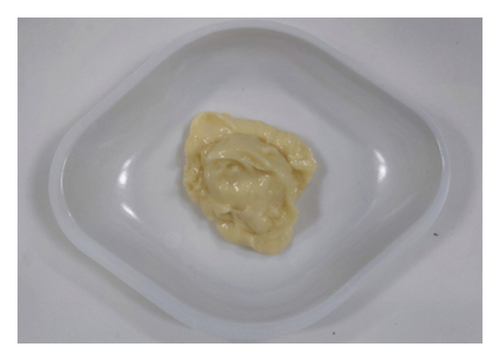
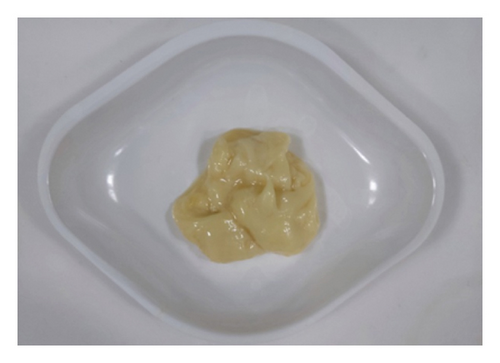
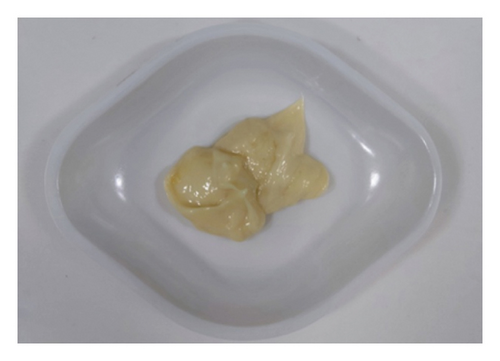
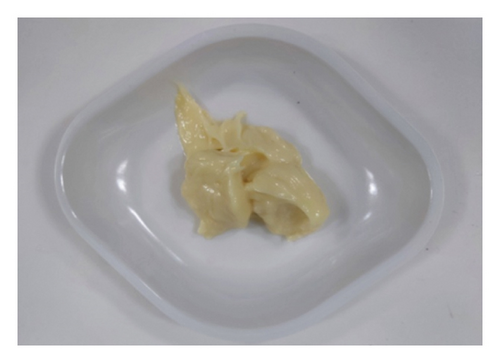
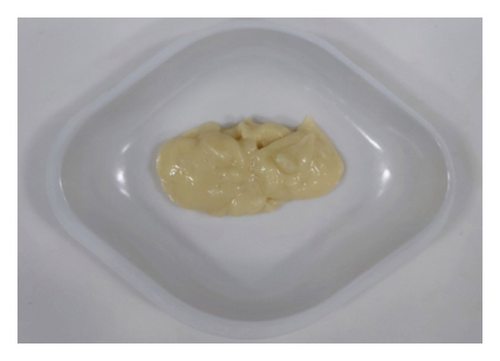
For both storage temperatures, ΔE values increased for all different samples at given storage periods (p < 0.05) (Table 5). The highest ΔE values were observed at the end of certain storage periods for all different samples, and higher ΔE values were obtained for storage (p < 0.05) (Table 5). When ΔE values were compared at the end of storage for 4 and 25°C, the highest color change was observed for the control samples (p < 0.05). Among all enriched samples, the highest ΔE values were observed for the FLE20 sample at the end of storage at 4 and 25°C storage (p < 0.05). The statistical results for ΔE values indicated that the models generated using the independent variables (type of additive, concentration of additives, and storage time) were significant at 4°C and 25°C storage temperatures (p < 0.05). At the 4°C storage temperature, the R2 and adj-R2 values were 0.993 and 0.991, respectively. For the 25°C storage temperature, both the R2 and adj-R2 values were 0.999. At 4°C, all independent variables and their interactions (type of additive-concentration of additives, type of additive-storage time, concentration of additives-storage time, and type of additive-concentration of additives-storage time) significantly influenced the model (p < 0.05), except for the concentration of additives (p > 0.05). At the 25°C storage temperature, all independent variables and their interactions had significant effect on the model (p < 0.05).
Considering the colors, peroxide values, and acidity values, the lowest ΔE, peroxide values, and acidity were observed for mayonnaises added to FSE. This result may be related to the low oxidation rate of the mayonnaise samples that have FSE. Rafiee et al. [36] reported that autooxidation of mayonnaise fats may cause the formation of undesired colored products. Lennersten and Lignert [37] also reported that the color of mayonnaise could depend on oxidative stability during storage.
3.4. Microbial Quality of Mayonnaise
The total aerobic mesophilic bacteria and the total yeast/molds of the mayonnaise samples are shown in Figure 1. Foods containing aerobic mesophilic bacteria are considered as good (<4 log CFU/g), average (4.0–6.7 log CFU/g), poor (6.7–7.7 log CFU/g), and spoiled food (>7.7 log CFU/g) [38]. The initial total aerobic mesophilic aerobic bacteria and the total yeast/mold values were ∼3.5 log CFU/g and ∼2.3 log CFU/g, respectively. The results showed that the total aerobic mesophilic aerobic bacteria and the total yeast/mold counts increased for all different mayonnaise samples at the end of storage (p < 0.05). At the end of both storage conditions, the lowest total aerobic mesophilic aerobic bacteria and the total yeast/mold counts were determined for the FSE20 sample (Figure 1). The microbial counts of the mayonnaises enriched with FLE were higher than those of the FSE samples at the end of both storage temperatures (p < 0.05). However, the final microbial counts of the extract-added samples were significantly lower than those of the negative control sample (p < 0.05). At the end of both storages, the total aerobic mesophilic aerobic bacteria and the total yeast/mold values of the negative control sample were 6.16 and 3.94 log CFU/g and 7.12 and 4.47 log CFU/g for 4 and 25°C, respectively. Total aerobic mesophilic aerobic bacteria in the positive control sample (with EDTA) were higher than all FSE samples at the end of 25°C; however, it was higher than the FSE20 sample at the end of storage at 4°C. The yeast/mold counts of the positive control samples were higher than those of the FSE10, FSE20, and FLE20 samples at the end of the 4°C and higher than the FSE20 sample at the end of the 25°C (p < 0.05). All the results showed that the addition of 0.20% FSE to mayonnaise prevented microbial growth better than both EDTA and FLE. None of the samples were spoiled for the given storage temperatures and storage times. However, the control samples stored at 25°C can be considered as “poor” after storage time of 6 weeks. For 4°C, all samples with additives showed “good” quality except the control sample. For 25°C of storage temperature, the similar results were obtained at the storage time of 2 weeks (Figure 1).
Titratable acidity values can be related to microbial growth. Higher titratable acidity values (1.23 and 1.58% at 4°C and 25°C, respectively) were observed for negative control samples at the end of storage. However, the lowest titratable acidity values (0.80% and 0.96%) were determined for the FSE20 samples at 4°C and 25°C. The microbial synthesis of organic acids produced by yeast and lactic acid bacteria could have increased acidity levels, which was delayed with the addition of FSE and FLE [4]. The total number of mesophilic aerobic bacteria in our mayonnaise samples followed a similar pattern to rapeseed extract-added mayonnaise produced by Kim and Lee [4]. At the first week of 25°C and in the second week of storage at 4°C, a slight decline was observed at the total number of mesophilic aerobic bacteria count. These phenomena could be attributed to the suppression of the growth of psychrophilic microorganism. The prolonged lag phase of microorganisms sensitive to cold temperatures, or the antibacterial properties exerted by organic acids, such as citric acid and malic acid, found in the lemon juice included as an ingredient [39]. In addition to their antioxidative properties, fenugreek extracts also have antimicrobial properties, and these properties of the extracts can be very useful for prolonging the shelf life of mayonnaise. In this study, the microbial quality of mayonnaise has been improved using FSE and FLE, and this could be a possible antimicrobial additive for industry-scale or culinary use.
In addition to their antioxidative benefits, FSE and FLE extracts exhibit notable antimicrobial properties [17], as evidenced by their ability to effectively inhibit the growth of total aerobic mesophilic bacteria and yeast/molds in mayonnaise. The observed lower microbial counts in samples enriched with FSE and FLE compared to controls suggest that these extracts contribute to microbial stability during storage. This antimicrobial effect is crucial for extending the shelf life of mayonnaise, especially under varying storage conditions, thereby enhancing product safety and quality. The findings underscore the potential of fenugreek extracts as natural antimicrobial additives in food applications.
3.5. Sensory Quality of Mayonnaise
The sensory attributes of a food product define its real price and the willingness of consumers to take it. In this study, all mayonnaise samples were subjected to sensory analysis at the beginning of storage and at the end of storage for both temperatures. The color, odor, taste, texture, and general acceptance of mayonnaise were evaluated, and remarkable results were obtained (Figure 2). The color of the samples was examined, and the lowest score was given to the FLE20 sample (3.90 ± 0.74), possibly due to its highest values of a∗ Figure 2(a). FSE20 had the lowest odor score (4.00 ± 0.82) and taste score (3.80 ± 0.79), possibly due to the high saponin content [19] and characteristic flavor of fenugreek seeds (Figures 2(b) and 2(c)). Mostafa et al. [16] reported that 500 mg/kg (0.05%) of fenugreek seed extract in mayonnaise showed a similar antioxidant effect with 200 mg/kg (0.02%) of tertiary butylhydroquinone (TBHQ, a synthetic antioxidant). However, the high concentration (1500 mg/kg, 0.15%) of fenugreek seed extract negatively affected the sensory quality of mayonnaise. On day 0, the negative control samples had the highest score for all types of sensory criteria (p < 0.05). The general acceptance of the negative control and the FLE5 sample received similar scores as 4.70 ± 0.48 and 4.70 ± 0.67, respectively (p > 0.05). Significant changes in sensory attributes were observed when the samples were stored at different temperatures. At the end of storage at 4°C, the highest general acceptance was observed for the negative control and FLE5 (4.30 ± 0.67, p > 0.05). The observed differences were more significant for samples stored at 25°C than at 4°C. The general acceptance scores of the negative control sample decrease to 2.50 ± 0.53 at 25 °C. In addition, all sensory attributes of the control sample received low scores except texture (4.40 ± 0.52) and color (3.70 ± 0.48). The texture properties of mayonnaise were not significantly affected by the addition of the extracts in the given time interval at 25°C (Figure 2(d)). The highest general acceptance scores (4.30 ± 0.48) were given to FSE10 at the end of storage at 25°C (Figure 2(e)). Based on our results, the addition of 0.01% FSE obtained a good level of sensory scores and the lowest score of the negative control samples could be associated with high oxidation, high rancidity, and presence of organic acids produced by microbial growth [2]. Rasmy et al. [30] added sage extracts to mayonnaise and determined sensory properties during storage. They similarly reported that mayonnaise samples having 400 µg/g were superior to the control mayonnaise in terms of taste and general acceptability. Kishk and Elsheshetawy [23] added ginger powder (0–1.25%) to mayonnaise and reported that mayonnaise samples formulated with 1.0% and 1.25% ginger powder demonstrated markedly superior general acceptability scores at both the initial time point and after a storage period of 20 weeks, compared to the control and other samples.
4. Conclusions
The use of chemical preservatives in the food industry is a major concern for consumers, and it is vital to research alternative natural preservatives for both the food industry and culinary use. In this study, the improvement of the quality aspects of mayonnaise during storage was aimed at by adding FSE and FLE, so enriched mayonnaise samples were stored at two different temperatures (4 and 25°C). The chemical, physical, microbial, and sensory attributes of the different mayonnaise samples were determined and compared. It was concluded that the addition of fenugreek extract to mayonnaise showed better microbial quality, oxidative stability, and sensory attributes than that of synthetic antioxidant (EDTA) added mayonnaise. The level of addition level was the important variable because the higher level (0.20%) improved the oxidative and microbiological stability but negatively affected the sensory attributes of mayonnaise. In general, extracts added to FSE had higher oxidative, microbial stability, and sensory attributes compared to FLE-enriched samples. However, FLE-enriched samples also showed positive effects with respect to quality properties compared to negative control samples. The statistical analysis confirmed that the effects of the type and concentration of additives, storage time, and their interactions on antioxidant activity, peroxide value, titratable acidity, and color change were significant (p < 0.05) at both storage temperatures (4°C and 25°C). The R2 and adj-R2 values for all models indicated high accuracy, reinforcing the robustness of the findings. Detailed analysis of statistical results is provided in supplementary File 1. Enrichment of mayonnaise with extracts of fenugreek seeds and leaves could provide an alternative, with long shelf life and a desirable flavor product. Therefore, a novel product can be introduced to the market that has different flavors with natural antioxidants.
Disclosure
This study is already published in the preprint given in the below link https://www.researchsquare.com/article/rs-2229467/v1. Detailed analysis of statistical results is provided in supplementary File 1.
Conflicts of Interest
The authors declare that they have no conflicts of interest.
Acknowledgments
This study was financially supported by the Tokat Gaziosmanpasa University Scientific Research Projects Committee (Project No: 2020/125).
Open Research
Data Availability
The data that support the findings of this study are available from the corresponding author upon reasonable request.


