Integrative Molecular Analyses of an Individual Transcription Factor-Based Genomic Model for Lung Cancer Prognosis
Abstract
Objective. Precision medicine with molecular profiles has revolutionized the management of lung cancer contributing to improved prognosis. Herein, we aimed to uncover the gene expression profiling of transcription factors (TFs) in lung cancer as well as to develop a TF-based genomic model. Methods. We retrospectively curated lung cancer patients from public databases. Through comparing mRNA expression profiling between lung cancer and normal specimens, specific TFs were determined. Thereafter, a TF genomic model was developed with univariate Cox regression and stepwise multivariable Cox analyses, which was verified through the GSE72094 dataset. Gene set enrichment analyses (GSEA) were presented. Downstream targets of TFs were predicted with ChEA, JASPAR, and MotifMap projects, and their biological significance was investigated through the clusterProfiler algorithm. Results. In the TCGA cohort, we proposed a TF-based genomic model, comprised of SATB2, HLF, and NPAS2. Lung cancer individuals were remarkably stratified into high- and low-risk groups. Survival analyses uncovered that high-risk populations presented unfavorable survival outcomes. ROCs confirmed the excellent predictive potency in patients’ prognosis. Additionally, this model was an independent prognostic indicator in accordance with multivariate analyses. The clinical implication of the model was well verified in an independent dataset. High risk score was in relation to carcinogenic pathways. Downstream targets were characterized by immune and carcinogenic activation. Conclusion. The proposed TF genomic model acts as a promising marker for estimation of lung cancer patients’ outcomes. Prospective research is required for testing the clinical utility of the model in individualized management of lung cancer.
1. Introduction
Lung cancer occupies the major cause of cancer incidence and mortality across the globe, with estimated 2.1 million newly diagnosed cases as well as 18.4% of all cancer-related deaths in 2018 [1]. It is primarily classified into small cell lung cancer (SCLC) as well as non-small cell lung cancer (NSCLC). Among them, NSCLC occupies around 85% of lung cancer cases, with an undesirable five-year survival rate below 16%. It is comprised of lung adenocarcinoma (LUAD) and lung squamous cell carcinoma (LUSC), as well as large cell carcinoma histological subtypes [2]. Chemotherapy represents the major therapeutic option against lung cancer, and platinum-based dual treatment is the standard treatment against advanced patients [3]. Nevertheless, chemotherapeutic resistance remains challenging, impeding much therapeutic success. Though tyrosine kinase-based targeted therapy interferes with the oncogenic pathway in NSCLC, acquired resistance evolves contributing to rapid disease recurrence and progression [4]. Immunotherapy like PD-1 and PD-L1 inhibitors has displayed superiority to traditional chemotherapy, which has become the standard for treating NSCLC [5–7]. Nevertheless, in past clinical trials, the objective response rate of immunotherapy remains low [8].
Transcription factors (TFs), DNA-binding proteins, recognize the promoter sequences of genes as well as subsequently guide gene expression [9]. Recent studies demonstrate that patterns of TF programs as well as immune pathway activation characterize four main SCLC subtypes with diverse treatment vulnerabilities [10]. Additionally, system-epigenomics inference of TF activities indicates inactivated aryl-hydrocarbon-receptor as an important event during lung carcinogenesis [11]. Experimental evidences suggest the lung carcinogenic roles of TFs. For instance, Oct4, a critical stemness TF, controls expression of lncRNAs NEAT1 and MALAT1 for promoting lung carcinogenesis [12]. TF NFIB is in relation to tumor aggressiveness in LUAD [13]. TF OCT1 triggers the Warburg effect through upregulating hexokinase 2 in NSCLC [14]. TF YY1 mediates lung cancer progression through activation of lncRNA-PVT1 [15]. Hence, characterization of the genomic profiling of TFs may assist in offering an in-depth understanding of the precise treatment of lung cancer. Herein, we developed a TF genomic model for lung cancer outcomes and uncovered the relevant signaling pathways.
2. Materials and Methods
2.1. Public mRNA Expression Cohorts
The Cancer Genome Atlas- (TCGA-) LUAD and TCGA-LUSC datasets containing mRNA expression profiling, survival and clinicopathologic data (n = 522) were curated from the Genomic Data Commons tool (https://portal.gdc.cancer.gov/) [16], as a training set. Fragments per kilobase million (FPKM) were converted to transcripts per million (TPM). Gene expression arrays of 442 LUAD patients were harvested from GSE72094 [17] via the Gene Expression Omnibus (GEO) repository (https://www.ncbi.nlm.nih.gov/gds/), which acted as a testing set. This dataset was based on the GPL15048 platform. Probe IDs were transformed into gene symbols in accordance with platform annotation file. The standardized expression value was logarithmically converted as well as scaled. Thereafter, the mean expression of genes with various probes was utilized as their expression value. The corresponding patient’s clinical data in TCGA and GSE72094 cohorts are displayed in Supplementary table 1. The gene sets of TFs were harvested from published literature (Supplementary table 2) [9].
2.2. Analyses of Lung Cancer-Specific TFs
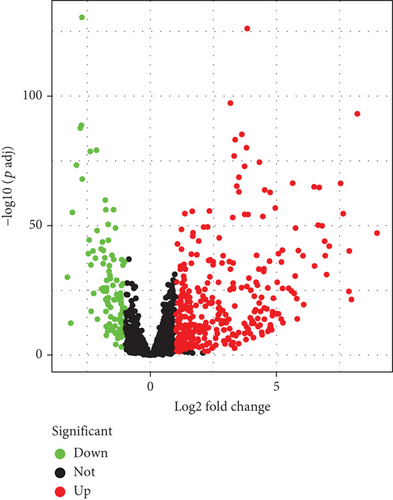
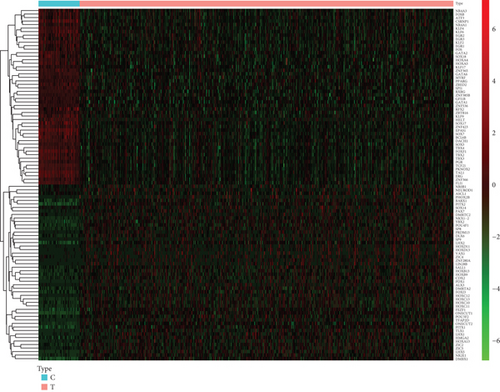
DESeq2 package [18] was adopted for differential analyses of sequencing data. TFs with ∣log2 fold change (FC) | >1 and adjusted p < 0.05 were set as thresholds of lung cancer-specific TFs. Volcano plots and heat map were conducted for visualizing the distribution of lung cancer-specific TFs between lung cancer and normal specimens.
2.3. Construction of a TF Genomic Model
Univariate Cox regression models were conducted for evaluation of the interactions of lung cancer-specific TFs with patients’ prognosis in the TCGA cohort. Thereafter, stepwise multivariate Cox regression analyses were utilized for shrinking the variables as well as screening the most predictive biomarkers. The candidate TF-specific TFs were utilized for creating a risk scoring formula that was determined through a linear integration of mRNA expression as well as matched regression coefficients derived from the stepwise multivariate Cox analyses. Through ranking of the risk scoring system, patients were stratified into high- and low-risk subpopulations. Kaplan–Meier methods were presented for estimating the survival outcomes between high- and low-risk subpopulations, and log-rank tests were adopted for the calculation of the discrepancy in prognosis between subpopulations. The receiver operator characteristic (ROC) curve was depicted through the pROC package [19]. The prognostic potency of the TF genomic model was externally verified in the GSE72094 cohort.
2.4. Uni- and Multivariate Cox Regression Analyses
Through univariate Cox regression analyses, the interactions of clinicopathological indicators (age, gender, and pathological staging) and TF genomic model with lung cancer prognosis were evaluated across lung cancer individuals. Thereafter, multivariate Cox regression models were established for uncovering the independent prognostic indicators.
2.5. Gene Set Enrichment Analyses (GESA)
Through the Java program (http://software.broadinstitute.org/gsea/index.jsp), GSEA [20] was carried out on the basis of the “c2.cp.kegg.v7.2.symbols” gene set curated from the Molecular Signatures Database (MSigDB) project [21]. Cytoscape software [22] was adopted for visualizing our GSEA results. The interactions of specific gene sets with risk score for all genes were investigated, and positively and negatively correlated ones to the enrichment score were calculated. In total, 1000 permutations were conducted, and pathways with false discovery rate (FDR) < 0.05 were regarded as having prominent enrichment.
2.6. Prediction of Downstream Targets of TFs
Three web-based interactive applications, containing ChIP Enrichment Analysis (ChEA; http://amp.pharm.mssm.edu/lib/chea.jsp) [23], JASPAR (http://jaspar.genereg.net), and MotifMap (http://motifmap.igb.uci.edu/) databases, were adopted for estimating the downstream targets of TFs. The ChEA project offers data on eukaryotic TFs, consensus binding sequences, and experimentally validated binding sites as well as modulated genes [24]. The JASPAR project represents an open-access project of curated, nonredundant TF-binding profiling stored as a position frequency matrix for TFs among diverse species in six taxonomic populations [25]. MotifMap provides integrative genome-wide maps of regulated motif sites for model species [26].
2.7. Functional Enrichment Analyses
Gene Ontology (GO) as well as Kyoto Encyclopedia of Genes and Genomes (KEGG) pathway enrichment analyses were carried out for determining the biological functions of downstream targets of TFs through the clusterProfiler package [27]. GO depicted three complementary biological concepts containing biological process (BP) and molecular function (MF) as well as cellular component (CC). Meanwhile, KEGG may assist uncover high-level functions and utilities of biological systems.
2.8. Statistical Analyses
All statistical analyses were managed through R software (version 3.6.3). Student’s t-test or Wilcoxon test was adopted for statistical comparisons, with p < 0.05 as statistical significance.
3. Results
3.1. Identification of Lung Cancer-Specific TFs
This study retrospectively curated mRNA expression profiling, survival, and clinicopathologic data of lung cancer from the TCGA project. With the ∣log2 FC | >1 and adjusted p < 0.05 thresholds, 320 upregulated TFs as well as 103 downregulated TFs were determined in lung cancer in comparison with normal tissues (Figures 1(a) and 1(b); Supplementary table 3). The above deregulated TFs were regarded as lung cancer-specific TFs.
3.2. Determination of Prognostic Lung Cancer-Specific TFs
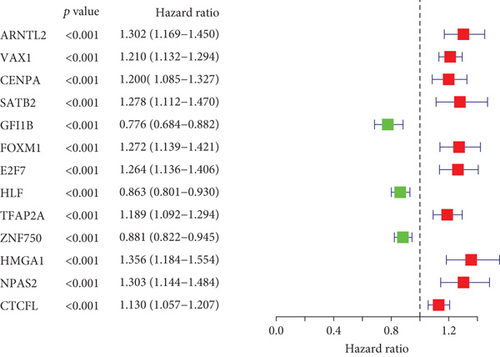
On the basis of mRNA expression profiling and survival information of lung cancer patients from the TCGA cohort, we conducted the interactions of lung cancer-specific TFs with clinical prognosis through univariate Cox regression models. In accordance with p < 0.05, 13 lung cancer-specific TFs displayed remarkable associations with lung cancer outcomes (Figure 2(a); Table 1). Among them, GFI1B, HLF, and ZNF750 acted as protective factors of lung cancer prognosis. Meanwhile, CTCFL, TFAP2A, CENPA, VAX1, E2F7, FOXM1, SATB2, ARNTL2, NPAS2, and HMGA1 acted as risk factors of lung cancer prognosis.
| TFs | HR | Lower 95% CI | Upper 95% CI | P value |
|---|---|---|---|---|
| ARNTL2 | 1.302281 | 1.169475 | 1.450168 | 1.49E-06 |
| VAX1 | 1.210274 | 1.131859 | 1.294122 | 2.35E-08 |
| CENPA | 1.19974 | 1.084774 | 1.326889 | 0.000395 |
| SATB2 | 1.278489 | 1.112124 | 1.469741 | 0.000552 |
| GFI1B | 0.776427 | 0.683637 | 0.881812 | 9.75E-05 |
| FOXM1 | 1.272198 | 1.139285 | 1.420617 | 1.90E-05 |
| E2F7 | 1.263852 | 1.135898 | 1.406221 | 1.71E-05 |
| HLF | 0.86293 | 0.801083 | 0.929552 | 0.000102 |
| TFAP2A | 1.188719 | 1.092255 | 1.293702 | 6.24E-05 |
| ZNF750 | 0.881095 | 0.821778 | 0.944694 | 0.000371 |
| HMGA1 | 1.356436 | 1.184181 | 1.553747 | 1.08E-05 |
| NPAS2 | 1.302838 | 1.143688 | 1.484135 | 6.90E-05 |
| CTCFL | 1.129607 | 1.056855 | 1.207367 | 0.000333 |
3.3. Development of a TF Genomic Model for Lung Cancer Prognosis
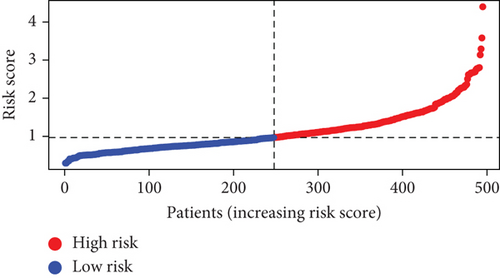
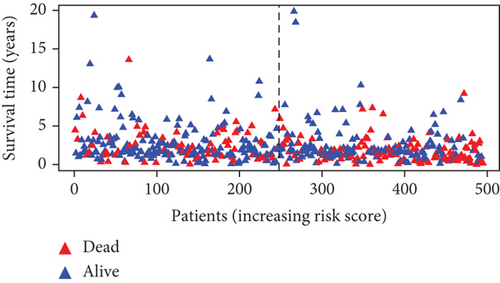
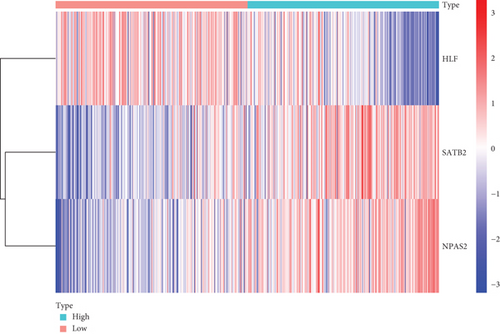
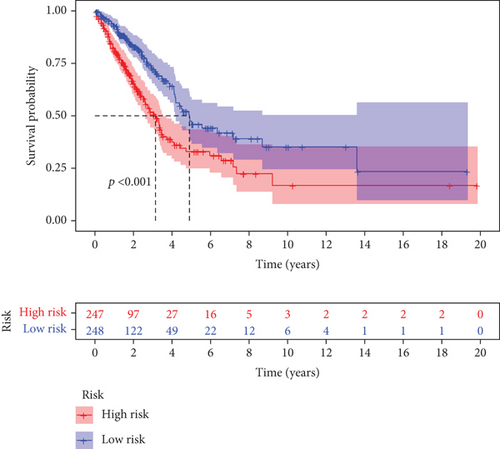
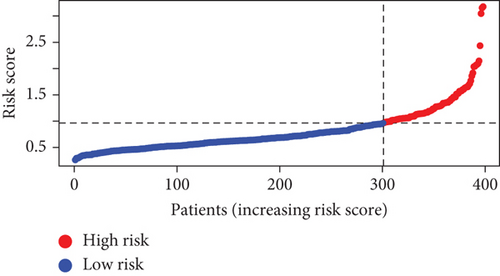
Further multivariate Cox regression analyses displayed that SATB2, HLF, and NPAS2 were independently predictive of lung cancer prognosis. In accordance with the regression coefficient derived from multivariate Cox regression models and expression value of SATB2, HLF, and NPAS2, a TF genomic model was conducted for lung cancer prognosis. The risk score of each lung cancer patient in the TCGA cohort was calculated in line with the following formula: risk score = 0.215678015946362∗SATB2 expression + (−0.133926273065041)∗HLF expression + 0.22354783465585∗NPAS2 expression. Thereafter, lung cancer patients in the TCGA cohort were separated into two groups following the median risk score. Patients with >median risk score were classified into the high-risk group, while those with <median risk score were classified into the low-risk group (Figure 2(b)). Additionally, Figure 2(c) displayed the discrepancy in survival status between two groups. With the increase in risk score, the number of dead patients was gradually elevated. In comparison to the low-risk group, HLF presented reduced expression while SATB2 and NPAS2 possessed upregulated expression in the high-risk group (Figure 2(d)). Survival analyses uncovered that the high-risk group displayed remarkable survival outcomes in comparison to the low-risk group (Figure 2(e)). Further ROC analyses were conducted for verifying the predictive potency of the TF genomic model in lung cancer outcomes. The area under the curve (AUC) was 0.676, indicative of the convincing predictive potency (Figure 2(f)).
3.4. External Verification of the TF Genomic Model
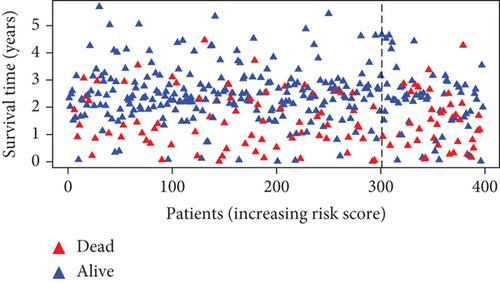
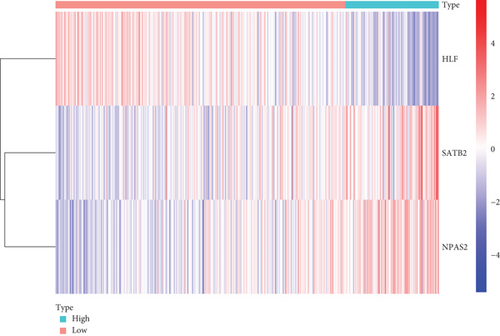
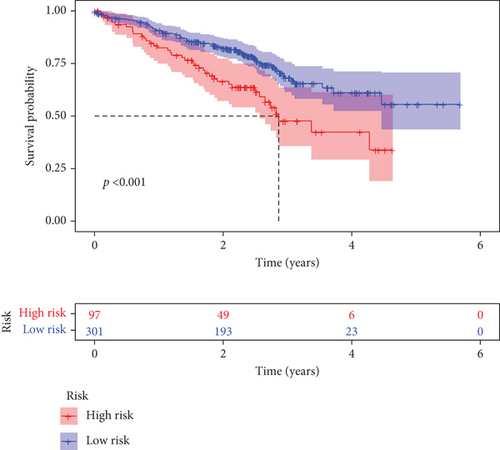
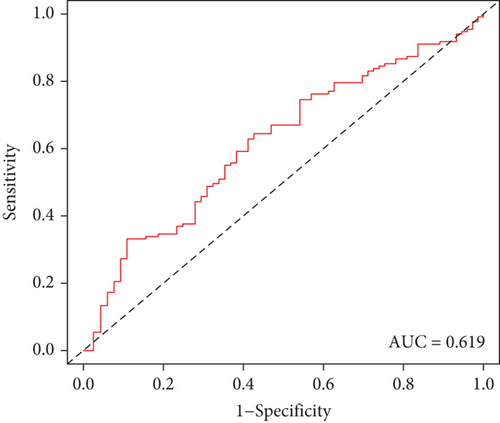
The clinical application potential of the TF genomic model was externally verified in the GSE72094 cohort. In accordance with the same formula, the risk score of each lung cancer patient was quantified. Thereafter, we clustered patients into high- and low-risk groups (Figure 3(a)). As expected, more dead patients were noted in the high-risk group (Figure 3(b)). There was enhanced expression of HLF as well as weakened expression of SATB2 and NPAS2 in the low-risk group (Figure 3(c)). Additionally, the high risk score presented more undesirable survival outcomes (Figure 3(d)). ROC curves confirmed the favorable predictive potency of the TF genomic model in lung cancer outcomes (AUC = 0.619; Figure 3(e)).
3.5. Analyses and Verification of the TF Genomic Model as an Independent Prognostic Indicator of Lung Cancer
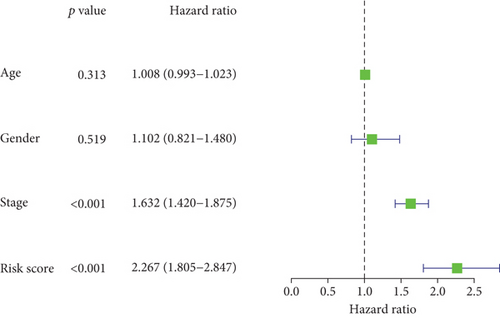
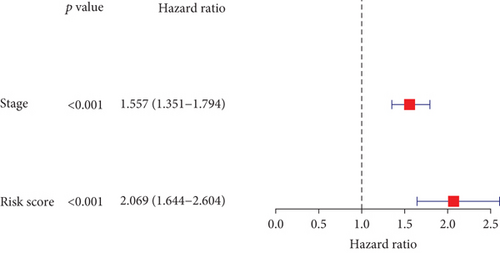
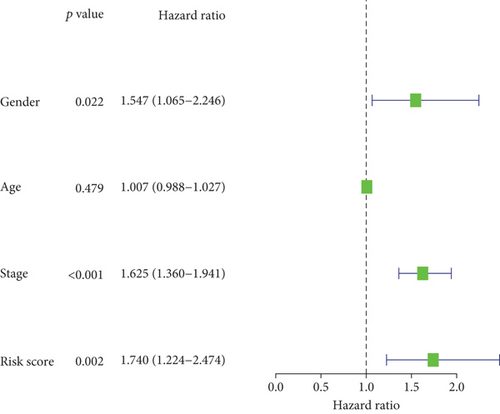
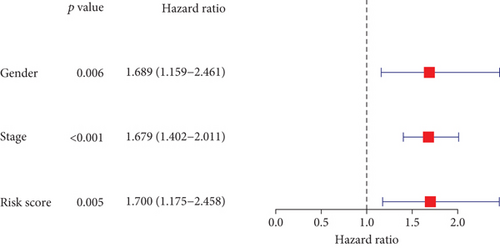
In the TCGA cohort, uni- and multivariate Cox regression models were presented for investigation of the interaction of conventional clinicopathological indicators and risk score with lung cancer outcomes. As a result, staging as well as risk score was independently predictive of patients’ prognosis (Figures 4(a) and 4(b)). The predictive independency was externally verified in the GSE72094 cohort. Our data confirmed that gender and staging as well as risk score were independent risk factors of lung cancer outcomes (Figures 4(c) and 4(d)).
3.6. Analyses of the TF Genomic Model Associated with Activation of Signaling Pathways
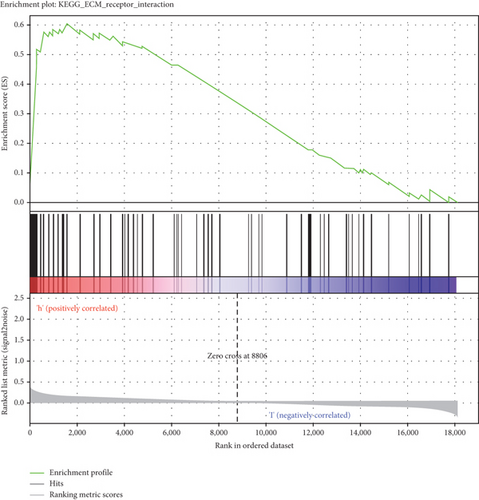
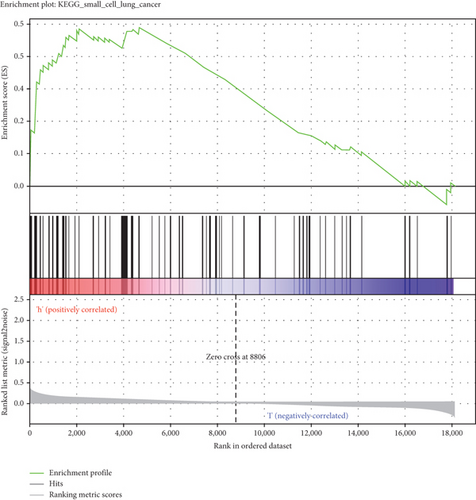
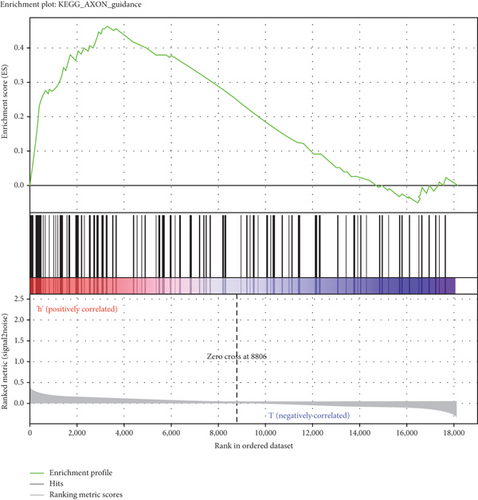
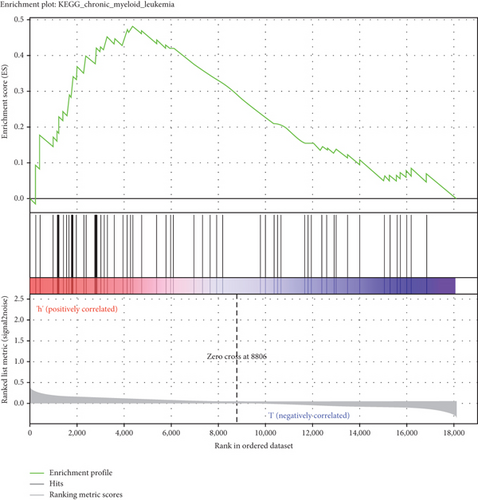
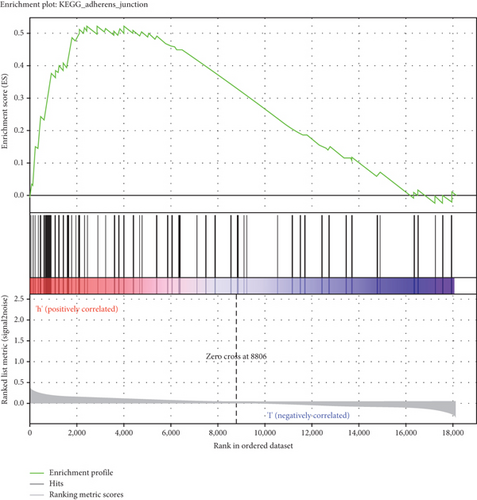
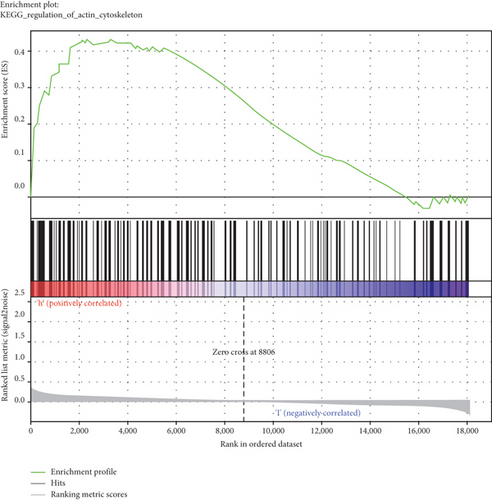
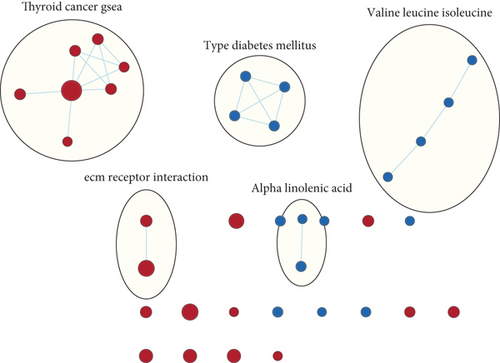
GSEA was conducted for investigating the activated signaling pathways correlated to the TF genomic model. In accordance with FDR < 0.05, ECM receptor interaction, small cell lung cancer, axon guidance, chronic myeloid leukemia, and adherens junction as well as regulation of actin cytoskeleton were remarkably activated in high-risk specimens (Figures 5(a)–5(f)). Additionally, clusters of relevant genes linked to the high risk score were determined, containing genes relating to thyroid cancer, type diabetes mellitus, valine leucine isoleucine, and ECM receptor interaction as well as alpha linolenic acid (Figure 6).
3.7. Determination of Downstream Targets of TFs: SATB2, HLF, and NPAS2
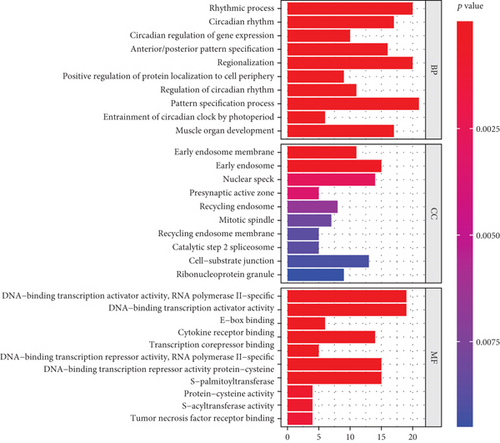
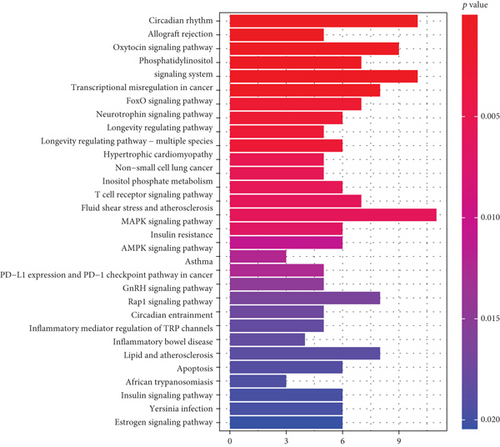
Through integration analyses of the ChEA, JASPAR, and MotifMap databases, we determined 307 downstream targets of HLF, 4 downstream targets (CRY2, PER1, PER2, and CRY1) of NPAS2, and 2 downstream targets (UPF3B and TP63) of SATB2 (Supplementary table 4). GO enrichment analyses uncovered that the rhythmic process was remarkably enriched by downstream targets (Figure 7(a); Table 2). Additionally, we noted that the above downstream targets presented remarkable interactions with circadian rhythm and immune activation pathways (like allograft rejection, T cell receptor signaling pathway, PD-L1 expression and PD-1 checkpoint pathway in cancer, inflammatory mediator regulation of TRP channels, and inflammatory bowel disease) as well as carcinogenic pathways (like transcriptional misregulation in cancer, FoxO signaling pathway, non-small cell lung cancer, MAPK signaling pathway, AMPK signaling pathway, Rap1 signaling pathway, and apoptosis; Figure 7(b) and Table 3).
| Description | Gene ratio | BgRatio | p value | FDR | q value | Count |
|---|---|---|---|---|---|---|
| Rhythmic process | 20/277 | 294/18862 | 1.48E-08 | 3.08E-05 | 2.45E-05 | 20 |
| Circadian rhythm | 17/277 | 212/18862 | 1.67E-08 | 3.08E-05 | 2.45E-05 | 17 |
| Circadian regulation of gene expression | 10/277 | 67/18862 | 4.71E-08 | 5.21E-05 | 4.14E-05 | 10 |
| Anterior/posterior pattern specification | 16/277 | 203/18862 | 5.64E-08 | 5.21E-05 | 4.14E-05 | 16 |
| Regionalization | 20/277 | 326/18862 | 8.22E-08 | 6.07E-05 | 4.83E-05 | 20 |
| Positive regulation of protein localization to cell periphery | 9/277 | 67/18862 | 5.67E-07 | 0.000349 | 0.000277 | 9 |
| Regulation of circadian rhythm | 11/277 | 118/18862 | 1.34E-06 | 0.000665 | 0.000529 | 11 |
| Pattern specification process | 21/277 | 426/18862 | 1.44E-06 | 0.000665 | 0.000529 | 21 |
| Entrainment of circadian clock by photoperiod | 6/277 | 29/18862 | 3.40E-06 | 0.001394 | 0.001108 | 6 |
| Muscle organ development | 17/277 | 317/18862 | 4.90E-06 | 0.001716 | 0.001365 | 17 |
| Early endosome membrane | 11/283 | 162/19520 | 2.53E-05 | 0.008847 | 0.008168 | 11 |
| Early endosome | 15/283 | 378/19520 | 0.00044 | 0.076941 | 0.07104 | 15 |
| Nuclear speck | 14/283 | 411/19520 | 0.002834 | 0.255165 | 0.235596 | 14 |
| Presynaptic active zone | 5/283 | 70/19520 | 0.003472 | 0.255165 | 0.235596 | 5 |
| Recycling endosome | 8/283 | 190/19520 | 0.006657 | 0.255165 | 0.235596 | 8 |
| Mitotic spindle | 7/283 | 157/19520 | 0.008067 | 0.255165 | 0.235596 | 7 |
| Recycling endosome membrane | 5/283 | 87/19520 | 0.008695 | 0.255165 | 0.235596 | 5 |
| Catalytic step 2 spliceosome | 5/283 | 87/19520 | 0.008695 | 0.255165 | 0.235596 | 5 |
| Cell-substrate junction | 13/283 | 423/19520 | 0.009108 | 0.255165 | 0.235596 | 13 |
| Ribonucleoprotein granule | 9/283 | 244/19520 | 0.009482 | 0.255165 | 0.235596 | 9 |
| DNA-binding transcription activator activity, RNA polymerase II-specific | 19/285 | 443/18337 | 6.93E-05 | 0.008115 | 0.007448 | 19 |
| DNA-binding transcription activator activity | 19/285 | 447/18337 | 7.80E-05 | 0.008115 | 0.007448 | 19 |
| E-box binding | 6/285 | 47/18337 | 8.41E-05 | 0.008115 | 0.007448 | 6 |
| Cytokine receptor binding | 14/285 | 270/18337 | 8.94E-05 | 0.008115 | 0.007448 | 14 |
| Transcription corepressor binding | 5/285 | 30/18337 | 9.07E-05 | 0.008115 | 0.007448 | 5 |
| DNA-binding transcription repressor activity, RNA polymerase II-specific | 15/285 | 307/18337 | 9.81E-05 | 0.008115 | 0.007448 | 15 |
| DNA-binding transcription repressor activity | 15/285 | 309/18337 | 0.000105 | 0.008115 | 0.007448 | 15 |
| Protein-cysteine S-palmitoyltransferase activity | 4/285 | 28/18337 | 0.000872 | 0.052206 | 0.047919 | 4 |
| Protein-cysteine S-acyltransferase activity | 4/285 | 28/18337 | 0.000872 | 0.052206 | 0.047919 | 4 |
| Tumor necrosis factor receptor binding | 4/285 | 31/18337 | 0.001292 | 0.069613 | 0.063896 | 4 |
| Description | Gene ratio | BgRatio | p value | FDR | q value | Count |
|---|---|---|---|---|---|---|
| Circadian rhythm | 10/126 | 31/8101 | 1.94E-11 | 4.71E-09 | 3.93E-09 | 10 |
| Allograft rejection | 5/126 | 38/8101 | 0.00028 | 0.033838 | 0.028259 | 5 |
| Oxytocin signaling pathway | 9/126 | 154/8101 | 0.000636 | 0.038062 | 0.031787 | 9 |
| Phosphatidylinositol signaling system | 7/126 | 97/8101 | 0.000751 | 0.038062 | 0.031787 | 7 |
| Transcriptional misregulation in cancer | 10/126 | 192/8101 | 0.000786 | 0.038062 | 0.031787 | 10 |
| FoxO signaling pathway | 8/126 | 131/8101 | 0.000959 | 0.038685 | 0.032308 | 8 |
| Neurotrophin signaling pathway | 7/126 | 119/8101 | 0.002472 | 0.065225 | 0.054472 | 7 |
| Longevity regulating pathway | 6/126 | 89/8101 | 0.002547 | 0.065225 | 0.054472 | 6 |
| Longevity regulating pathway—multiple species | 5/126 | 62/8101 | 0.002679 | 0.065225 | 0.054472 | 5 |
| Hypertrophic cardiomyopathy | 6/126 | 90/8101 | 0.002695 | 0.065225 | 0.054472 | 6 |
| Non-small cell lung cancer | 5/126 | 72/8101 | 0.005121 | 0.095997 | 0.080171 | 5 |
| Inositol phosphate metabolism | 5/126 | 73/8101 | 0.005431 | 0.095997 | 0.080171 | 5 |
| T cell receptor signaling pathway | 6/126 | 104/8101 | 0.00551 | 0.095997 | 0.080171 | 6 |
| Fluid shear stress and atherosclerosis | 7/126 | 139/8101 | 0.005836 | 0.095997 | 0.080171 | 7 |
| MAPK signaling pathway | 11/126 | 294/8101 | 0.00595 | 0.095997 | 0.080171 | 11 |
| Insulin resistance | 6/126 | 108/8101 | 0.006608 | 0.099953 | 0.083476 | 6 |
| AMPK signaling pathway | 6/126 | 120/8101 | 0.010857 | 0.154556 | 0.129077 | 6 |
| Asthma | 3/126 | 31/8101 | 0.012022 | 0.157127 | 0.131224 | 3 |
| PD-L1 expression and PD-1 checkpoint pathway in cancer | 5/126 | 89/8101 | 0.012336 | 0.157127 | 0.131224 | 5 |
| GnRH signaling pathway | 5/126 | 93/8101 | 0.01471 | 0.164644 | 0.137502 | 5 |
| Rap1 signaling pathway | 8/126 | 210/8101 | 0.016473 | 0.164644 | 0.137502 | 8 |
| Circadian entrainment | 5/126 | 97/8101 | 0.017373 | 0.164644 | 0.137502 | 5 |
| Inflammatory mediator regulation of TRP channels | 5/126 | 98/8101 | 0.018086 | 0.164644 | 0.137502 | 5 |
| Inflammatory bowel disease | 4/126 | 65/8101 | 0.018212 | 0.164644 | 0.137502 | 4 |
| Lipid and atherosclerosis | 8/126 | 215/8101 | 0.018715 | 0.164644 | 0.137502 | 8 |
| Apoptosis | 6/126 | 136/8101 | 0.019138 | 0.164644 | 0.137502 | 6 |
| African trypanosomiasis | 3/126 | 37/8101 | 0.019429 | 0.164644 | 0.137502 | 3 |
| Insulin signaling pathway | 6/126 | 137/8101 | 0.019767 | 0.164644 | 0.137502 | 6 |
| Yersinia infection | 6/126 | 137/8101 | 0.019767 | 0.164644 | 0.137502 | 6 |
| Estrogen signaling pathway | 6/126 | 138/8101 | 0.02041 | 0.164644 | 0.137502 | 6 |
4. Discussion
High-throughput sequencing technologies may assist in determining more biomarkers that present close interactions with patients’ outcomes at the genetic levels. Herein, we proposed a 3-TF genomic model linked to lung cancer progression through conducting reliable bioinformatic analyses. Additionally, the 3-TF genomic model acted as an independent molecular marker for prediction of lung cancer patients’ survival outcomes. Our findings might be of great significance to elucidate the underlying biological mechanisms of lung carcinogenesis as well as to develop innovative prognostic indicators and molecular therapeutic targets.
Previously, a 7-TF gene model has been established for prediction of colon adenocarcinoma outcomes [28]. A 9-TF signature can be predictive of breast cancer recurrence for optimizing clinical management [29]. Additionally, Yang et al. proposed a TF-based prognostic signature that reliably predicts endometrial cancer individuals’ survival outcomes [30]. Here, through univariate analyses followed by stepwise multivariate Cox regression analyses, we developed a TF genomic model for lung cancer outcomes. In accordance with the formula, a TF genomic model was conducted, containing SATB2, HLF, and NPAS2. ROC curves confirmed the reliability of this model in prediction of patients’ prognosis. Following integration of clinicopathological indicators, the model was independently predictive of clinical prognosis. To our knowledge, the 3-TF genomic model’s potential as a predictor has not been proposed in previous evidences, though research might offer a novel guide of lung cancer outcomes. In routine clinical practice, pathological staging acts as an important survival determinant concerning oncologists as well as lung cancer individuals. Nevertheless, diverse patients’ survival outcomes with the same staging are indicative of the deficient pathological staging system for prognosis on the basis of the anatomic scope and staging system of the disease, in which pathological changes reflect the biological heterogeneity within lung cancer. The issues influence the predictive potency of the conventional system for lung cancer individuals. Our GSEA uncovered that the 7-TF genomic model presented remarkable interactions with ECM receptor interaction, SCLC, axon guidance, chronic myeloid leukemia, and adherens junction as well as regulation of actin cytoskeleton, indicative of the interactions of the 7-TF genomic model with lung carcinogenesis.
Previous evidences suggest the biological significance of SATB2, HLF, and NPAS2 within the TF-based genomic model in lung carcinogenesis. For instance, SATB2 reduces NSCLC invasiveness through modulation of EMT-relevant proteins as well as histone methylation of G9a [31]. Further, hypoxic tumor-derived exosomal miR-31-5p triggers LUAD metastases through negative modulation of SATB2-reversed EMT as well as activation of the MEK/ERK pathway [32]. Downregulated HLF facilitates multiple-organ distant metastases of NSCLC via the PPAR/NF-κb pathway NSCLC [33]. Reduced HLF expression is predictive of undesirable clinical outcomes of LUAD [34]. NPAS2 polymorphism independently predicts NSCLC patients’ prognosis [35]. Further analyses determined the downstream targets of TFs: SATB2, HLF, and NPAS2. Our further biological function analyses demonstrated the interactions of these downstream targets with circadian rhythm and immune activation pathways (like allograft rejection, T cell receptor signaling pathway, PD-L1 expression and PD-1 checkpoint pathway in cancer, inflammatory mediator regulation of TRP channels, and inflammatory bowel disease) and carcinogenic pathways (like transcriptional misregulation in cancer, FoxO signaling pathway, NSCLC, MAPK signaling pathway, AMPK signaling pathway, Rap1 signaling pathway, and apoptosis), indicating that SATB2, HLF, and NPAS2 modulated the above pathways to participate in lung carcinogenesis.
Nevertheless, a few limitations of this study need to be pointed out. Our findings were primarily on the basis of integrated bioinformatic analyses. However, sufficient experimental verification of our results remains lacking. In future studies, we will conduct in-depth in vitro and in vivo experiments to verify our conclusion. Because all patients were retrospectively harvested, the underlying bias linked to unbalanced clinicopathological characteristics cannot be ignored. Additionally, the reliability of the 3-TF genomic model for predicting survival outcomes of lung cancer individuals remains a key issue in the clinic. In particular, the guideline for the clinical application of our 3-TF genomic model requires an in-depth definition in our future studies.
5. Conclusion
Collectively, our findings proposed and verified a 3-TF genomic model (SATB2, HLF, and NPAS2) for prediction of lung cancer outcomes. This genomic model acted as an independent indicator as well as a complement prognostic factor for clinicopathological features of lung cancer.
Abbreviations
-
- SCLC:
-
- Small cell lung cancer
-
- NSCLC:
-
- Non-small cell lung cancer
-
- LUAD:
-
- Lung adenocarcinoma
-
- LUSC:
-
- Lung squamous cell carcinoma
-
- TFs:
-
- Transcription factors
-
- TCGA:
-
- The Cancer Genome Atlas
-
- FPKM:
-
- Fragments per kilobase million
-
- TPM:
-
- Transcripts per million
-
- GEO:
-
- Gene Expression Omnibus
-
- FC:
-
- Fold-change
-
- ROC:
-
- Receiver operator characteristic
-
- GESA:
-
- Gene set enrichment analyses
-
- MSigDB:
-
- Molecular Signatures Database
-
- FDR:
-
- False discovery rate
-
- ChEA:
-
- ChIP enrichment analysis
-
- GO:
-
- Gene Ontology
-
- KEGG:
-
- Kyoto Encyclopedia of Genes and Genomes
-
- BP:
-
- Biological process
-
- MF:
-
- Molecular function
-
- CC:
-
- Cellular component.
Conflicts of Interest
The authors declare no conflicts of interest.
Open Research
Data Availability
The data used to support the findings of this study are included within the supplementary information files.


