Reduced mesophyll conductance under chronic O3 exposure in poplar reflects thicker cell walls and increased subcellular diffusion pathway lengths according to the anatomical model
Abstract
Ozone (O3) is one of the most harmful and widespread air pollutants, affecting crop yield and plant health worldwide. There is evidence that O3 reduces the major limiting factor of photosynthesis, namely CO2 mesophyll conductance (gm), but there is little quantitative information of O3-caused changes in key leaf anatomical traits and their impact on gm. We exposed two O3-responsive clones of the economically important tree species Populus × canadensis Moench to 120 ppb O3 for 21 days. An anatomical diffusion model within the leaf was used to analyse the entire CO2 diffusion pathway from substomatal cavities to carboxylation sites and determine the importance of each structural and subcellular component as a limiting factor. gm decreased substantially under O3 and was found to be the most important limitation of photosynthesis. This decrease was mostly driven by an increased cell wall thickness and length of subcellular diffusion pathway caused by altered interchloroplast spacing and chloroplast positioning. By contrast, the prominent leaf integrative trait leaf dry mass per area was neither affected nor related to gm under O3. The observed relationship between gm and anatomy, however, was clone-dependent, suggesting that mechanisms regulating gm may differ considerably between closely related plant lines. Our results confirm the need for further studies on factors constraining gm under stress conditions.
1 INTRODUCTION
Tropospheric ozone (O3) is considered the most harmful secondary air pollutant to vegetation at present time (Ainsworth et al., 2012; Ainsworth, 2017; Cailleret et al., 2018). Elevated O3 concentrations cause tree biomass to decrease by up to 11% (Emberson, 2020; Wittig et al., 2009). Furthermore, as the frequency of heatwaves and the emission of O3 precursors continues to increase (Meehl et al., 2018), episodes of exposure to elevated O3 levels are ever-more likely to occur in the future (Paoletti et al., 2019; Schaub et al., 2018). Further knowledge of the effects of elevated O3 on key traits of photosynthesis is, therefore, required to predict realistically its impacts on vegetation. Elevated O3 has been shown to affect negatively all three key determinants of photosynthesis, stomatal and mesophyll conductance to CO2 (gsc, gm), as well as the maximum carboxylation rate of Rubisco (Vcmax) (Flowers et al., 2007; Wittig et al., 2007). Specifically, O3 causes stomatal closure or sluggishness and thus impedes plant ability to control gas exchange (Paoletti & Grulke, 2010). O3 affects the biochemical capacity by downregulating the amount of Rubisco and its carboxylation rate (Bussotti et al., 2011; Heath, 2008). These two O3 effects were studied comprehensively by Morales et al. (2021) and Bagard et al. (2015), while the importance of gm within photosynthesis limitation under chronic O3 has been demonstrated only recently (Joffe et al., 2022; Xu et al., 2019). Elevated O3 was shown to reduce gm by up to 72%. Thus, gm appears to be the most limiting factor for Anet, yet the underlying mechanisms remain poorly understood. Hence, a deeper knowledge of mechanisms responsible for gm response to elevated O3 is of great interest (Han et al., 2018a, Lei et al., 2021; Lundgren & Fleming, 2020; Ren et al., 2019). O3 is known to alter leaf mesophyll anatomy at cellular and subcellular level, yet modifications are species and condition dependent (Hoshika et al., 2022; Paoletti et al., 2009; Shang et al., 2020; Vollenweider et al., 2019). Most notably, increases in cell wall and leaf thickness, density and leaf dry mass per area (LMA) have been observed and often considered to be associated with the response to reactive oxidative species (Günthardt-Goerg, 1996; Oksanen et al., 2001). Furthermore, a decrease in chloroplast size and number, their deformation and shrinkage, a swelling and/or curling of thylakoids and an increase of the stromal density were observed (Giacomo et al., 2010; Günthardt-Goerg and Vollenweider, 2007; Oksanen et al., 2001; Turc et al., 2023). Upon O3 exposure, a negative proportional relationship between gm and LMA was shown in poplar, suggesting a structural/anatomical control of gm under elevated O3 (Joffe et al., 2022). However, few analyses of leaf ultrastructure altered by O3 currently support this hypothesis.
Mesophyll conductance is a multicomponent trait consisting of a gas-phase conductance (gias) which comprises the CO2 diffusion pathway from substomatal cavities to the cell wall, and a liquid-phase conductance (gliq) comprising diffusion from the outer cell wall surface to the site of carboxylation within the chloroplast stroma (Evans et al., 2009). It has been recently suggested that gias might have a greater impact on gm using a 3D imaging method for complex leaf structures (Earles et al., 2018; Harwood et al., 2021). Nevertheless, gliq is also a limiting factor of gm, since CO2 diffuses substantially more slowly in liquid than in gas phase (Evans et al., 1994; Terashima et al., 2006). Previously, a one-dimensional leaf diffusion model quantifying the limitation of the respective anatomical gm component has been applied to various species and stress conditions (Tosens et al., 2012a, 2012b; Tomás et al., 2013; Tosens & Laanisto, 2018), emphasising the role of gliq and its key components Tcw and Sc/S (see definition of symbols in Table 1). However, it was also observed that stromal chloroplast limitation (Lchl) can be more important in species with thin cell walls (Han et al., 2018a; Lei et al., 2022; Liu et al., 2021; Peguero-Pina et al., 2017; Tosens et al., 2012a, 2012b). Moreover, the importance of interchloroplastic spacing in cotton submitted to short-and long-term drought stress was pointed out recently (Zou et al., 2022). This suggests that additional components of the subcellular CO2 diffusion pathway might play a crucial role in gm limitation. However, this aspect has not been examined extensively so far.
| Anet | net assimilation rate |
| Cc | CO2 partial pressure in the chloroplast |
| Ci | intercellular CO2 partial pressure |
| Ci–Cc | CO2 drawdown from the intercellular airspace to chloroplasts |
| Dleaf | leaf density |
| fias | fraction of mesophyll occupied by intercellular airspace |
| gs | stomatal conductance to water vapour |
| gsc | stomatal conductance to CO2 |
| gm | mesophyll diffusion conductance to CO2 |
| gm_Anat | mesophyll diffusion conductance modelled with anatomical traits |
| gias | gas phase conductance |
| gliq | liquid phase conductance |
| gcel1 | partial liquid phase conductance of cell wall portions lined with chloroplasts |
| gcel2 | partial liquid phase conductance of cell wall portions lined without chloroplasts |
| gcw | cell wall conductance |
| gcyt | cytoplasm conductance |
| gstr | stroma conductance |
| gpl/env | plasma membrane and chloroplast envelope conductance |
| gtot | total conductance to CO2 between the leaf surface and carboxylation sites |
| IAS | intercellular airspace |
| J1000 | electron transport rate at 1000 μmol m−2 s−1 PPFD |
| Jmax | maximum electron transport rate |
| Lchl | chloroplast length |
| LMA | leaf dry mass per area |
| lb | photosynthetic limitation by biochemistry |
| lm | photosynthetic limitation by mesophyll |
| ls | photosynthetic limitation by stomatal conductance |
| ΔLcyt2 | interchloroplast distance |
| Sc/Sm | fraction of total exposed mesophyll area covered with chloroplasts |
| Sc/S | chloroplast surface area exposed to intercellular airspace per leaf area |
| Smes/S | mesophyll surface area exposed to intercellular airspace per leaf area |
| Tchl | chloroplast thickness |
| Tcw | cell wall thickness |
| Tcyt | cytoplasm thickness |
| Tleaf | leaf thickness |
| Tpal | palisade tissue thickness |
| Tspo | spongy tissue thickness |
| Vcmax | maximum carboxylation rate of the Rubisco enzyme |
The difficulty in incorporating gm into any photosynthesis model comes from the fact that it varies considerably across species and clones, responds differentially to environmental stress, and is thus difficult to generalise due to the complexity of its underlying traits. Therefore, to further understand gm, in-depth studies across species under non-stress conditions (Tosens et al., 2016; Veromann-Jürgenson et al., 2017) but also within species/clones under stress conditions are necessary. To date, combined investigations of gm with estimates from the Harley method and models based on anatomical traits under stress conditions remain scarce, as both methods are laborious and require a precise parametrization (Fini et al., 2016; Lu et al., 2019). An intraspecific plant sex comparison in poplar demonstrated that closely related clones can display very distinctive responses to salt stress and nutrient constraints in terms of leaf anatomical properties (Lu et al., 2019). In a recent study, it has been shown that the decrease in gm was associated with thicker cell walls and smaller chloroplast size under O3 in poplar (Xu et al., 2023). However, other components within the liquid phase and their contribution to gm limitation remain to be quantified. In particular, the relative contribution of interchloroplastic CO2 diffusion under stress is often considered negligible in literature.
Despite being slightly limited in predicting high values of gm (Tosens & Laanisto, 2018), the anatomical diffusion model offers an opportunity to further explore the mechanistic functioning of gm. This deviation is likely due to assumptions, e.g., regarding diffusion path length tortuosity and cell wall porosity, which remain to be empirically determined (Ellsworth et al., 2018; Evans, 2021; Fini et al., 2016). Here, we present a comprehensive quantitative analysis of the O3-induced anatomical modifications of the entire mesophyll CO2 diffusion pathway, using the anatomical diffusion model (Niinemets and Reichstein, 2003; Tomàs et al., 2013; Tosens et al., 2012b) to evaluate each of its components. Two O3-responsive clones of the widespread and economically important poplar hybrid Populus × canadensis Moench were exposed to elevated O3 continuously to determine (i) to what extent chronic O3 affects leaf anatomical traits in poplar; (ii) which variables are responsible for the reduction of gm under chronic O3; (iii) define the most limiting gm component from the whole anatomical diffusion model; and (iv) assess whether key anatomical variables differ between clones.
2 MATERIALS AND METHODS
2.1 Plant material and ozone exposure
Cuttings of two Populus × canadensis Moench clones (Populus deltoides × P. nigra) Robusta (RB) and Soligo (SL) were grown for 5 weeks in 10-L pots filled with commercial potting soil (Terreau Uni Alsa LFc, Gramoflor SPI Universel) mixed with a slow-release 13:13:13 N:P:K fertiliser (Nutricote T 100 Fertil) stacked on a 2 cm layer of clay pebbles. Photoperiod, relative humidity and temperature in eight environment-controlled growth chambers were set at 14 h (300 ± 30 µmol m−2 s−1, photosynthetic photon flux density [PPFD] at leaf height), 65 ± 5% and 23/18°C (day/night), respectively. In each chamber, growth conditions were recorded individually and verified to be similar throughout the study period. A total of 12 replicates of both clones were evenly distributed in the eight climate chambers. After a 7-day acclimation period, four chambers were exposed to charcoal-filtered air, whereas the other four were treated daily with O3 at 120 ± 5 ppb for 13 h per day for 21 days. An O3 generator produced O3 from pure O2 (OZ500; Fischer, Bonn, Germany and CMG3-3; Innovatec II) and an O3 analyser (O341M, Environment S.A.) continuously monitored the O3 concentration in the climate chambers. Plants were irrigated daily with tap water and rotated regularly to avoid any effect of chamber position. All measurements were carried out with five to six plants per treatment and per clone.
2.2 Gas exchange and chlorophyll fluorescence measurements
2.3 Estimation of leaf gas exchange characteristics
2.4 Quantitative limitation analysis of photosynthesis
2.5 Light and electron microscopy and anatomical measurements
Sample preparation for light microscopy and transmission electron microscopy (TEM) followed Tosens et al. (2012b). After the gas exchange measurements, two leaf discs with a diameter of 10.6 mm were taken from that same leaf from each replicate, avoiding large veins. The discs were then infiltrated in a fixation buffer (2% glutaric aldehyde in 0.1 M phosphate buffer, pH = 7.1) in a syringe under vacuum and post-fixed in a 2% osmium tetroxide solution for 2 h. Subsequently, stripes of leaves of ~5 × 2 mm were cut from the leaf discs and dehydrated in a series of increasingly stronger ethanol solution and embedded in LR white resin (Electron Microscopy Sciences) according to standard procedure (Tosens et al., 2012b). An ultramicrotome (Leica EM UC7, Leica) was used to prepare semi-thin leaf cross-sections of 1 μm for light microscopy, and ultra-thin cross sections of 70 nm for TEM. The sections for light microscopy were stained with toluidine blue (Sigma Aldrich), while the sections for TEM were mounted on carbon-covered copper meshes and stained with uranyl acetate and lead citrate (Electron Microscopy Sciences). The semi-thin sections were viewed in bright field and photographed at ×100 magnification with an EVOS cell imaging system (Thermo Fisher Scientific). The ultra-thin sections were viewed and photographed with a Philips Tecnai 10 TEM (FEI) using an accelerating voltage of 80 kV. Images were analysed with ImageJ software (US National Institutes of Health, Bethesda, MD, USA).
2.6 Mesophyll conductance modelled based on anatomical characteristics
2.7 Quantitative analysis of partial limitations of gm
2.8 Statistical analyses
All statistical analyses were performed in R (R Core Team, 2018). A two-way analysis of variance (ANOVA) was run using the emmeans (Lenth et al., 2018) and rstatix (Alboukadel Kassambara, 2019) packages, with clone and treatment as factors to test their effects on different characteristics. The ANOVA assumptions of homoscedasticity and normality were checked by performing a Levene's test and Shapiro test, respectively. The data were log-transformed when requirements were not fulfilled. If a significant effect was observed, a post hoc analysis was performed using Tukey's multiple pairwise comparison test using the glht function of the multcomp package (Hothorn et al., 2009). The statistical relationships between clones and treatments were explored by linear and non-linear regression analyses, depending on which model provided a better fit. For each relationship, the coefficient of determination, the Pearson correlation coefficient and the respective p values were obtained using the ggscatter function of the ggpubr package (Alboukadel Kassambara, 2016) and Microsoft Office Excel, 2019. A principal component analysis (PCA) was used to identify the major axes of variation among the major leaf integrative and anatomical traits associated with gm, Anet and gsc. The R functions prcomp (stats package) and ggbiplot (ggplot2 package) were used to perform and visualise the PCA. The data were grouped by clone and treatment and the different measurement units of the several variables considered were scaled using the ‘R scale = TRUE’ setting within the prcomp function. The first two dimensions were retained for further analysis (for Eigenvalues and component loadings see Table S2).
3 RESULTS
3.1 Strong decrease of mesophyll conductance and assimilation rate and while stomatal conductance and Vcmax remained unaffected under elevated O3
Net assimilation rate (Anet) was 18% higher in the hybrid poplar clone Robusta (RB) than in the clone Soligo (SL) regardless of O3 treatment (Figure 1a). Stomatal (gsc, Figure 1b) and mesophyll (gm Figure 1c) conductances to CO2 were similar among clones, but the CO2 concentration at the carboxylation sites in the chloroplast (Cc, Figure 1d), maximum carboxylase activity of Rubisco (Vcmax(Cc), Figure 1e) and the capacity for photosynthetic electron transport rate (J1000(Cc), Figure 1f) were greater in RB than those in SL (18% for Cc, 26% for Vcmax(Cc) and 41% for J1000(Cc)).

Upon O3 exposure, Anet showed a similar decrease in both clones, 21% in RB and 22% in SL (Figure 1a). gsc was not affected by O3 (Figure 1b), but O3 exposure caused a substantial decrease in gm in both clones, by 57% in RB and 62% in SL (Figure 1c). Cc decreased in both clones, by 20% in RB, and even more, by 33% in SL (Figure 1d). Neither Vcmax (Cc) nor J1000(Cc) were affected by O3 in both clones (Figure 1e,f). While intercellular CO2 partial pressure (Ci) was unaffected by O3, the CO2 drawdown, Ci -Cc increased by 78% and 99% in RB and SL, respectively (Figures S2 and S3).
3.2 Mesophyll conductance was the most limiting factor for net assimilation rate under elevated O3
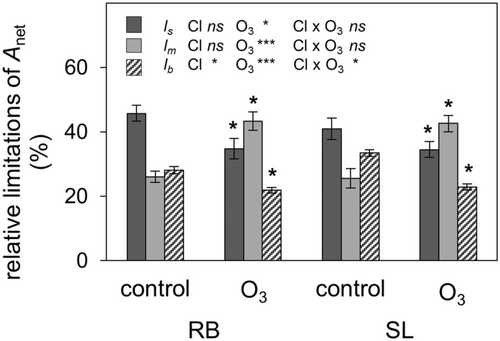
A quantitative Anet limitation analysis found that stomatal limitation of photosynthesis (ls) was the most important limitation in control plants with 43 ± 2.9%, while lm and lb accounted for 26 ± 2.4% and 31 ± 1.1% on average across both clones (Figure 2). In control plants, lb was higher in SL than RB, whereas ls and lm did not differ between SL and RB (Figure 2). Under elevated O3, ls and lb decreased to the same extent in both clones (20% and 27%, respectively), while lm increased by 66% on average in both clones, being the most important limitation of Anet in O3-stressed plants (Figure 2).
3.3 Leaf integrative traits showed pronounced intraspecific differences, but were mostly unaffected by O3
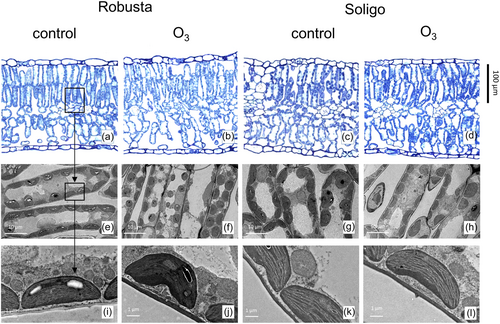
LMA was 16% higher in RB than in SL (Table 2). Leaf density (Dleaf) was in the same range for both clones (Table 2). Leaf and mesophyll thickness (Tleaf and Tmes) 14% and 15% higher, respectively, in RB compared to SL (Table 2 for quantitative differences, Figure 3a–d for microscopic images). Similarly, palisade and spongy thickness (Tpal and Tspo) was 16% and 13% thicker, respectively, in RB. However, the Tpal/Tspo ratio was significantly decreased under O3 in both genotypes, by 14% in RB and 12% in SL. The fraction of intercellular airspace (fias) was 24% higher in RB compared to SL, regardless of the O3 treatment. O3 affected Dleaf only in SL (+18%). LMA, Tleaf & Tmes, Tpal & Tspo and fias were not affected by O3.
| Genotype | Treatment | LMA (g m−2) | Dleaf (m2 s–1) | Tleaf (µm) | Tmeso (µm) | Tpal (µm) | Tspo (µm) | Tpal/Tspo | fias |
|---|---|---|---|---|---|---|---|---|---|
| RB | control | 57.2 ± 1.7a | 0.30 ± 0.01a | 187.9 ± 3.9ab | 165.4 ± 3.4ab | 84.6 ± 3.4a | 81.9 ± 3.9ab | 1.04 ± 0.05 | 0.18 ± 0.02ab |
| O3 | 57.3 ± 2.8a | 0.29 ± 0.02a | 197.0 ± 4.5a | 173.6 ± 4.4a | 80.3 ± 4.4ab | 89.7 ± 2.9a | 0.90 ± 0.03 | 0.21 ± 0.01a | |
| SL | control | 46.1 ± 2.4b | 0.27 ± 0.01a | 166.6 ± 5.6bc | 149.1 ± 5.6bc | 72.9 ± 5.6bc | 73.2 ± 4.3b | 1.01 ± 0.05 | 0.15 ± 0.01b |
| O3 | 50.3 ± 2.9ab | 0.32 ± 0.06b | 159.3 ± 8.0c | 142.6 ± 7.4c | 66.3 ± 7.4c | 75.3 ± 5.1ab | 0.89 ± 0.03 | 0.15 ± 0.01b | |
| Cl | *** | ns | * | ** | ** | ** | ns | * | |
| O3 | ns | ns | ns | ns | ns | ns | ** | ns | |
| ClxO3 | ns | * | ns | ns | ns | ns | ns | ns |
- Note: Leaf dry mass per unit area, LMA (g m−2); leaf density, Dleaf (g cm−3); leaf thickness, Tleaf (µm); mesophyll thickness, Tmes (µm); palisade, Tpal and spongy thickness, Tspo (µm); ratio of palisade to spongy thickness, Tpal/Tspo and fias, fraction of intercellular airspace (dimensionless) of two Populus canadensis clones Robusta (RB) and Soligo (SL) exposed to filtered air (control) or elevated O3 (O3). Data are means ± SE (n = 5). Statistical significance of ANOVA results as: ***p ≤ 0.001, **p ≤ 0.01, *p ≤ 0.05, ‘ns’ non-significant. Different letters denote significant differences between groups according to Tukey's post hoc tests.
- Abbreviation: ANOVA, analysis of variance.
3.4 Cell wall and cytoplasm thickness exhibited a clone-dependent increase, while Sc/S remained unaffected
Cell wall thickness (Tcw) was on average 24% thicker in RB while cytoplasm thickness (Tcyt) was almost identical for both clones (Table 3 and Figure 3i–l). Under O3, Tcw increased by a similar magnitude under elevated O3 in both clones, by 44% in RB and 41% in SL (Table 3 for quantitative differences, Figure 3e–h for microscopic images). In contrast, Tcyt showed a very different magnitude of increase in the two clones with a 77% increase in RB versus 44% in SL. Chloroplast length (Lchl) decreased by 17% in RB and 13% in SL, while chloroplast thickness (Tchl) was not affected by O3 (Table 3 and Figure 3e–h). This translated into an increase of the Tchl/Lchl ratio by 19% in RB and 14% in SL. The interchloroplast distance (ΔLcyt2) remained unaffected in SL, but it increased by 214% in RB. The mean number of chloroplasts per cell was not affected in none of the clones. Neither Sc/S nor Smes/S were affected by O3, whereas Sc/Smes decreased by 30% in RB, but did not change in SL (Table 3).
| Genotype | Treatment | Tcw (µm) | Tcyt (µm) | Tchl (µm) | Lchl (µm) | Tchl/Lchl | ΔLcyt2 (µm) | Nbchl | Sc/S | Smes/S | Sc/Smes |
|---|---|---|---|---|---|---|---|---|---|---|---|
| RB | control | 0.17 ± 0.01ab | 0.24 ± 0.05ab | 2.3 ± 0.28 | 4.6 ± 0.1 | 0.5 ± 0.02 | 0.27 ± 0.06a | 11 ± 0.4 | 14.6 ± 0.7 | 16.9 ± 1.3 | 0.88 ± 0.04c |
| O3 | 0.24 ± 0.03c | 0.43 ± 0.07c | 2.3 ± 0.14 | 3.9 ± 0.05 | 0.59 ± 0.01 | 0.86 ± 0.11b | 11 ± 0.4 | 12.1 ± 0.7 | 19.8 ± 0.9 | 0.61 ± 0.03a | |
| SL | control | 0.13 ± 0.02a | 0.24 ± 0.02a | 2.1 ± 0.31 | 4.6 ± 0.08 | 0.45 ± 0.02 | 0.53 ± 0.08ab | 11 ± 0.9 | 13.8 ± 0.9 | 17.2 ± 0.9 | 0.80 ± 0.02bc |
| O3 | 0.18 ± 0.04b | 0.34 ± 0.1c | 2.1 ± 0.31 | 4.0 ± 0.15 | 0.51 ± 0.03 | 0.68 ± 0.15ab | 10 ± 0.9 | 12.9 ± 1.3 | 17.6 ± 0.8 | 0.72 ± 0.05ab | |
| Cl | ** | ** | ns | ns | ** | ns | ns | ns | ns | ns | |
| O3 | *** | *** | ns | *** | *** | * | ns | ns | ns | ** | |
| ClxO3 | ns | ns | ns | ns | ns | ** | ns | ns | ns | * |
- Note: Cell wall thickness, Tcw (µm); cytoplasm thickness, Tcyt (µm); chloroplast length and thickness, Lchl and Tchl (µm); ratio of chloroplast length to thickness, Tchl/Lchl; interchloroplast distance, ΔLcyt2 (µm); number of chloroplasts per cell, Nbchl; chloroplast surface area exposed to intercellular airspace per leaf area, Sc/S; mesophyll surface area exposed to intercellular airspace per leaf area, Smes/S; fraction of total exposed mesophyll area covered by chloroplasts, Sc/Sm in two Populus canadensis clones Robusta (RB) and Soligo (SL) exposed to filtered air (control) or elevated O3 (O3). Data are means ± SE (n = 5). Statistical significance of ANOVA results as: ***p ≤ 0.001, **p ≤ 0.01, *p ≤ 0.05, ‘ns’ non-significant. Different letters denote significant differences between groups according to Tukey's post hoc tests.
- Abbreviation: ANOVA, analysis of variance.
3.5 Anet and gm depended more strongly on leaf anatomical traits in the clone Robusta
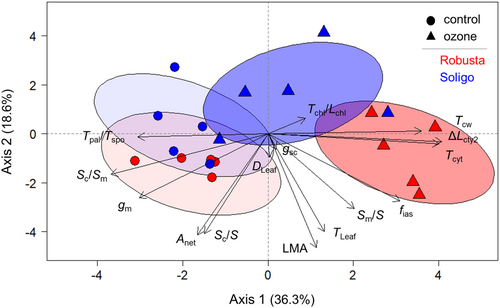
A PCA was performed to characterise the relationship of gas exchange characteristics with leaf integrative and anatomical traits in both clones and treatments. The first two principal components explained 54.9% of variation in data (Figure 4). Axis 1 explained 36.3% and was positively associated with Tcw, Tcyt and especially with ΔLcyt2, while a negative association was found for Sc/Sm and notably for Tpal/Tspo (Figure 4). Axis 2 explained 18.6% of the variation and was negatively associated with Sc/S, Anet, LMA and Tleaf (Figure 4). The traits Tchl/Lchl, gsc, and Dleaf did not contribute to any dimension while Smes/S and fias were associated with both dimensions. Thus, gm was positively associated to Anet, Sc/S and Sc/Sm, but negatively correlated to Tcw, Tcyt and ΔLcyt2 (Figure 4). No correlation was found between gm and Smes/S, Tleaf, LMA as well as fias. Axis 1 separated the two treatment groups, although those of SL were less clearly distinguished (Figure 4). Axis 2, in turn, tended to separate the two clones (Figure 4).
3.6 Importance of Sc/Sm, Tcw and Tcyt as drivers of gm response under elevated O3
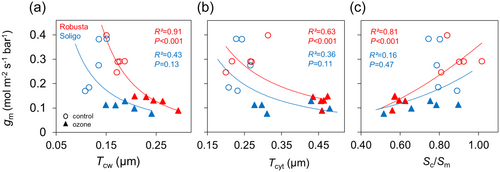
Tcw and Tcyt were strongly negatively related to gm in RB, while in SL these trends were also present yet non-significant (Figure 5a,b). Moreover, a large range of Tcw under O3 was observed in both clones (Figure 5a), whereas for Tcyt this was only the case in SL (Figure 5b). Interestingly, greater Tcw values in RB did not result in a lower gm under O3 exposure compared to SL with lower Tcw. A positive relationship was found between Sc/Sm and gm (Figure 5c). However, this relationship for all data pooled was significant only for RB (Figure 5c). SL showed a high variation in the control treatment, and a positive relationship was only present for O3-treated plants (Figure 5c).
3.7 Anatomical model of mesophyll conductance underestimates gm values under control conditions
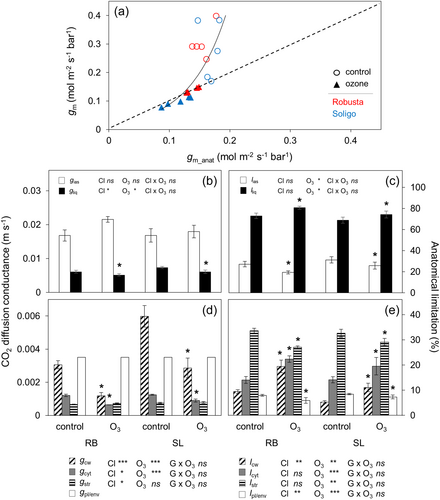
An anatomical model was applied to estimate diffusion conductance as driven by leaf anatomical traits (gm_Anat) and quantify the role of each component of the CO2 mesophyll pathway in limiting gm_Anat. The modelled and measured gm values were strongly correlated and were close to the 1:1 line (Figure 6a). However, the model underestimated gm values exceeding 0.2 mol mol−2 s−1 bar−1 by 51% and 40% in control of RB and SL, respectively (Figure 6a; Figure S4). There was a strong fit between gm and gm_Anat in the O3 treatment group of RB. However, estimates for SL were 41% higher for gm_Anat suggesting that potentially important variables remain uncaptured, which is also consistent with the PCA results (Figure 4).
3.8 Increased cell wall and cytoplasm thickness are the main drivers of liquid-phase limitation while gas-phase limitation remained unaffected under O3
The gas phase conductance (gias) was not affected by O3 nor by clone (Figure 6b). The liquid phase conductance (gliq) decreased by 26% in RB and 19% in SL in O3-exposed plants (Figure 6b). Moreover, gliq was 22% higher across both treatments in SL (Figure 6b). Gas phase limitation (lias) decreased by 28% on average while liquid phase limitation (lliq) increased by 11% on average under O3 (Figure 6c). Cell wall conductance (gcw) showed a strong decrease of 61% and 51% in RB and SL, respectively (Figure 6d). In addition, gcw was twofold higher in SL compared to RB in both treatments. Cytosol conductance (gcyt) decreased by 47% in RB and 28% in SL (Figure 6d). Stroma conductance (gstr) was not affected by O3, but it was on average 10% higher in SL (Figure 6d). Cell wall limitation (lcw) more than doubled by about 108% on average in both clones under O3, yet being 43% higher in RB than in SL across both treatments (Figure 6e). Cytosol limitation (lcyt) increased by 49% on average, whereas the share of gliq limited by the stroma (lstr) showed a mean decrease of 15% in both clones. Plasma membrane and chloroplast envelope limitation (lpl/env) decreased by 26% in RB but only by 13% in SL, leading to a 24% higher lpl/env in SL under O3 compared to RB (Figure 6e).
3.9 Considerable increase of cytosolic limitations under elevated O3
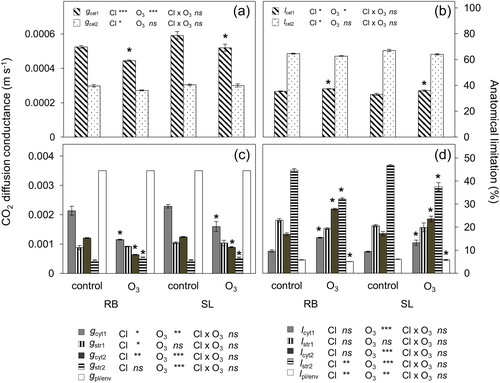
According to the quantitative anatomical model, the inner cell liquid path diffusion conductance was divided into the partial liquid phase conductance for exposed cell wall portions lined with chloroplasts (gcel1) and for cell wall portions without chloroplasts (gcel2). gcel1 decreased in both clones by 14% on average (Figure 7a). Yet, SL had on average a 15% higher gcel1 across both treatments. gcel2 remained unaffected by O3 but was on average 42% lower across treatments and clones compared to gcel1 (Figure 7a). The corresponding path limitation lcel1 increased by 7% on average while lcel2 remained unaffected (Figure 7b). Also, lcel2 was 82% higher than lcel1. Cytosolic conductance from the plasmalemma perpendicular to the cell wall (gcyt1) showed a decrease of 46% in RB and 30% in SL in O3-exposed plants (Figure 7c). Stromal conductance on the same path (gstr1) was unaffected by O3 but on average 16% higher in SL than in RB across both treatments (Figure 7c). Cytosolic conductance parallel and/or diagonal from the plasmalemma to the cell wall (gcyt2) decreased by 47% in RB and 28% in SL in response to O3, while the respective stromal conductance (gstr2) increased by 20% on average across both clones (Figure 7c). Cytosolic limitation perpendicular to the cell wall (lcyt1) increased by 52% on average, while the respective stromal limitation (lstr1) remained unaffected under O3 (Figure 7d). Cytosolic limitation parallel to the cell wall (lcyt2) increased by 52% on average under O3 with RB showing a 29% higher increase than SL. The respective stromal limitation (lst12) decreased by 23% on average yet being 8% lower in RB than in SL. The plasma membrane and chloroplast envelope limitations (lpl/env) decreased by 11% in RB and 5% in SL (Figure 7d).
4 DISCUSSION
4.1 Mesophyll conductance limits net assimilation rate the most under elevated O3
We analysed the response of key foliage photosynthetic traits to chronic O3 exposure and observed a decrease in gm, Cc and Anet (Figure 1a–f). However, stomatal conductance (gsc) and foliage biochemical photosynthesis potentials, Cc-based Vcmax and J1000, were not affected by O3 (Figure 1a–f), which is in accordance with our previous findings (Joffe et al., 2022). Thus, these data indicate that the reduction in Anet by O3 exposure was primarily driven by reductions in gm in our study. Estimation of gm from gas exchange and chlorophyll fluorescence is sensitive to parameters assumed in the model, in particular Г*, J and Rd for which literature reported methodological issues regarding their assessment (Farquhar & Busch, 2017; Gong et al., 2018; Tcherkez et al., 2017). However, it was previously reported that varying these parameters by ±10% did not conflict with our conclusions and confirmed the large impact of O3 on gm (Joffe et al., 2022). gm estimates are also sensitive to light capture properties of the leaf, including the leaf absorbance and (α) and the fraction of photons absorbed by PSII (β). Sensitivity analysis revealed that changing both factors could explain the differences of gm among clones, but not those observed between treatments (Table S3). This confirms again that the large decrease in gm under O3 is real and not due to differential leaf traits. Despite gsc not being affected by O3, it was much lower in SL under elevated O3 compared to RB (Figure 1b) suggesting a different magnitude of O3 uptake between the two clones (Dumont et al., 2014; Dusart et al., 2019). As PCA suggests, gsc was neither related to Anet and gm nor to any anatomical feature (Figure 4), so a direct relationship between O3 uptake and impaired CO2 assimilation was unlikely in this study. Nevertheless, a decoupling of photosynthetic activity and gsc under chronic O3 exposure has been observed in previous works (Hoshika et al., 2012; Lombardozzi et al., 2012). This can be due to the often observed O3-caused stomatal sluggishness affecting gsc response to CO2 in comparison to Anet or gm (Hoshika et al., 2018). A strong decrease of Anet and Cc, and gm, while Ci remained unaffected supports the explanation that reduction in photosynthetic activity was entirely due to non-stomatal factors (Fig. S2). This goes along with a significant shift from ls and lb towards lm under O3, underlining the relevance of gm but also suggesting a substantially different role of gsc and gm in regulating Anet under stress and non-stress conditions (Figure 2) (Harmens et al., 2017; Shang et al., 2020). Finally, this also suggests that the often-cited co-regulation between gs and gm can be altered (Flexas et al., 2008; Ma et al., 2021), especially under stress.
4.2 Chronic O3 exposure affects anatomical characteristics rather than leaf integrative traits
O3 had a different impact on the main integrative and anatomical leaf traits (Tables 2 and 3, Figure 4). O3-induced structural modifications have been shown to be species-, treatment- and leaf age-dependent (Ferdinand et al., 2000; Gao et al., 2016; Oksanen et al., 2001; PÄÄkkÖNEN et al., 1996; Xu et al., 2023). Yet, in our study, none of the leaf integrative traits except for the ratio of palisade to spongy tissue (Tpal/Tspo) and Dleaf were affected by chronically elevated O3. Moreover, only Tpal/Tspo was correlated to gm (Figure 4). A similar response has been observed in field-grown Populus tremuloides and Betula papyrifera (Oksanen et al., 2004). It was suggested that O3 particularly targets the palisade tissue due to the higher surface to volume ratio in comparison to spongy tissue. Thus, O3 damage might be earlier and stronger visible in the palisade tissue but eventually also in the spongy tissue as the O3 exposure continues (Giacomo et al., 2010). A higher Dleaf can be due to an increased proportion of cell wall material of non-photosynthetic tissue, the proportion of which can increase under O3 (Günthardt-Georg et al., 1997; Niinemets, 1999). At the same time, contrasting responses were observed during free-air O3 exposure experiments with an O3-induced increase of Dleaf and Tleaf remaining unaffected in Fagus crenata (Hoshika et al., 2020) while both traits decreased in Populus deltoids and Populus euamericana (Xu et al., 2023). Indeed, in our study Tleaf was not affected, while Dleaf increased, albeit only in SL. This emphasises a considerable species and clone-dependence of O3 effects on leaf structure (Pääkkönen et al., 1995). As for leaf integrative traits in general, the observed modifications of the key leaf structural trait LMA are also strongly treatment- and species-specific (Hoshika et al., 2020; PÄÄKKÖNEN et al., 1998; Poorter et al., 2009). Here we found LMA to be unaffected in both clones, which suggests that only a longer or/and more severe exposure to O3 or drought would have caused measurable modifications and thus an impact on LMA leading to a decrease of gm as previously observed (Hoshika et al., 2020; Joffe et al., 2022; Tosens et al. 2012a, 2012b; Xu et al., 2023). Moreover, this might also explain the lack of any robust relationship between integrative leaf traits and gm (Figure 4), which could have caused an O3-induced decrease of gm as observed by Hoshika et al. (2020). Therefore, in our experimental setting, leaf integrative traits LMA, Dleaf and Tleaf failed to explain gm response to chronic O3 (see Supplementary Note 1 for the discussion of the anatomical and cellular traits).
4.3 Discrepancy between observed and anatomy-based gm estimates at higher end of the range
An anatomical model (Equation 10) was used to quantify the anatomical CO2 diffusion pathway, aiming to determine the relative importance of the main anatomical traits limiting gm. Across a broad range of species the model has demonstrated strong predictive power within a range of 0.030–0.2 mol m−2 s−1 bar (Tomás et al., 2013; Tosens & Laanisto, 2018). However, it tends to underestimate gm values above the upper limit of this range (>0.2 mol m−2 s−1 bar). Such underestimations have been observed previously, e.g., when comparing multiple species (Peguero-Pina et al. 2012; Veromann Jürgenson, 2020; Xiong, 2023), across clones (Lei et al., 2022; Tomás et al., 2014), or when applying different treatments within a single species (Carriquí et al., 2019). Here we found gm_Anat to yield a good fit within the treatment group (Figure 6a), when considering cell wall porosity as a function of Tcw as suggested by Tosens et al. (2012a, 2012b), while control replicates did not respond anymore to porosity values being higher than 0.35. Regarding membrane permeability, a 1:1 relationship was only achieved when assuming unrealistic high values of gpl and gen as well as rf,i as also previously reported (Han et al., 2018; Tomás et al., 2013, 2014). Therefore, empirically determined values for membrane permeability seem to be indispensable to improve the anatomical model of gm, as also recently been pointed out (Evans, 2021). In addition, the anatomical model assumes passive diffusion through membranes, probably regulated by biochemical components such as aquaporins (or cooporins) (Evans et al., 2009). To date, conclusions regarding their role in regulating gm are still inconsistent (Cousins et al., 2020). Indeed, recent studies could not find a clear evidence for the often-referred aquaporin-gm relationship in this context (Flexas et al., 2018), but did also point out a still existing lack of understanding of the physiological role of aquaporins in CO2 transport facilitation (Clarke et al., 2022; Kromdijk et al., 2020). A final important point is the assumption of the anatomical model that Rubisco is evenly distributed in the chloroplast stroma, which seems rather unlikely. It is more likely that most of the Rubisco is located near the chloroplast envelope and at the side exposed to the cell wall. This would in turn increase gm_anat and thus yield a better agreement with measured gm, especially in the control group (Figure 6a).
4.4 An increased subcellular diffusion limitation due to altered chloroplast positioning and thicker cell walls lowers gm under elevated O3
Sc/S has been identified as another major determinant of gm (Evans, 1994; Lu et al., 2016; Tosens et al., 2012b, 2015), although it can be occasionally unrelated to gm (Hanba et al., 2004). Sc/S was not affected under O3 (Table 3), which is in accordance with recent studies looking at the response to O3 in Populus (Xu et al., 2023) and to drought in Helianthus annuus (Roig-Oliver et al., 2020). This is in contrast with previous studies in which different Populus cultivars were exposed to salt, light and water stress resulting in a decrease of Sc/S (Liu et al., 2021; Tosens et al., 2012b). We further observed a decrease in chloroplast length (Lchl) and total chloroplast surface length facing the intercellular airspace (Lc) which then lead to a decrease in Sc/Sm yet not in Sc/S (Figure 3 and Table 3). However, the observed decrease in Sc/Sm, while the number of chloroplasts per cell remained constant (Table 3), suggests that the distance between chloroplasts also increased, as confirmed by a greater ΔLcyt2 under O3 (Table 3). Hence, the consideration of the fraction of total exposed mesophyll area covered with chloroplasts or Sc/Sm in addition to Sc/S, might serve as a more comprehensive explanatory variable of gm. Also, the increase in Tcyt indicates that O3 not only reduced chloroplast exposition but also increased the distance to cell wall. In fact, low gm was strongly related to higher Tcyt and lower Sc/Sm (Figure 5b,c). It suggests not only that O3-induced lateral chloroplast shrinkage had a major negative impact on the cytosolic CO2 pathway (Figures 3 and 5b,c) but also, a genotype-dependent chloroplast migration towards the cell centre as a possible O3 protecting mechanism (Lei et al., 2022; Nauš et al., 2010). This is insofar important, as Xu et al. (2023) observed no change in Sc/S either but a decreased ΔLcyt2 being also accompanied by a reduced number of chloroplasts after long-term O3 exposure. Collectively, it indicates that observed gm decrease is due to a change in chloroplast positioning, size and/or numbers (see Supplementary Note S2 for the discussion of the quantitative limitation analysis of gas and liquid-phase gm components).
4.5 gm—Anatomy relationship is clone-dependent in poplar
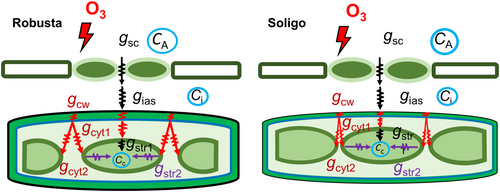
Despite having more favourable leaf integrative (thinner tissues) and anatomical traits (shorter pathway lengths) which might actually have suggested a higher gm (Figure 8) (Nadal et al., 2018; Niinemets, 1999), gm values of SL were not different to those of RB, regardless the estimation method used (Figure 1c; Figure S3). These results contrast to those of Xu et al. (2023), who found that the clone with shorter pathways also yielded a higher gm, though this effect vanished during the applied long-term O3 treatment. Moreover, a relationship between leaf anatomy and gm was nearly absent in SL, while except for Smes/S, all main variables correlated with gm in RB (Figure 4). A similar (apparent) decoupling of leaf anatomical traits and gm was observed between several Vitis vinifera cultivars under different levels of drought stress (Tomás et al., 2014) and wild and domesticated cotton (Lei et al., 2022). The latter also reported that thicker cell walls in the wild type did not alter gm as there might have been possible offsetting effects between the also highly limiting but at the same time lower Tcw and Tcyt in the domesticated clones. In contrast, both Tcyt and Tcw increased in both of our clones but as a response to stress rather than due to breeding, with Tcw being higher in RB under O3 (Table 3). Yet, it was observed that chloroplasts can move to optimise or reduce exposure to low or high light (Jeong et al., 2002; Loreto et al., 2009; Tholen et al., 2008). Hence, the fact that the above described higher ΔLcyt2 as a function of a lower Sc/Sm (data not shown) was only significant in RB, suggests partly preserved chloroplast integrity and functioning in this clone, offsetting the otherwise less favourable anatomical traits with regard to gm compared to SL. A recent O3 sensitivity study in poplar concluded that a more comprehensive analysis of several variables is necessary when assessing stress response in closely related clones, as the observed differences of leaf traits are not as large as within interspecies comparisons (Shang et al., 2020). In this regard, recent literature has identified cell wall composition as a key variable, which can affect both porosity and tortuosity and thus gm (Flexas et al., 2021). Therefore, different properties and stress-induced changes of cell wall components, as recently found among different tomato clones (Roig-Oliver et al., 2022), could also be involved in the different gm-anatomy relationships between clones.
5 CONCLUSIONS
A detailed analysis of the CO2 diffusion pathway from substomatal cavities to chloroplasts of two Populus × canadensis Moench clones Robusta and Soligo using a comprehensive leaf anatomical diffusion model revealed that increased Tcw, Tcyt and Lcyt2 were the main limiting factors responsible for the reduction of gm under elevated O3. Leaf integrative traits were not related to gm and, therefore, not sufficient to predict its response to O3. Despite significant differences in key anatomical traits of Robusta and Soligo, their gm value was similar under elevated O3. Usually, gm scales with Anet which in turn reflects scaling of Sc/S with Anet. Although Anet differed between clones, Sc/S did not, indicating that scaling with photosynthetic capacity was partially lost in Soligo. This, together with a lack of association between anatomy and gm in Soligo suggest a hitherto underestimated role of cell wall biochemical composition as well as biochemical controls of gm, e.g., membrane permeability, CO2-HCO3− equilibrium and liquid diffusivity. These results help the fundamental understanding of the limiting factors for canopy carbon gain under chronic O3 stress. They also highlight that different mechanisms may be involved despite similar gm values in two closely related clones.
ACKNOWLEDGEMENTS
RJ was funded by a PhD grant from the Ministère de l'Enseignement Supérieur et de la Recherche. This work was also supported by the French National Research Agency through the Laboratory of Excellence ARBRE (ANR-12-LABXARBRE-01). Tina Tosens was supported by EMÜ base funding 190200. We acknowledge Stephane Martin and Jean-Charles Olry, members of the Experimental Phytotronic Platform of Lorraine (PEPLor) at the University of Lorraine for taking care of the ozone facilities and for logistical support throughout the experiment, respectively. We are also grateful for the support from the ASIA platform at the University of Lorraine (https://a2f.univ-lorraine.fr/en/asia-2/). We would also like to thank the reviewers and editor for their constructive and helpful feedback and timely handling of the manuscript.
CONFLICT OF INTEREST STATEMENT
The authors declare no conflicts of interest.
Open Research
DATA AVAILABILITY STATEMENT
The data that support the findings of this study are available from the corresponding author upon reasonable request.


