Differences between tree stem CO2 efflux and O2 influx rates cannot be explained by internal CO2 transport or storage in large beech trees
Abstract
Tree stem respiration (RS) is a substantial component of the forest carbon balance. The mass balance approach uses stem CO2 efflux and internal xylem fluxes to sum up RS, while the oxygen-based method assumes O2 influx as a proxy of RS. So far, both approaches have yielded inconsistent results regarding the fate of respired CO2 in tree stems, a major challenge for quantifying forest carbon dynamics. We collected a data set of CO2 efflux, O2 influx, xylem CO2 concentration, sap flow, sap pH, stem temperature, nonstructural carbohydrates concentration and potential phosphoenolpyruvate carboxylase (PEPC) capacity on mature beech trees to identify the sources of differences between approaches. The ratio of CO2 efflux to O2 influx was consistently below unity (0.7) along a 3-m vertical gradient, but internal fluxes did not bridge the gap between influx and efflux, nor did we find evidence for changes in respiratory substrate use. PEPC capacity was comparable with that previously reported in green current-year twigs. Although we could not reconcile differences between approaches, results shed light on the uncertain fate of CO2 respired by parenchyma cells across the sapwood. Unexpected high values of PEPC capacity highlight its potential relevance as a mechanism of local CO2 removal, which merits further research.
Abbreviations
-
- ARD
-
- apparent respiratory difference, as O2 influx–CO2 efflux
-
- ARQ
-
- apparent respiratory quotient, as CO2 efflux/O2 influx
-
- [CO2]
-
- [CO2] in the gas phase
-
- [CO2*]
-
- dissolved inorganic carbon comprises of dissolved CO2, carbonic acid (H2CO3), bicarbonate (HCO3−) and carbonate (CO32−)
-
- ECO2
-
- stem CO2 efflux to the atmosphere (stem-surface)
-
- FT
-
- transport of dissolved respired C in the xylem sap
-
- IO2
-
- stem O2 influx (stem-surface)
-
- PEPC
-
- phosphoenolpyruvatcarboxylase; enzyme for CO2 fixation
-
- RS
-
- stem respiration
-
- ΔS
-
- storage flux, as the temporal change in dissolved CO2 in the sap
1 INTRODUCTION
Tree stem respiration (RS) is an important component of the forest carbon (C) budget and is estimated to account for 5%–42% of total ecosystem respiration (Campioli et al., 2016; R. L. Salomón et al., 2017; Yang et al., 2016). Respiration rate is usually extrapolated to the whole stem from CO2 efflux measurements at breast height. Even though direct measurements of CO2 efflux are easy to conduct, various processes can decouple CO2 efflux from RS, resulting in mismatches of up to 45% (Hilman et al., 2019; R. Teskey & McGuire, 2007): (1) Dissolution of CO2 in xylem water (Aubrey & Teskey, 2009; Bloemen et al., 2013; R. Teskey & McGuire, 2007), (2) axial CO2 diffusivity (De Roo et al., 2019), (3) nonphotosynthetic CO2 refixation via the enzymes carbonic anhydrase and phosphoenolpyruvate carboxylase (PEPC) (Berveiller & Damesin, 2008), or (4) photosynthetic CO2 refixation via woody tissue photosynthesis (e.g., Ávila et al., 2014; De Roo et al., 2020; Pfanz et al., 2002; Steppe et al., 2015). Even if we could accurately estimate RS at a given stem point, upscaling RS to the whole tree level in mature stands is questionable as the relative contribution of the abovementioned processes might vary with stem height (Ceschia et al., 2002).
Most studies applying the mass balance approach examined the contribution of CO2 efflux, CO2 transport and CO2 storage to RS in small trees or saplings (e.g., McGuire & Teskey, 2004; R. L. Salomón et al., 2018; Saveyn, Steppe, McGuire, et al., 2008) due to the easiness of constructing custom-made stem cuvettes surrounding the whole stem. However, applying findings from small trees to interpret CO2 efflux in mature trees could be hampered by the long radial diffusive pathway in thick stems, which could result in significantly limited CO2 diffusion rates (Steppe et al., 2007). This assumption is supported by findings in yellow poplar, where the relative contribution of CO2 efflux to RS decreased with stem diameter (up to 60 cm), while CO2 transport increased with stem size, as could be expected by larger sapwood conductive area, transpiration rates, and potential for CO2 removal from the point of production (Fan et al., 2017).
Therefore, simultaneous measurements of both gases allow for the assessment of potential shifts in respiratory substrate over time and under environmental stresses (Fischer et al., 2015). Furthermore, the ARQ can be affected by postrespiratory processes (Trumbore et al., 2013), providing information about the role of CO2 dissolution and transport on RS estimates, as CO2 is highly soluble in xylem sap, while O2 is less soluble. Hereby, assuming NSC as respiratory substrate, RQ would be ~1, and so would the ARQ as long as CO2 transport and storage were negligible, as CO2 efflux versus O2 influx equalize. However, Hilman et al. (2019) showed the inability of sap flow (and hence CO2 transport) to account for the variability in the ARQ of Q. ilex trees. Authors suggested CO2 refixation via the enzyme PEPC as the primary cause of ARQ below the unit, a mechanism of local CO2 removal commonly overlooked in RS research. However, the role of PEPC capacity in mature stems is still speculative as it has mainly been investigated in C4 plants and only in leaves and young green twigs of C3 plants (Berveiller & Damesin, 2008).
To do so, we continuously monitored the vertical and temporal variability in CO2 efflux, O2 influx and xylem [CO2] along a 3-m stem gradient in beech trees (Fagus sylvatica L.) during 1.5 summer months. Importantly, the study was performed in large mature trees, in which the contribution of CO2 transport to RS is expected to be higher (Fan et al., 2017), thereby enhancing the potential discrepancies between carbon- and oxygen-based approaches. Required additional variables to estimate the abovementioned respiration-related variables, like stem temperature, sap flow rate, and twig sap pH were also measured. Additionally, NSC concentrations and PEPC capacity from stem discs of the outermost tissues were discretely measured to evaluate potential shifts in substrate stoichiometry and the role of PEPC fixation on respiratory fluxes, respectively. We addressed the following hypothesis: When concurrently applying the carbon- and oxygen-based approaches in the same trees, xylem CO2 transport and storage can close the gap between O2 influx and CO2 efflux fluxes (i.e., the ARD = 0). Alternatively, the fraction of missing CO2 not explained by xylem CO2 transport and storage could be attributed to CO2 refixation via PEPC capacity if significant in large mature stems.
2 MATERIALS AND METHODS
2.1 Site description and experimental set-up
The experiment was conducted in a managed pure 130-year-old beech stand at ~100 m distance to the Fluxnet tower site Leinefelde (DE-Lnf, https://doi.org/10.18140/FLX/1440150) in the forest district of Heiligenstadt near the city of Leinefelde (51°20′N, 10°22′E; altitude 450 m a.s.l; Thuringia; central Germany). The mean annual air temperature and precipitation are 8.3 ± 0.7°C and 601 ± 154 mm (Tamrakar et al., 2018). We measured four even-sized mature beech trees with a tree height of ca. 38 m and stem diameter at breast height (DBH) ranging between 0.38 and 0.54 m (Table 1) during July and August 2019 (Days of year [DOY] 185–226).
| Tree | Diameter (cm) | Sapwood depth (cm) |
|---|---|---|
| 1 | 41 | 12.5 |
| 2 | 45 | 13.5 |
| 3 | 54 | 16.5 |
| 4 | 38 | 12.0 |
2.2 Stem CO2 efflux, O2 influx and xylem [CO2]
The concentration of xylem [CO2] in the gas phase (%) was measured with NDIR CO2 sensors (GMP221 and GMP251; Vaisala Inc.) calibrated before installation using reference gases at known [CO2] of 0%, 5%, 10% and 15%. For each sensor, we drilled a 40 mm deep and 25 mm wide hole into the stem and pushed the probe (length: 96 mm) halfway within the hole (~20 mm), leaving a closed headspace in the xylem tissues beyond the cambium layer. Synthetic rubber sealant (Teroson RB IX; Henkel) was used for isolation from the atmospheric gas. Four sensors were installed in each tree along the vertical profile monitored with stem chambers at 1, 2.35, 2.65 and 4 m. We initially envisaged applying the mass balance approach in the 30-cm-length stem segment between 2.35 and 2.65 m probes. Nevertheless, we eventually decided to average the xylem [CO2] time series from these two probes to survey longer (and more representative) stem segments, from 1 to 2.5 m (lower stem) and from 2.5 to 4 m (upper stem) (Supporting Information: Figure S1). Probes were placed ca. 10 cm from each chamber on the northwest side of the trees. Readings of the 16 sensors were recorded every 5 min with a datalogger (CR1000x; Campbell Scientific) for the whole experiment period.
2.3 Xylem CO2 transport and storage
The amount of CO2 transported upwards through the xylem and stored within the xylem was estimated in the lower and upper stem segments. The concentration of dissolved CO2 in xylem sap ([CO2*], mol CO2 l−1) was calculated using temperature-dependent Henry's Law coefficients (Levy et al., 1999; McGuire & Teskey, 2002), assuming equilibrium between CO2 in the gaseous and liquid phases. For this, xylem [CO2] in the gas phase, xylem sap pH, and stem temperature must be known. To monitor sap pH, xylem sap was collected from twigs of low branches of monitored trees (n = 3, as one tree was inaccessible for sampling) using a Scholander pressure chamber at four sampling dates (DOYs 204, 212, 218 and 226). Sap samples were quickly placed in Eppendorf tubes and a cold box for transportation to the laboratory and then stored in a refrigerator until measurement. Xylem sap pH was measured using a pH meter (Five Easy; Mettler Toledo) with a microelectrode (InLab®, Ultra-Micro-ISM; Mettler Toledo). Preliminary tests confirmed that sap pH did not significantly vary over the sample storage period. Stem temperature (Tstem,°C) was continuously measured and recorded with a datalogger (CR1000x; Campbell Scientific) every 5 min using thermocouples inserted at 2 cm depth next to each stem chamber.
A staining method was applied to determine the sapwood area; upon extraction of one wood core per tree at breast height on the northwest side of the tree (until the pith), a blue dye (E131) was injected into the hole, and a second core was extracted one cm above the first one after 1 h. Sapwood depth was determined by the length of the stained region of the core and assuming a cylindrical shape for both heartwood and sapwood (Table 1) (Goldstein et al., 1998).
2.4 Soil water content and shoot water potential
Soil water content (%) was continuously measured at the meteorological flux tower with one sensor (ML-2x; DeltaT) inserted at 16 cm depth, 100 m away from our instrumented trees, with a temporal resolution of 10 min. Shoot water potential (MPa) was measured around solar midday (as for sap pH sampling) at four sampling dates (DOYs 204, 212, 218, and 226) using the Scholander pressure chamber.
2.5 PEPC capacity and NSC in woody tissues
We took one stem disc (one cm-length, bark to xylem) at three stem heights (1, 2.5, and 4 m) on the south side of each monitored tree on 14 August (DOY 226). Samples were immediately frozen in liquid nitrogen to stop the metabolic activity and transported to the laboratory. Stem discs were stored at −80°C before grinding into a fine powder in liquid nitrogen with a mortar and pestle. 20 mg of woody tissue material was used for the discontinuous assay performed in a 96-well microplate (Bénard & Gibon, 2016). Briefly, aliquots were extracted by shaking with an extraction buffer. After centrifugation (7 min, 3000 g, 4°C), extracts were diluted and incubated for 20 min. The reaction was stopped with HCl. The sealed microplate was then incubated at 95°C for 10 min to destroy NADH. After cooling down, each well was neutralised with NaOH and Tricine-KOH pH 9.0 to adjust the pH to 9.0. The absorbance was read at 570 nm (30°C) until rates were stabilised. Reaction rates (mOD min−1) were used to calculate the amount of NAD+ formed during the first step of the assay. All pipetting steps were performed using a 96-head robot (Hamilton Star), and absorbances were measured in a filter-based microplate reader (SAFAS MP96). For further details, see Supporting Information: Methods S1 and Bénard and Gibon (2016).
We measured soluble sugars and starch in stem cores from the instrumented trees following the Landhausser et al. (2018) protocol. One stem core per height (1, 2.5, 4 m, south-side) was collected on 4 July (DOY 185) and 14 August (DOY 226) for NSC measurements. Samples were stored in cooling bags for transportation and then oven-dried at 60°C for 72 h. Stem cores were cut into two 2-cm long sections starting at the cambium (wood depth: 0–2 cm and 2–4 cm) and ground into a fine powder (ball mill, MM 400; Retsch). We extracted the soluble sugars glucose, fructose, sucrose, and starch from each sample. Briefly, ~30 mg of dry plant powder was extracted with 80% ethanol. Supernatants were analysed by High-Performance Liquid Chromatography coupled to a Pulsed Amperometric Detection (HPLC-PAD) for soluble sugar determination. We enzymatically converted the starch from the remaining pellet to glucose using α-amylase amyloglucosidase. Glucose hydrolysate was measured by the HPLC.
2.6 Data analysis
Statistical analyses were performed using R software (R Development Core Team, 2019). CO2 efflux and O2 influx data were discarded when the R2 of the linear fit for CO2 and O2 readings were below 0.96 to ensure good data quality. For gap filling, we used the pad function in padr package. To test whether the average daily values of CO2 efflux, O2 influx and xylem [CO2] varied with stem height, linear mixed models were adjusted using the lme function in nlme package (Pinheiro et al., 2017), considering height as a fixed factor and tree as a random factor including an autocorrelation structure to account for repeated measurements. To test whether PEPC capacity varied with stem height, and sap pH among sampling dates, linear mixed models were adjusted likewise, considering the tree as a random factor. The normality of residuals was checked visually. When significant, differences among heights were tested post hoc with Tukey contrasts using the emmeans function (emmeans package). Consistency between carbon- and oxygen-based measurements was tested by evaluating the relationship between RS (ECO2 + FT + ΔS) and O2 influx, and between CO2 internal fluxes (FT + ΔS) and ARD, with mixed models considering tree a random factor. Potential deviances from the 1:1 relationship would indicate a lack of consistency between methodological approaches, hence the need to revisit the underlying assumptions of Equation (3). The conditional and marginal R2 (Nakagawa & Schielzeth, 2013) of these models was estimated using r2_nakagawa function (performance package) to further evaluate the degree of agreement between approaches. Finally, sap flow, sap [CO2*] and the ARD were normalized to their daily maxima, and subdaily patterns were compared to evaluate the potential of xylem transport to remove locally respired CO2 on a subdaily basis.
3 RESULTS
3.1 Stem temperature, soil water content, sap flow rate and shoot water potential
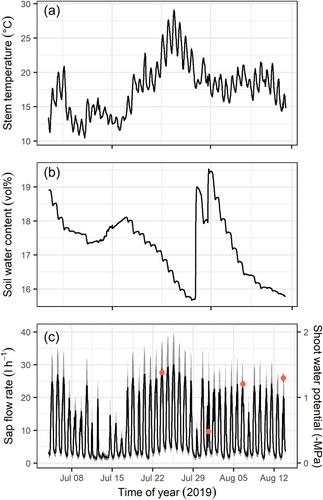
The mean stem temperature during the experiment was 17.7°C, with minimum values of 10°C during early July and peaking at the end of July with values close to 30°C (Figure 1a). Volumetric soil water content at 16 cm depth was lowest end of July, reaching minimum values of 15.7 vol% and maximum values of 19.0 vol% afterwards following summer rains (Figure 1b). Sap flow rate showed a typical subdaily pattern with maximum rates of 30 l h−1 during sunny and warm days (Figure 1c). Shoot midday Ψ (shoot water potential) was close to −1.4 MPa on most measurement days, except the one following rains when it relaxed up to −0.5 MPa (Figure 1c).
3.2 Gas exchange and internal [CO2] at different stem heights
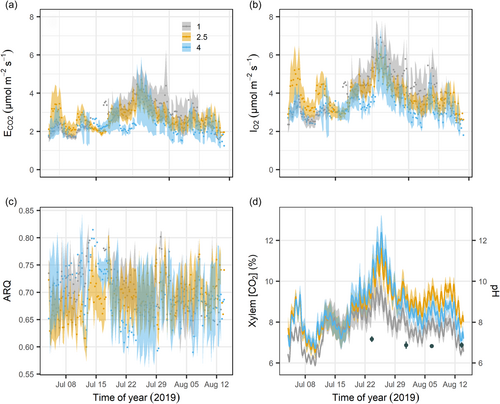
The vertical position did not affect CO2 efflux and O2 influx (p = 0.69 and 0.71, respectively). Mean daily CO2 efflux (±SE) was 2.9 ± 0.6, 2.7 ± 0.4 and 2.3 ± 0.6 μmol m−2 s−1 at 1, 2.5, and 4 m stem height, respectively (Figure 2a). Mean daily O2 influx was 4.1 ± 0.7, 3.9 ± 0.5 and 3.3 ± 0.6 μmol m−2 s−1, respectively (Figure 2b). O2 influx was consistently higher than CO2 efflux along the vertical gradient (p < 0.001), resulting in mean daily ARQ of 0.71 ± 0.04, 0.69 ± 0.04 and 0.69 ± 0.06 at 1, 2.5 and 4 m stem height, respectively (Figure 2c). Xylem [CO2] ranged from ca. 5.9% to 12.4%, with no significant effect of height over the whole surveyed period (Figure 2d; p = 0.11). However, when considering the last third of the experiment (1–14 August), stem height did affect xylem [CO2] (p = 0.03), with values being lower at 1 m compared with 2.5 m height. Sap pH ranged between 6.48 and 7.41 over the measurement period (Figure 2d), and differences in sap pH among trees (p = 0.17) or dates (p = 0.21) were not significant. Stem temperature had a strong effect on xylem [CO2] (p < 0.001), CO2 efflux and O2 influx (p < 0.01). Likewise, respiratory fluxes had maximum values during the afternoon, following subdaily thermal dynamics.
3.3 PEPC capacity and NSC at different stem heights
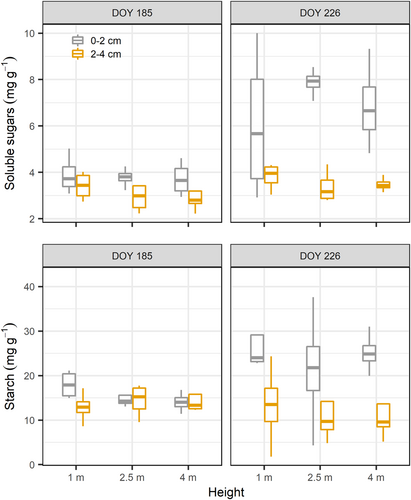
Stem height had no significant effect on PEPC capacity in the outermost stem section (p = 0.23) and did not differ among trees (p = 0.93). Mean PEPC capacity was 760.5 ± 201.6, 661.25 ± 60.2 and 547.25 ± 77.4 nmol min−1 gFW−1 at 1, 2.5 and 4 m, respectively.
Stem height did not affect soluble sugar and starch concentrations (p = 0.37 and 0.40, respectively) (Figure 3). Sapwood depth did affect NSC; both soluble sugar and starch concentrations were higher near the cambium (0–2 cm) than deeper into the sapwood (2–4 cm) (p < 0.05). Soluble sugar and starch concentrations were higher on the second sampling date in August (DOY 226) for the 0–2 cm depth (p < 0.001, p < 0.01 for soluble sugar and starch, respectively), while they remained constant deeper into the cambium (p = 0.1, p = 0.6 for soluble sugar and starch, respectively).
3.4 Comparison of carbon- and oxygen-based estimates of RS
We applied the mass balance approach on the lower (1–2.5 m) and upper (2.5–4 m) stem segments to estimate RS and its contributors for comparison with the oxygen-based approach (Figure 4). In the lower stem segment, there was a positive vertical gradient in sap [CO2*], and CO2 transport was, therefore, positive. Averaged across days and trees, the contribution of CO2 efflux to RS was 64.6 ± 14.5%, and the remaining fraction was attributed to CO2 transport (35.8 ± 14.3%), as CO2 storage was negligible (−0.4 ± 0.2%). The RS daily average (as the sum of ECO2, FT and ΔS) was greater than O2 influx, but on a subdaily basis, RS exceeded O2 influx only during the daytime. During night-time, RS equalled CO2 efflux, and both were lower than O2 influx.
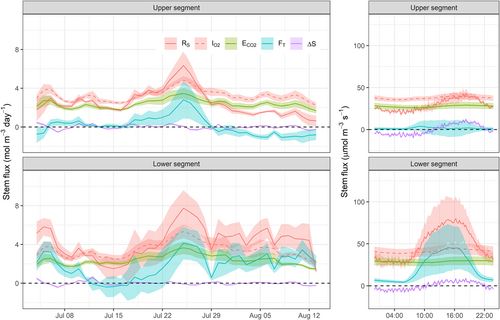
The upper stem showed a different pattern where the vertical gradient in sap [CO2*] approached zero and even became negative for the last 2 weeks of our study. As a consequence, the relative contributions of CO2 transport (−1.2 ± 2.2%) and CO2 storage (0.0 ± 2.2%) to RS were negligible, and apparently, all the respired CO2 diffused to the atmosphere (ECO2 = 101.1 ± 22.9%). In this stem section, both CO2 efflux and RS were on average lower than O2 influx for most of the surveyed period. Notably, the shift from positive towards negative CO2 transport flux followed the peak in temperature and transpiration at the end of July.
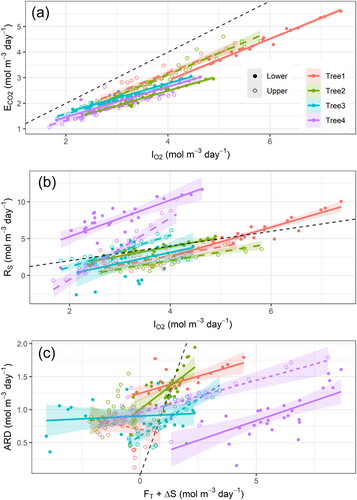
Daily values of stem CO2 efflux and O2 influx showed good agreement (Figure 5a) with a slope of 0.65 ± 0.02 (p < 0.0001), a significant intercept of 0.23 ± 0.11 (p < 0.05), and conditional and marginal R2 of 0.87 and 0.86, respectively. When this relation was forced through the origin (the intercept is zero), the slope increased to 0.69 ± 0.02, which is in better agreement with the mean ARQ of 0.70. Nevertheless, carbon- and oxygen-based estimates of RS showed poor consistency. Although RS and O2 influx were positively related (Figure 5b), the deviation of the mean slope from unity was significant (1.57 ± 0.18; p < 0.0001), as well as its intercept (−2.08 ± 1.01; p < 0.05). The model conditional and marginal R2 were 0.52 and 0.31, respectively. The slope of the relation between the ARD and CO2 internal fluxes (FT + ΔS) (Figure 5c) was almost 0 (0.056 ± 0.012; p < 0.0001), and its intercept was again significant (0.84 ± 0.09; p < 0.0001), denoting the limited potential of CO2 transport and storage to bridge the gap between CO2 efflux and O2 influx. The conditional and marginal R2 of this model were 0.21 and 0.13, respectively. Stem location did not affect the intercept of any of these relations (p > 0.1), according to the lack of consistency in vertical gradients of respiratory-related variables.
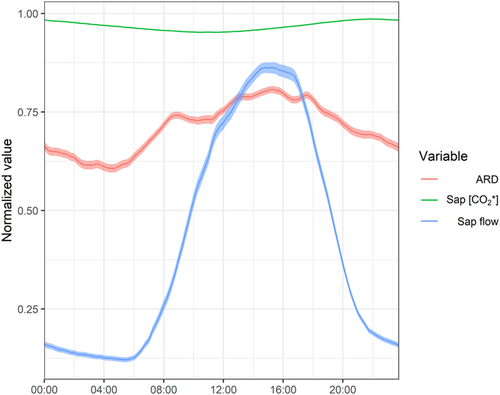
To further evaluate the potential of the transpiration stream to transport respired CO2 away from its point of production, we evaluate the subdaily patterns of ARD, sap flow and sap [CO2*] (as a proxy of CO2 solubility). For the comparison, we normalized the values of each variable to their corresponding daily maxima (Figure 6). Compared with sap flow dynamics, the ARD showed a relatively stable pattern over the 24-h period. It was higher during the daytime, with night-time reductions of ca. 30%–35% relative to the daily maxima. By contrast, sap flow showed night-time reductions of ca. 85%–90% relative to the daily maxima, denoting subdaily decoupling between CO2 transport and the ARD. Subdaily variation in sap [CO2*] was minimal, with the highest values observed during night-time and limited reductions during daytime (<2%) according to the inverse relation between solubility and temperature.
4 DISCUSSION
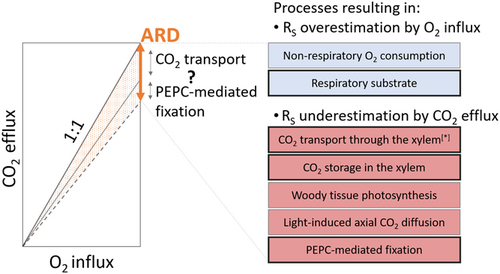
We combined a carbon-based mass balance approach and an oxygen-based method to estimate RS and reconcile apparent discrepancies regarding the fate of respired CO2 not locally emitted to the atmosphere. O2 influx was consistently higher than CO2 efflux across trees, locations and time, with ARQ fluctuating around 0.7 (Figures 2c and 5a), as similarly observed in several species applying the same methodological approach (Angert et al., 2012; Hilman & Angert, 2016; Hilman et al., 2019). Assuming the beech trees use carbohydrates for respiration, the measured ARQ suggests that 30% of the respired CO2 is retained in the stem. Figure 7 summarises potential sources of discrepancy between CO2 efflux and O2 influx. The ARD could be attributed to an underestimation of the respiratory activity by CO2 efflux measurements, an overestimation by O2 influx, or a combination of both. In any case, we must be cautious about the specific methodological issues related to the measurement of the numerous variables monitored here (i.e., CO2 efflux, O2 influx, xylem [CO2], sap flow, and sap pH), which might affect the magnitude of the mismatch between measurement approaches (see below).
No apparent vertical patterns in stem CO2 efflux, O2 influx and xylem [CO2] were observed along a 3-m-long stem segment (Figure 2), likely because of the modest vertical gradient in 38-m-tall beech trees. The temporal variability of CO2 efflux, O2 influx and xylem [CO2] showed that temperature was the dominant environmental driver controlling RS, as similarly observed before (e.g., Acosta et al., 2008; Lavigne et al., 1996; Maier et al., 2010; Rodríguez-Calcerrada et al., 2014; Ryan et al., 1995). Interestingly, during and after the peak in temperature and respiratory fluxes at the end of July, xylem [CO2] did increase along the lower stem segment (from 1 to 2.5 m height) but remained relatively stable along the upper stem (from 2.5 to 4 m height). This observed difference in the vertical gradient of the xylem [CO2] led to contrasting contributions of CO2 transport to RS in the lower and upper stem segments, as discussed below. The lack of a significant relation of both CO2 efflux and O2 influx with soil water content denotes that the mild drought did not limit respiratory metabolism to a large extent. Interestingly, ARQ remained relatively stable over the 1.5 summer months, where a temperature peak (30°C) occurred, suggesting similar sensitivity to temperature of CO2 efflux and O2 influx.
4.1 CO2 internal fluxes cannot explain the differences between stem O2 influx and CO2 efflux
Higher O2 influx than CO2 efflux could result from the higher solubility of CO2 in xylem sap (30 fold) compared with O2 (Dejours, 1981), hence the possibility of CO2 dissolving in the sap solution and being transported upwards or stored. If true, this would be evident in our mature beech trees, whose large sapwood conducting area provides room for potentially high transport and storage of respired CO2 (Fan et al., 2017). We found a nonneglectable contribution of CO2 transport to RS, up to 1/3 in the lower stem segment, highlighting the potentially significant role of CO2 xylem transport in diverting root-respired CO2 from soil measurements (Aubrey & Teskey, 2021). Nevertheless, we found two lines of evidence refuting our hypothesis, as CO2 internal fluxes could not bridge the gap between stem O2 influx and CO2 efflux. First, the relation between O2 influx and RS diverged from the 1:1 line (Figure 5b), as indicated by a slope different from the unit and a significant intercept. Furthermore, the marginal R2 = 0.31 of this relation denotes that stem O2 influx accounted for less than one-third of the variability in the carbon-based estimate of RS. Identical reasoning applies to the comparison between CO2 internal fluxes (FT + ΔS) and ARD (Figure 5c), with a marginal R2 of 0.13, further supporting the limited potential of xylem CO2 transport and storage to predict the ARD. Second, if the ARD could be primarily ascribed to xylem CO2 transport, ARD and sap flow subdaily variability should follow similar patterns (Bowman et al., 2005; McGuire & Teskey, 2004; McGuire et al., 2007). However, the subdaily variation in ARD was limited compared with sap flow (Figure 6). Specifically, ARD maintained values above 50% of the daily maxima during night-time, when sap flow was reduced to a much larger extent, down to 10%–15% of the daily maxima. Moreover, sap [CO2*] on a subdaily basis was remarkably stable, with minimal reductions during daytime ascribed to temperature-driven reductions in CO2 solubility, partly offset by the daytime increase in respiratory activity and xylem [CO2]. Therefore, CO2 solubility in sap could not significantly affect the strength of CO2 transport as a mechanism to remove respired CO2 from its production site. Taken together, subdaily patterns of ARD, sap flow and sap [CO2*] thus provide further evidence of the limited role of the transpiration stream in filling the gap between CO2 efflux and O2 influx in this study. This observation agrees with Hilman et al. (2019), showing the inability of sap flow to account for the variability in ARD of Q. ilex trees.
Nevertheless, we must be cautious about the specific methodological issues related to the measurement of sap flow and sap pH and their corresponding propagation errors. For instance, sap flow measured with the heat pulse method often underestimates the actual sap flow, on average, by 35% (Steppe et al., 2010). Considering a proportional underestimation of CO2 transport, its contribution to RS would also increase in parallel, affecting the difference between RS and O2 influx differently among individuals and heights. Sap pH, especially above 6.5, is another critical factor for calculating CO2 transport, as the solubility of CO2 increases exponentially with pH. Here, we applied a constant pH value across daily and subdaily temporal scales and assumed similar pH between twig sap and stem sap. However, these assumptions can lead to further CO2 transport misestimation (Aubrey et al., 2011; Erda et al., 2014; R. Salomón et al., 2016) and deviances between carbon-based estimates of RS and O2 influx. Moreover, if parenchyma cells were damaged upon sap extraction, the sample might be contaminated, resulting in an overestimation of the pH values (Tarvainen et al., 2023) and hence CO2 transport. Another source of uncertainty in ARQ estimation is the relative humidity correction applied to estimate O2 influx. The relative humidity sensor integrated into the [CO2] sensor has a slow response time, as shown in Helm et al. (2021). Assuming an underestimation of humidity levels in the measurement chamber by, for example, 5%, the dilution correction required for O2 estimation would increase the ARQ by ~0.001.
Regardless of these potential measurement uncertainties, we did not succeed in reconciling differences between the two approaches, which highlights a crucial methodological difference. The carbon-based approach estimates RS based on fluxes measured at the stem surface and internal fluxes measured in the xylem, while the oxygen-based approach relies on O2 influx at the stem surface. Therefore, the disagreement between approaches might be related to the fact that (i) CO2 efflux and O2 influx likely reflect respiration in the outermost tissues of the stem (bark, phloem, cambium and outer xylem) and that (ii) respiration of the inner sapwood in large trees cannot be appropriately detected by measurements taken at the surface. According to Fick's law of diffusion, the rate of gas (CO2 or O2) diffusion is inversely related to the length of the diffusive pathway (Nobel, 2009) and, therefore, such decoupling likely increases in large-sized trees. Here, in the mature beech trees with a sapwood depth between 12 and 16.5 cm, the diffusion of respired CO2 by inner living cells is much lower than in seedlings and saplings, wherein each respiring cell is located nearer to the bark-atmosphere interface. Decoupling between internal respiratory fluxes and fluxes from the stem surface can be exacerbated by the high water content of the cambium layer (De Schepper et al., 2012), acting as a major diffusion barrier according to the slow gas diffusivity in water (ca. 104 times lower than in air; Nobel 2009).
4.2 PEPC-mediated CO2 fixation as a relevant driver of the systematic mismatch between CO2 efflux and O2 influx
Higher O2 influx than CO2 efflux could be explained by CO2 refixation via PEPC, which hinders CO2 from being locally emitted. We measured PEPC capacity of 656 nmol min−1 g FW−1, equivalent to 22 nmol s−1 g DW−1 (assuming stem water content of 50%). For comparison, the PEPC capacity in current-year twigs of beech trees was 13 nmol s−1 g DW−1 (Hilman et al., 2019, recalculated from Berveiller & Damesin 2008), and 17 nmol s−1 g DW−1 in Pinus sylvestris (Hilman et al., 2019, recalculated from Ivanov et al., 2006). Therefore, the capacity of CO2 refixation via PEPC measured here was comparable with that observed in younger, greener twigs.
In nonphotosynthetic tissues, PEPC is involved in anaplerotic reactions, compensating for the depletion of C skeletons consumed by the tricarboxylic acid cycle towards other pathways (synthesis of amino acids) or even other organs (export of malate and citrate via the xylem stream). Part of the phosphoenolpyruvate (PEP) produced by glycolysis may be converted to oxaloacetate and further to malate, with a zero net balance of ATP and NADH during the fixation of two molecules of CO2. Given the low ARQ values observed here, the resulting malate may not be locally oxidized, but further metabolized to produce, for example, citrate or amino acids. Evidence shows that malate concentration increases in the stem of Acer platanoides trees moving upwards (Schill et al., 1996). Transported malate can increase the malate pool in leaves (Gessler et al., 2009), where it could be metabolized via malic enzymes releasing CO2, thus favouring carboxylation via Rubisco (Hibberd and Quick 2002). Alternatively, the products can be transported downwards via the phloem (Hoffland et al., 1992; Shane et al., 2004; Touraine et al., 1992), followed by excretion in the rhizosphere as root exudates. Alternatively or additionally, PEPC could be involved in pH regulation (Caburatan & Park, 2021), the latter having appeared stable despite fluctuations in xylem CO2 (see e.g. Erda et al., 2014). Extrapolating PEPC capacity on a volume basis for comparison with CO2 efflux or O2 influx (as in Figure 4) resulted in unrealistically high rates of PEPC fixation (up to two orders of magnitude higher than RS estimates). First, enzyme activity measured in vitro under saturating substrate usually exceeds the in vivo flux (Junker et al., 2007). Second, PEPC capacity likely decreases with xylem depth (Höll, 1974), and PEPC samples were uniquely taken from the outermost stem tissues. Nevertheless, the high values of PEPC capacity on a volume basis suggest that even low PEPC capacity could be significant for the stem C budget and could help explain the discrepancy between CO2 efflux and O2 influx.
4.3 Other potential C sinks
Another potential missing C sink in RS budgets is the CO2 photosynthetic refixation occurring in chloroplast-containing cells located in peripheral woody tissues (Ávila et al., 2014; De Roo et al., 2020; R. O. Teskey et al., 2008), which can reduce stem CO2 emissions by half, as observed in young poplar trees (De Roo et al., 2020). However, local photosynthetic fixation can be safely discarded within our experimental set-up, as opaque stem chambers were used to measure CO2 efflux, precluding photosynthetic light reactions. Nevertheless, we cannot discard the possibility of axial diffusion of CO2 in the gas phase ascribed to distant woody tissue photosynthesis (De Roo et al., 2019; Saveyn, Steppe, & Lemeur, 2008). In this line, light-driven photosynthesis above and below the (opaque) stem chamber can develop light-induced vertical [CO2] gradients, leading to CO2 axial diffusion in the gas phase that has been observed to reduce CO2 efflux by 22% in oak stems (De Roo et al., 2019). Furthermore, we cannot rule out the possibility of O2 influx measurements overestimating stem respiratory activity. We must critically note that O2 influx measurements should be considered as additional information that helps disentangle CO2 sinks and sources, but not as an equivalent to RS as uncertainties remain. First, a shift in the respiratory substrate from NSCs to lipids or proteins, with a lower oxidation state, requires a higher amount of O2 for respiratory reduction, hence increasing the ARD (and reducing the ARQ; Fischer et al., 2015; Hanf et al., 2015). However, our study extended over 6 weeks during the summer season and measured NSC concentrations at different heights and depths did not indicate a seasonal NSC depletion that would alter the respiratory substrate (Figure 3). Moreover, beech is not known to store lipids (Hoch et al., 2003), further suggesting the limited role of substrate change on the ARD. Secondly, nonrespiratory O2 uptake by O2-consuming enzymes like oxidases and hydroxylases (Sweetlove et al., 2013) that are not involved in respiratory metabolism may increase O2 influx while CO2 efflux remains constant (Kruse & Adams, 2008; O'Leary et al., 2019; Tcherkez et al., 2012). Thirdly, high growth rates related to cell wall deposition, likely occurring at the end of the growing season, may also lead to a nonrespiratory increase in O2 consumption, as observed in Pinus radiata (Kruse & Adams, 2008).
5 CONCLUSION AND OUTLOOK
Carbon- and oxygen-based methods to estimate RS yield inconsistent results when simultaneously applied to the same individuals under the same conditions. We found a consistent ratio between CO2 efflux and O2 influx close to 0.7, which cannot be primarily explained by internal fluxes (xylem CO2 transport and storage) and might be linked to alternative sinks of respired CO2 (PEPC fixation and axial CO2 diffusion) and nonrespiratory O2 consumption. Remarkably, the high PEPC capacity measured here in mature tree stems, comparable with that observed in current-year greener twigs, points towards PEPC-mediated CO2 fixation as a relevant driver of the systematic mismatch between CO2 efflux and O2 influx. We encourage further research combining CO2 efflux and O2 influx readings in parallel with measurements of potential respiration and PEPC capacity at different sapwood depths, as this would help to assess the contribution of inner and outer tissues to total RS and how they relate to fluxes at the stem surface. Ideally, incorporating O2 consumption and biochemical-level knowledge (such as PEPC fixation) into plant mechanistic models could help to more accurately estimate RS and better constrain larger-scale C models.
ACKNOWLEDGEMENTS
The authors thank Martin Göbel, Edgar Tunsch, Frank Tiedemann, Dietmar Fellert for technical support, Savoyane Lambert, Nadine Hempel, David Herrera Ramírez for field assistance and Iris Kuhlmann, Anett Enke and Christin Leschik for laboratory support. Thanks to Philip Deman for his help in calibrating the xylem [CO2] probes. We thank Christian Markwitz for soil water content data. JH acknowledges the continuous support of the International Max Planck Research School for Global Biogeochemical Cycles. We thank the administration of the forestry district Heiligenstadt for the opportunity for research in their forest area. Finally, we are also very grateful to Prof. Aubrey and one anonymous reviewer for their valuable comments. Jan Muhr and Alexander Knohl acknowledge funding by the European Research Council under the European Union's Horizon 2020 research and innovation programme (grant agreement no. 682512 - OXYFLUX). Roberto L. Salomón acknowledges funding from the Research Foundation Flanders (FWO) and the Marie Skłodowska-Curie research programme (grant no. 665501). Open Access funding enabled and organized by Projekt DEAL.
CONFLICT OF INTEREST STATEMENT
The authors declare no conflict of interest.
Open Research
DATA AVAILABILITY STATEMENT
The data that support the findings of this study are available from the corresponding author upon reasonable request.


