Chilling induces sugar and ABA accumulation that antagonistically signals for symplastic connection of dormant potato buds
Abstract
Endodormancy (ED) is a crucial stage in the life cycle of many perennial plants. ED release requires accumulating a certain amount of cold exposure, measured as chilling units. However, the mechanism governing the effect of chilling on ED duration is poorly understood. We used the potato tuber model to investigate the response to chilling as associated with ED release. We measured the accumulation of specific sugars during and after chilling, defined as sugar units. We discovered that ED duration correlated better with sugar units accumulation than chilling units. A logistic function was developed based on sugar units measurements to predict ED duration. Knockout or overexpression of the vacuolar invertase gene (StVInv) unexpectedly modified sugar units levels and extended or shortened ED, respectively. Silencing the energy sensor SNF1-related protein kinase 1, induced higher sugar units accumulation and shorter ED. Sugar units accumulation induced by chilling or transgenic lines reduced plasmodesmal (PD) closure in the dormant bud meristem. Chilling or knockout of abscisic acid (ABA) 8′-hydroxylase induced ABA accumulation, in parallel to sweetening, and antagonistically promoted PD closure. Our results suggest that chilling induce sugar units and ABA accumulation, resulting in antagonistic signals for symplastic connection of the dormant bud.
1 INTRODUCTION
The ability to form buds and undergo cycles of growth and dormancy is central to the evolution of the perennial life strategy. Perennial plants have evolved a dormancy mechanism in temperate regions to overcome severe cold temperatures and frost. Lang et al. (1987) distinguished three types of bud dormancy: endodormancy (ED), mediated by autonomous factors that activate internal bud signals; paradormancy, promoted by other plant organs; and ecodormancy, induced by environmental factors. It is unclear whether overlapping genetic mechanisms control these different dormancy types or whether distinct signalling pathways converge to activate a joint genetic programme. Most deciduous tree species become dormant in response to decreasing temperature. ED release depends on accumulated exposure to chilling temperature, i.e., the minimum period of cold weather after which a fruit-bearing tree will blossom (chilling units) (Cooke et al., 2012). This is often expressed in chilling hours, which can be calculated in different ways and essentially involves adding up the total time spent in winter at certain temperatures. The number of chilling units required for bud break during the spring varies among cultivars and species (Atkinson et al., 2013; Rohde & Bhalerao, 2007; Singh et al., 2017). Accordingly, chilling units are commonly used to predict dormancy duration (Chuine et al., 2016; Hänninen et al., 2019). Nevertheless, it is unclear what the downstream cumulative molecular events of chilling units exposure are.
The potato tuber is a stem formed by the swelling of subapical underground stolons (Ewing & Struik, 1992). As the tuber elongates, a growing number of lateral bud meristems (termed eyes) are formed in a spiral arrangement on its surface (Goodwin, 1967). After harvest, tuber buds are generally dormant and will not sprout or grow, even if the tubers are placed under optimal conditions for sprouting (Aksenova et al., 2013; Muthoni et al., 2014). This dormancy is defined as ED (Lang et al., 1987) and is due to an unknown endogenous signal(s) that mediates suppression of tuber-bud meristem growth (J. C. Suttle, 2004). Tuber dormancy is a physiological adaptation to intermittent periods of environmental limitations. Therefore, it is a survival mechanism that prevents sprouting when the potato tuber is exposed to extreme environmental conditions (J.C. Suttle, 2007). The duration of the tuber ED period depends primarily on the genotype, crop growth, and postharvest conditions (Teper-Bamnolker et al., 2012; Teper-Bamnolker et al., 2017; Turnbull & Hanke, 1985; Wiltshire & Cobb, 1996). Following a transition period of between 1 and 15 weeks, depending on storage conditions and variety, dormancy is released, and the tuber apical bud starts to grow (Wiltshire & Cobb, 1996). Potato tubers have been used as a model system to study ED (Holmes et al., 1970; G. Kumar & Knowles, 1993; Michener, 1942; Salam et al., 2017). Tuber dormancy represents a case in which an otherwise annual plant generates a vegetative perennating organ with an unclear chilling requirement.
Buds are actively growing plant organs that serve as strong sinks for sugars to meet their metabolic demands and support their growth. The bud's growth capacity depends on its sink strength in acquiring and using available sugars. Thus, buds have to compete for sugars, which constitute the central carbon and energy source for growth (Buskila et al., 2016; Maurel, Leite, et al., 2004; Maurel, Sakr, et al., 2004; Salam et al., 2017). The association between bud outgrowth and mobilisation of starch reserves in stem tissues has been well-documented, especially in perennial plants (Decourteix et al., 2008; Rameau et al., 2014). High activity of sugar-metabolising enzymes leads to increased sugar utilisation by the bud (Decourteix et al., 2008; Girault et al., 2010; Marquat et al., 1999; Maurel, Leite, et al., 2004; Rabot et al., 2012).
During tuber development, the storage parenchyma converts soluble assimilates (sucrose, amino acids) into polymeric reserves (starch and storage proteins) (Prat et al., 1990; Visser et al., 1994). At maturity, over 70% of the tuber carbohydrate reserves are sequestered as starch, which must be converted into transport-compatible solutes for sprouting initiation and growth (Eshel & Teper-Bamnolker, 2012; Sonnewald & Sonnewald, 2014). Sucrose synthesis appears to be a dominant anabolic pathway in the dormant tuber's parenchyma (Viola et al., 2007). During cold-induced sweetening, sucrose synthesis increases, and some portion of sucrose is translocated to the vacuole, where it is hydrolysed to glucose and fructose (Mckenzie et al., 2013; Sowokinos, 2001). This step is predominantly carried out by vacuolar acid invertase (StVInv), an enzyme strongly associated with the accumulation of reducing sugars during chilling (Datir, 2020; Matsuura-Endo et al., 2004). Silencing the potato StVInv gene reduces hexoses accumulation during chilling (Bhaskar et al., 2010; Zhu et al., 2016). Viola et al. (2007) showed a differential symplastic connection of dormant versus growing buds of potato tuber. The dormant bud is disconnected from the surrounding parenchyma cells, and symplastic connectivity of the meristem is restored with the onset of sprout growth, suggesting transport blockage to the dormant bud (Sonnewald & Sonnewald, 2014).
SNF1-related protein kinase 1 (SnRK1) is a plant ortholog of the evolutionarily conserved SNF1/AMPK/SnRK1 serine–threonine kinase family involved in controlling cellular energy homeostasis. The protein takes the form of a complex formed with a SnRK1α catalytic subunit and regulatory subunits SnRK1β and SnRK1γ. SnRK1 plays an essential and convergent role in mediating sugar- or energy-deficiency responses induced by darkness, starvation, or other stress conditions (Baena-González et al., 2007; Broeckx et al., 2016). Modifying the expression level of SnRK1α in transgenic plants affected carbon metabolism in the potato tuber and leaves (McKibbin et al., 2006; Purcell et al., 1998). The transgenic potato plants expressing antisense SnRK1α did not sprout for 2 years under cold storage (Halford et al., 2003). Still, the role of SnRK1 complex in regulating bud ED is not yet clear.
Abscisic acid (ABA) has been shown to induce cessation of shoot growth and establishment of bud dormancy in several plant species (Horvath et al., 2003; Le Bris et al., 1999; Rohde & Bhalerao, 2007). Higher expression of 9-cis-epoxycarotenoid dioxygenase (NCED3) homologs, which are rate-limiting enzymes for ABA biosynthesis, and higher ABA content have been reported at the beginning of ED in sweet cherry (Goetz et al., 2014), peach (Wang et al., 2016) and pear (J. Li et al., 2018; Tuan et al., 2017). During ED induction and maintenance in grape buds, ABA levels increase, along with increased expression of VvNCED1; however, the endogenous ABA levels decrease, and ABA catabolites increase after buds accumulate enough chilling units (Zheng et al., 2015). Wang et al. (2016) showed that three genes, highly similar to CYP707A2 encoding ABA 8′-hydroxylase from Arabidopsis, play an overlapping role in controlling ABA inactivation, resulting in ED release in peaches (Wang et al., 2016).
ABA is metabolised in potato tuber tissues throughout dormancy, and tuber ABA content generally declines during storage (Biemelt et al., 2000; J. C. Suttle, 1995). During ED, ABA synthesis and metabolism occur in the tuber-bud meristem, the surrounding periderm, and the underlying cortex (Destefano-Beltrán et al., 2006; J.C. Suttle et al., 2012). The decline in ABA content as ED progresses is correlated with decreased expression of the biosynthetic genes NCED1/2 and higher expression of the catabolic ABA 8′-hydroxylase (Debast et al., 2011; Destefano-Beltrán et al., 2006). Similarly, transgenic plants with modified trehalose 6-phosphate (T6P) levels showed an altered dormancy period and altered expression of ABA 8′-hydroxylase. The level of ABA 8′-hydroxylase expression is inversely correlated with ABA levels and positively correlated with bud break (Debast et al., 2011). Hence, although a decline in ABA content is associated with ED progression and appears to be a prerequisite for dormancy break, there is not likely to be a particular threshold concentration below which dormancy is broken, suggesting the involvement of other agonistic or antagonistic factors (Biemelt et al., 2000; J.C. Suttle et al., 2012).
To promote growth, soluble sugars and other growth-promoting signals must move through the symplastic pathway into the dormant bud (Tylewicz et al., 2018). During the dormancy period, symplastic intercellular communication through plasmodesmata (PD) is blocked by callosic dormancy sphincters and reestablished upon dormancy release (Rinne et al., 2011; Tylewicz et al., 2018). Viola et al. (2007) showed a differential symplastic connection in tuber dormant versus growing buds, suggesting transport blockage to the dormant bud.
In this study, we used potato tuber as a model system to investigate the role of sugar accumulation induced by chilling in determining ED duration of vegetative buds. We showed that soluble sugars accumulation is a better predictor of dormancy duration. Modification of sugars accumulation or signalling in transgenic tubers changes the duration of ED. We establish the antagonistic effect of sugars and ABA, both induced by chilling, on the dormant bud's symplastic connection.
2 MATERIALS AND METHODS
2.1 Plant material
Freshly harvested tubers of potato (S. tuberosum ‘Désirée’, ‘Sifra’, and ‘Tyson’) were obtained from commercial growing fields in northern Negev, Israel. Tubers were stored for 2 weeks at 14°C to cure harvest wounds. StVInv-knockout potato tubers were developed as previously described (Salam et al., 2021; Teper-Bamnolker et al., 2022).
The percentage of dormancy release was measured once a week in 3 replicates of 20 tubers for each treatment. A tuber was considered non-dormant when at least one bud was 2 mm long. For sugar analysis and RNA extraction, five tubers from each treatment were sampled every 2 weeks.
2.2 Logistic function adjustment
Dormancy-release data collected weekly during storage were used to calculate a predicted value of the logistic function with unknown x50 and k. Then, Excel solver was used to calculate x50 and k, which gave the minimum sum of squares error for each treatment.
2.3 Sugar extraction and quantification
Sugars were extracted and quantified as previously described, with minor modifications (Salam et al., 2017). Briefly, bud-base parenchyma tissue was sampled using a cork borer (Ø 1 cm, 3 cm penetration), weighed, and immediately frozen in liquid N2 and transferred to −80°C until use. Tissues were incubated three times in 80% ethanol at 80°C for 45 min each time. The solution was dried using a speed vacuum (Centrivap concentrator, Labconco) and passed through a 0.2-mm membrane filter (Millex-GV filter unit, Merck Millipore). The filtrate was used for sucrose, glucose, and fructose analyses by ultrafast liquid chromatography (UFLC) in an LC-10A UFLC series system (Shimadzu) equipped with a SIL-HT automatic sample injector, pump system, refractive index detector (SPD-20A), differential refractometer detector (Waters 410) and analytical ion-exchange column (6.5 × 300 mm, Sugar-Pak I, Waters). The mobile phase (ultrapurified deionized water, Bio-Lab) was eluted through the system for 20 min at a flow rate of 0.5 mL/min, and the column temperature was set to 80°C. The chromatographic peak corresponding to each sugar was identified by comparing the retention time with that of a standard. A calibration curve was prepared using standards to determine the correlation between peak area and concentration.
2.4 Calculation of sugar units and chilling units
To calculate sugar units, total soluble sugar content was calculated as the sum (integral) of sucrose, glucose and fructose contents during a selected period (see Equation 2). For the chilling unit calculation, each degree below 14°C on each day of cold exposure was considered 1 chilling unit.
2.5 Callose staining
Callose was stained as previously described, with minor modifications (Sagi et al., 2005). Briefly, the tuber apical bud was manually detached, then sliced and incubated for 1 h in a mixture of 0.1% (wt/vol) Aniline blue in double-distilled water and 1 M glycine, pH 9.5, at a volumetric ratio of 2:3, respectively, and premixed at least 1 day before use. Images were acquired with a Leica SP8 laser-scanning microscope equipped with a solid-state laser with 405 nm light, HC PL APO CS2 63X/1.2 water-immersion objective (Leica) and Leica Application Suite X software. Aniline blue emission signal was detected with a PMT detector in the range of 415–490 nm.
2.6 Plasmid construction
35S::stvinv potato lines were produced by PCR amplifying the StVInv open reading frame (2340 bp) using gene-specific primers (Table S1) attached to attB1 and attB2 borders. The PCR product was cloned into the Gateway vector pDONOR221 by standard BP clonase2 reaction, according to the Gateway cloning system (Invitrogen). To produce StGal83-RNAi-silenced lines, the gene fragments were PCR amplified using specific primers (Table S1) and cloned into the pDONOR221 vector. The resulting plasmids were verified by sequencing (Hylabs) and then cloned by standard LR clonase2 reaction (Invitrogen) into the binary vector pK7WG2D-1 (overexpression) or pK7GWIWG2(II) (hpRNA) (Karimi et al., 2007). The orientation of the inserted StGal83 fragment in the destination vectors was confirmed using the gene-specific forward primers and the vector-specific chloramphenicol resistance (CmR) primers (Table S1). The sequence was confirmed using the destination vector primers (Table S1). The recombinant destination vectors were transformed into Agrobacterium tumefaciens EH105 and used for plant transformations.
ABA 8′-hydroxylase (StCYP707A1/2)-knockout lines were produced by determining the sgRNA6 and sgRNA1 target regions in exons 1 and 8 of StCYP707A2 (PGSC0003DMG400007972), and sgRNA2 and sgRNA3 target regions in exons 1 and 3 of StCYP707A1 (PGSC0003DMG402018475), respectively, using the publicly available web-based CRISPR-design tool (http://crispr.hzau.edu.cn/CRISPR2/). The target sequence, known as the protospacer adjacent motif (StCYP707A2-sgRNA6: GGCCATCCCATTGATCCAGG, StCYP707A2-sgRNA1: GCATGTACTCCACTGCCAAA, StCYP707A1-sgRNA2: GGTAAACCTAAAGTACCAGG, StCYP707A1-sgRNA3: CTTTGTTGAAGAGTGTACCG), was located downstream of the NGG trinucleotide (Figure S11A). The StCYP707A1/2 target sequences, the gRNA scaffolds and the U6 Arabidopsis promotor were synthesised into pUC57-AMP plasmid (GENEWIZ) with restriction site MluI at the 5′ prime end and HindIII at the 3′ prime end. The synthesised fragment (StCYP707A2−382 bp, StCYP707A1−384 bp) (Figure S11A) was cloned into the MluI and HindIII sites of the pRCS-35s:Cas9-AtU6:sgRNA binary plasmid (Chandrasekaran et al., 2016) (Figure S11B). The obtained clone was confirmed by sequencing (Figure S11C).
2.7 Mutant screening and genotyping
Genomic DNA was isolated from 20 T0 potato plants according to Dellaporta et al. (1983). Screening for mutants was conducted using primers flanking StCYP707A2-sgRNA6 and StCYP707A1-sgRNA2 target regions (Table S1). PCR products were digested with the restriction enzyme Mval. The digested products were separated on a 1% agarose gel, and an uncut band, indicating changes in the DNA, was sought. StCYP707A2 lines #12 and #88 and StCYP707A1 lines #4 and #5 were detected as knockout lines (Figure S12A). Twelve colonies of each line were sequenced and aligned to the intact StCYP707A1/2 using the ClustalW BioEdit software programme (©1997–2013, Tom Hall Ibis Biosciences). According to the ratio obtained between the sequenced colonies, the four-allele mutation composition was determined. Genotyping revealed that line #12 contains three mutated alleles and a WT allele (Figure S12B) and lines #88, #4 and #5 contains four mutated alleles encoding a stop codon (Figure S12C,E,F). Twenty plants from each CRISPR mutant were grown in a greenhouse, and their phenotype was characterised. All mutants exhibited typical development, morphology and tuber formation.
2.8 Agrobacterium-mediated transformation
Potato leaves (cv. Désirée) were used for Agrobacterium-mediated leaf disc infection as described previously (Rocha-Sosa et al., 1989). Transgenic plants were selected on 50 mg/L kanamycin (Duchefa). Well-rooted plants were transferred to soil and grown at 25°C in a greenhouse. After 100 days, tubers were harvested and stored at 14°C in 95% humidity for further analysis.
2.9 RNA extraction
Tuber apical buds were sampled as previously described with slight modifications (Law & Suttle, 2003). Meristems with minimal attached storage tissue were excised with a 1 mm curette, frozen in liquid N2 and stored at −80°C. RNA was purified using the SDS/CTAB method as previously described with slight modifications (Barbier et al., 2019). A single meristem in a 2-mL tube (<0.5 mg) was ground in a GENO grinder for 45 s at 1750 rpm, dipped in N2, and then ground again. CTAB buffer (625 µL of 2% vol/vol CTAB, 1.4 M NaCl, 20 mM ethylenediaminetetraacetic acid, 100 mM Tris–HCl, 2% wt/vol polyvinylpyrrolidone 40) and 25 µL of 0.5 mM DL-dithiothreitol were added. The sample was then vortexed and heated at 60°C for 15 min with vortexing every 5 min. SDS (35 µL of a 10% vol/vol solution) was added to the sample and after vortexing and centrifugation for 12 min at 14 000 rpm (16 900 g) 600 µL of the liquid phase was taken and centrifuged again; 550 µL of this liquid phase was placed into a new 1.5-mL tube and precooled (−20°C). Isopropanol (550 µL) was added and vortexed. The samples were kept for 30 min at −20°C and then centrifuged at 4°C for 1 h at 14 000 rpm. The isopropanol was removed and the pellet was washed with 70% ethanol, centrifuged for 10 min removed from the ethanol and dried. DNA was removed by suspending the pellet in 70 µL RNase-free water, heating at 58°C for 3 min and then adding 8 µL DNase buffer and 2 µL DNase (TURBO™ DNase [Thermo Fisher Scientific]). The samples were vortexed and incubated at 37°C for 25 min. Next, 10 µL of 5 M NaCl was pipetted in, 100 µL isopropanol was added and the mixture was vortexed. Samples were then kept at −20°C for 30 min and centrifuged at 4°C for 1 h (1400 rpm). The isopropanol was removed, and the pellet was washed in 1 mL 70% ethanol and centrifuged for 10 min at 14 000 rpm. The ethanol was removed, the pellet was dried and then suspended in prewarmed (58°C) RNase-free water. Samples were kept at −80°C until further use.
2.10 Complementary DNA (cDNA) synthesis and RT-PCR analysis
cDNA was synthesised from 100 ng total RNA using a qPCRBIO cDNA Kit (PCR Biosystems) according to the manufacturer's specifications. RT-PCR primers, synthesised by Hylabs, were designed using Primer Express 2.0 (Applied Biosystems). The primers used for the quantitative real-time RT-PCR (qPCR) are given in Table S1. EF1α (GenBank accession no. AB061263) served as the housekeeping gene, as previously described (Nicot et al., 2005). The qPCR was performed in a total volume of 10 µL, including 5 µL fast SYBR™ Green Master Mix (Applied Biosystems). The following programme: 95°C for 20 min, 40 cycles of 95°C for 3 s and 60°C for 30 s was run in a StepOne Real-Time PCR machine (Applied Biosystems). Determination of graph quality, melting curves and quantitative analyses of the data were conducted using StepOne software Version 2.2.2 (Applied Biosystems).
2.11 Quantitative analysis of ABA
Endogenous levels of ABA were quantified using the isotope dilution LC-MS/MS method (Ljung et al., 2010). Sample extraction, purification (solid-phase extraction), and evaporation in vacuo were performed as described in Šimura et al. (2018). In this study, 1 mg of lyophilised plant material was used. The extraction solvent contained a mixture of stable isotope-labelled standards. Standards were purchased from the following: ABA, D6 ABA; dhiydrophaseic acid (DPA), phaseic acid (PA), NeoPA, D3 DPA, D3 PA—NRC. Before analysis, samples were resuspended in 40 µL of mobile phase and analyzed by LC (+)ESI MS/MS in multiple reaction monitoring (MRM) mode. Analyses were performed using a Nexera X2 modular liquid chromatograph coupled to an MS 8050 triple quadrupole mass spectrometer (Shimadzu) via electrospray interface. Chromatographic separation was performed using Waters analytical column CSH™ C18, 2.1 × 150 mm, 1.7 µm. Aqueous solvent A consisted of 15 mM formic acid adjusted to pH 3.0 with ammonium hydroxide. Solvent B was acetonitrile. Separation was achieved by gradient elution at a flow rate of 0.4 mL/min at 40°C: 0–1 min 20% B; 1–11 min 80% B in a linear gradient, followed by washing and equilibration to initial conditions for a further 7 min. Where possible, up to three MRM transitions were monitored for each analyte to ensure correct identification. Raw data were processed using Shimadzu software LabSolutions ver. 5.97 SP1.
2.12 Exogenous ABA treatment
Tubers were sterilised for 5 min in 1% NaOCl, dormant apical buds were detached using cork borer (Ø 1 cm, 1 cm penetration) and deep in 50 mL of MES buffer (20 mM MES-Hydrate, 300 mM d-manitol, 5 mM ascorbate; pH 6.5) replacing the buffer every 5 min for three times. Afterward, buds were placed on Watman paper soaked in MES buffer. ABA 100 mM stock solution was prepared in dimethyl sulfoxide (DMSO) and diluted to the target concentration in ultra-pure water. Every 2 days 8 µL of the ABA solution was pipet on the bud meristem. For the control solution, DMSO was diluted in ultra-pure water.
3 RESULTS
3.1 Cold-induced sweetening activates early ED release
To study how chilling regulates potato tuber ED, freshly harvested ‘Désirée’ tubers were stored at 14°C for 2 weeks to cure harvest wounds. They were left at 14°C or transferred to 12°C, 9°C, 6°C, or 4°C for 4 weeks, then returned to 14°C to avoid inhibition of bud growth by cold temperature (ecodormancy). Every 2 weeks, five tubers from each treatment were sampled for sugar analysis. Chilling induced elevated levels of sucrose and hexoses (Figure 1a–c). Sucrose concentration peaked at 2 weeks of cold storage, followed by peaks of glucose and fructose at 4 weeks, mainly in tubers that were stored at 4°C (Figure 1b,c). Temperature treatments above 6°C did not induce significant sugar accumulation (Figure 1a–c).
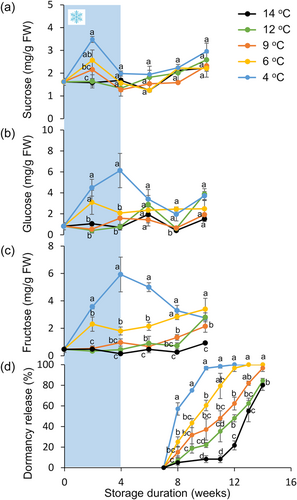
In association with sugar elevation, chilling (4°C) for 4 weeks was most efficient at shortening ED duration, with just 7 weeks until 50% of the tubers sprouted (x50; Figure 1d). Exposure to higher temperatures induced longer ED, up to 13 weeks to reach x50, for storage at 14°C (Figure 1d). A similar pattern was found after 8 weeks of chilling (Figure S1); however, sprouting differences between treatments were reduced, suggesting suppression of growth by the chilling after ED release, namely, ecodormancy.
Tuber exposure to 2 weeks, instead of 4 weeks, at 4°C, followed by their transfer to 14°C, showed lower sugar accumulation and longer ED duration, suggesting the need for sufficient chilling exposure for ED release (Figure S3). No bud burst was observed in tubers continuously exposed to 4°C (16 WC treatment in Figure S3), suggesting that while ED release occurs at cold temperature, higher temperature is needed for bud growth. We obtained similar results in two other potato cultivars—Sifra and Tyson (Figure S4), suggesting a more general phenomenon of shortened ED period due to chilling followed by parenchyma sweetening.
3.2 ED release is better associated with the accumulation of sugar units than chilling units
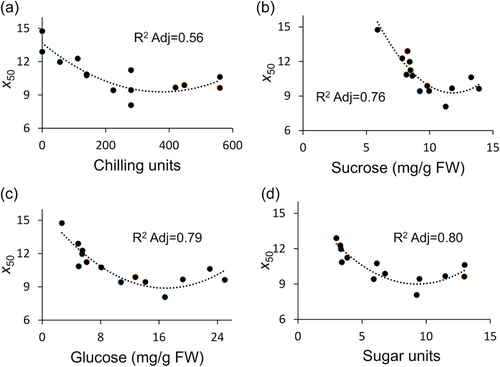
To further distinguish between sugar units and chilling units, we tested whether one is more relevant than the other to ED duration. We chose a set of conditions under which the chilling units are constant, but the sugar units are different. Exposing dormant tubers to 2 weeks of chilling at various times during storage (same chilling units quantity) induced differential ED duration (Figure S5A). Sugar units level was higher, and ED duration was shorter when tubers were exposed to chilling in the first 2 weeks (W0–W2) compared to later chilling exposure (W2–W4 or W4–W6; Figure S5B). Despite accumulating the same number of chilling units, dormancy duration was modified in association with sugar units level.
3.3 StVInv-knockout or overexpression modifies ED duration differentially and in association with modifications in sugar units
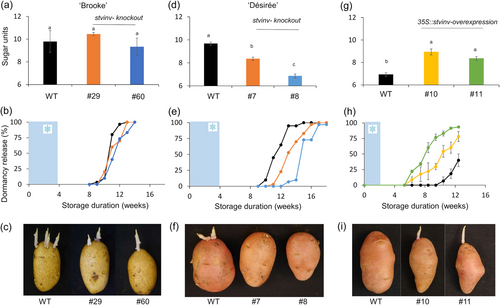
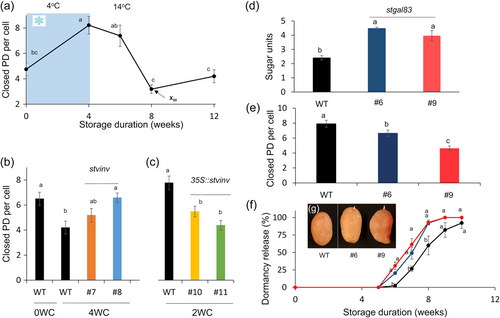
The enzyme StVInv converts sucrose into glucose and fructose. Previous studies have shown that silencing StVInv in potato causes an increase in tuber sucrose and a low level of hexoses (Salam et al., 2017; Wu et al., 2011). To establish the role of sugar units in ED duration, we knockout StVInv in cvs. Brook and Désirée. We expected this modification to change only the balance between sucrose, glucose and fructose levels but not the level of sugar units. As expected, ‘Brooke’ StVInv lines (#29 and #60) showed no significant differences in sugar units accumulation or ED duration compared to the WT (Figure 3a–c). Surprisingly, ‘Désirée’ StVInv-knockout lines (#7 and #8) had a lower level of sugar units following chilling, associated with longer ED duration (Figure 3d–f). StVInv overexpression had the opposite effect. Exposing 35S::stvinv ‘Désirée’ lines #10 and #11 to 2 weeks of chilling (4°C) induced a higher level of sugar units and shorter ED compared to the WT (Figure 3g,h). Accordingly, tuber dormancy was dramatically shorter, confirming the association between sugar units formation in the tuber parenchyma and bud ED duration (Figure 3g,h).
3.4 Sugar units level is associated with the removal of symplastic-connection blockage in the dormant bud
Sugars were elevated in the chilling treatments much earlier than the appearance of the bud-burst phenotype (Figure 1; Figures S1 and S3). A high level of soluble sugars, induced by 4 weeks of chilling, did not induce bud burst immediately after transferring the tubers to optimal growing conditions. Dormancy was released about 4 weeks later, when the soluble sugar level dramatically decreased (Figure 1; Figures S1 and S3). We hypothesised that symplastic connection blockage (PD closure) causes the time gap between sugar elevation in the tuber parenchyma and dormancy release of the tuber buds. To determine the level of PD closure, tuber apical buds were sampled during and after chilling and analyzed by staining for callose with Aniline blue. The buds were dissected and analyzed under a confocal microscope for callose accumulation in the cell-wall PD, indicating blockage of the symplastic connection (Zavaliev & Epel, 2015). We found an increase in the number of closed PD per cell during the first 6 weeks of ED (Figure 4a; Figure S6). Terminating the chilling exposure by transferring the tubers to 14°C gradually decreased the number of closed PD per cell (Figure 4a; Figure S6). We expect that such PD blockage reduces the transport of sugars to the dormant bud, thereby delaying ED release. Reducing the accumulation of sugar units in stvinv mutants #7 and #8 induced a higher number of closed PD per cell; the elevated level of sugar units in 35S::stvinv lines #10 and #11 resulted in a lower number of closed PD (Figure 4c). These results suggested sugar level signalling to induce the removal of PD blockage.
3.5 Silencing the energy sensor SnRK1 reduces PD blockage and induces early ED release
The symplastic connection is blocked during chilling, preventing sugars from reaching the dormant buds. Since sugar level decreases before bud growth (during short chilling), we hypothesised that the sugar units' elevation signals energy availability rather than serving as energy for bud growth. We RNAi-silenced the potato SnRK1β subunit (StGal83) in ‘Désirée’ to test our hypothesis. Postharvest tubers were stored for 2 weeks at 4°C, and then transferred to 14°C. Dormancy release was monitored every week. The ED duration of both lines—stgal83 #6 and #9 (51% and 79% silencing, respectively; Figure S7)—was shorter with the induction of a higher level of sugar units (Figure 4d and 4f,g). PD closure was lower in StGal83-silenced lines as compared to the WT (Figure 4f). This suggests that the SnRK1 complex is part of the machinery regulating bud ED.
3.6 Chilling induces ABA accumulation which inhibits symplastic connection of the dormant bud
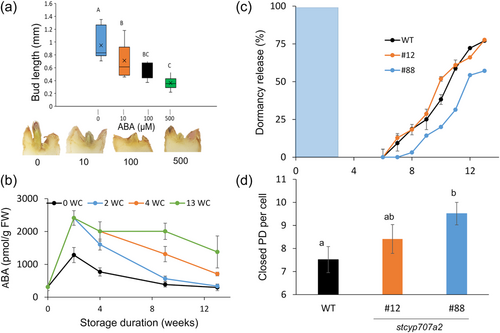
Another explanation for the gap in time between sugar accumulation and bud burst can be the presence of a growth inhibitor that antagonizes the growth-promoting effect of the sugars. Exogenous application of ABA hormone to detached tuber buds showed a dose-dependent inhibitory effect (Figure 5a) compared to other hormones tested previously (Buskila et al., 2016). The exogenous application of ABA to 35S::stvinv line #11, which produces a higher level of sugar units, eliminates the inhibition of dormancy release and bud elongation (Figure S8). Exposing ‘Désirée’ tubers to four chilling (4°C) treatments of different duration (0, 2, 4 and 13 weeks) induced ABA accumulation in the parenchyma underneath the apical bud. The ABA level gradually declined in all treatments once tubers were transferred to 14°C (Figure 5b). Knockout of ABA 8′-hydroxylase (StCYP707A2) increased the level of ABA in the dormant bud and induced similar or longer ED of the transgenic lines (stcyp707a2 #12 and #88) compared to the WT, in association with the number of mutated alleles (3/4 and 4/4, respectively; Figure 5c). The same pattern could be found when we knocked out another isoform of ABA 8′-hydroxylase, StCYP707A1 (Figure S9A). Knockout of StCYP707A1/2 induced a higher level of ABA in the dormant bud, in association with constant and lower levels of PA and DPA, respectively (Figure S9B). Moreover, lines #12 and #88 showed a higher number of closed PD per cell in the meristem of the apical bud (Figure 5d; Figure S10). These results suggested that antagonistically to sugars, ABA induces a lower symplastic connection of the dormant bud.
4 DISCUSSION
4.1 Chilling induces early ED release of potato tuber
A requirement of chilling exposure for early dormancy release has been shown in perennial tree buds (Arora et al., 2003) and bulb buds of Gladiolus (Bhujbal et al., 2014), Liliaceae (Kim et al., 2014; Langens-Gerrits et al., 2003) and onions (Benkeblia & Shiomi, 2004). We discovered how to distinguish between ED and ecodormancy in potato tuber buds and found that chilling treatments shorten ED duration (Figures 1 and 2; Figures S1–S4). In addition, we discovered that a logistic function accurately describes ED release in potato tubers (Figure S2), which enables mathematically distinguishing ED from the ecodormancy period using the k value (dormancy release rate). A k value under 2 suggests ED, and a k value above 2 suggests ecodormancy. The logistic function has been suggested as a model for common knotgrass (Polygonum aviculare) seed-dormancy release and to predict bud break in sweet cherry (Prunus avium) trees (Batlla et al., 2009; Fernandez et al., 2019; Malavert et al., 2017). Our results suggest that the effect of chilling on ED duration is related to the tuber-sweetening response.
4.2 ED release is better associated with the accumulation of sugar units than chilling units
Cold-induced sweetening is a well-studied process in which carbohydrates are converted from starch to soluble sugars, mainly sucrose, glucose and fructose, due to chilling (D. Kumar et al., 2004; Sowokinos, 2001). When ED is released and the temperature allows bud growth, sugars are consumed by higher respiration, starch resynthesis or sprouting (Sonnewald & Sonnewald, 2014). Consequently, a specific threshold of soluble sugar availability probably needs to be crossed. Here we developed a calculation for sugar units level representing the average soluble sugar availability during the ED period. Analysis of the ED duration data using the logistic function allowed quantitatively to identify the processes involved in the dormancy release and the distinction between the generally used chilling units and the sugar units introduced in this study. The parameter x50 showed a higher correlation of ED duration with sugar units than with chilling units (Figure 2). Furthermore, exposure to the same amount of chilling units at different times resulted in different ED durations associated with differential sugar units formation (Figure S5). We can assume that increasing sugar units under chilling is an osmoprotective or scavenging response (Tai et al., 2020; Valluru & Van den Ende, 2008).
The enzyme StVInv converts sucrose down into glucose and fructose; silencing StVInv in potato tubers results in a different pattern of cold-induced sweetening symptoms (Greiner et al., 1999; Wu et al., 2011). Here, ‘Désirée’ stvinv lines showed prolonged ED in association with the lower sugar units accumulation (Figure 3). Accordingly, 35S::stvinv ‘Désirée’ tubers showed shorter ED duration, associated with increased sugar units (Figure 3). These results suggest that ED duration is mainly affected by sugar units accumulation.
Since sugar units represent the sum of sucrose, glucose and fructose, modifying the activity of StVInv is not expected to affect their level. However, changing the ratio between sucrose and hexoses affected the total sum and extended ED duration, suggesting differential consumption of these compounds for other processes, such as respiration or signalling. RNAi silencing of StVInv in cv. Russet Burbank caused an increase in tuber sucrose, mainly in the parenchyma but not in the bud (Salam et al., 2017). We, therefore, suggested that parenchyma sucrose induces signalling for multiple stems in the sprouting tuber, rather than energy mobilisation from the parenchyma to the bud (Salam et al., 2017). Silencing of potato alpha-amylase 23 (StAmy23) also inhibited dormancy release in cv. Solara (Hou et al., 2017, 2019). Those authors suggested that more extended dormancy is related to the shortage of reducing sugars. According to their results, stamy23 lines had reduced glucose levels and no concomitant difference in sucrose levels. Sugars have been suggested to regulate sprouting via the T6P–sucrose pathway (Sonnewald & Sonnewald, 2014). Debast et al. (2011) influenced tuber dormancy duration by altering T6P content in cv. Solara. They linked the dormancy phenotype with ABA content and suggested that T6P regulation of SnRK1 might regulate ABA content. Here we propose that sugar units are better predictors of ED duration than chilling units because they serve as a signal and energy source for ED release.
4.3 Sugar units as a signal
The soluble sugars induced by chilling cannot reach the bud and catalyze growth due to the absence of a symplastic connection during ED. A few weeks after chilling exposure is terminated, most of the soluble sugars have already been consumed, and it is therefore unlikely that sugar units induce ED release only via enhanced energy availability. Reducing the accumulation of sugar units by higher incubation temperature or by mutating StVInv induced a higher number of closed PD (Figure 4; Figure S6). These results suggest that sugar units accumulated during ED are translated into a signal through energy sensors which induce a chain of reactions that will be resolved later in ED release. Here we reduced the activity of the energy-sensing SnRK1 complex via RNAi silencing of StGal83 (SnRK1 beta subunit); this resulted in lower PD blockage followed by early dormancy release (Figure 4). Silencing of the SnRK1 complex probably induced a high-energy signal, followed by reduced PD closure and shorter dormancy duration. Conversely, SnRK1 repression was abrogated in pp2c (a negative regulator of SnRK1)-knockout mutants, provokin—similar to SnRK1 overexpression—sugar hypersensitivity during early seedling development of Arabidopsis (Rodrigues et al., 2013).
The compound T6P is both a signal and regulator of sucrose status and modifying its level regulates tuber dormancy (Figueroa & Lunn, 2016; Yadav et al., 2014). In young tissues such as the growing bud, T6P and other sugar metabolites inhibit SnRK1 activity (Baena-González & Lunn, 2020; Nunes et al., 2013). The existence and importance of sugar signalling have long been debated in the literature, mainly because it is challenging to eliminate the sugars' role as an energy supply. Here we suggest that sugar units serve as a signal to remove PD blockage and, later, as an energy source for bud growth.
4.4 Sugar units and ABA antagonistically signal for removal of PD closure
Vegetative bud burst requires the formation of symplastic connections to the bud to allow metabolic flow before dormancy release (Viola et al., 2007; Xin et al., 2019). We found that sugar levels in the tuber parenchyma dramatically decrease when chilling is terminated. When the bud bursts, the sugar content of the chilling-treated parenchyma, located under the bud, does not differ from that of unexposed buds (Figure 1; Figures S1 and S3). Viola et al. (2007) demonstrated that sugars must reach the new growing meristem through symplastic connections as a prerequisite for bud break. We previously showed that feeding sugars into detached potato stems resulted in lateral bud bursts and the loss of apical dominance after a few days (Salam et al., 2017, 2021). The time gap between sugar accumulation and bud burst is suggested to result from a unique inhibitory mechanism.
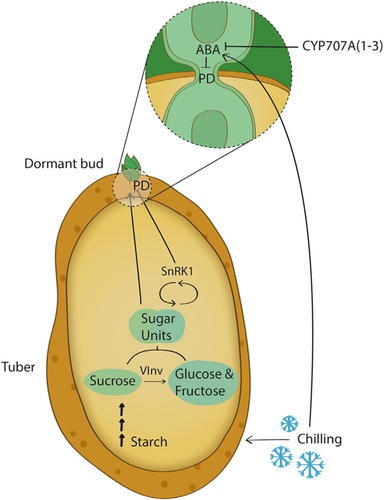
Phytohormones regulate bud dormancy in plants, specifically in potato tubers (Liu & Sherif, 2019; Pan et al., 2021; J. C. Suttle, 2004). Gibberellins, cytokinins, and brassinosteroids induce dormancy release and promote tuber-buds burst (Hartmann et al., 2011; L. Li et al., 2020), whereas ethylene and ABA promote dormancy maintenance (Mani et al., 2014). In hybrid aspen trees, a short photoperiod signal enhances ABA level, which induces a pathway that enhances callose synthase blockage of PD and maintenance of bud dormancy (Tylewicz et al., 2018). In maize (Zea mays), low temperatures changed the ultrastructure of leaf PD and caused callose deposition, thereby inhibiting growth (Bilska & Sowiński, 2010). We showed that in potato tubers, chilling exposure enhances ABA (Figure 5). Knockout of ABA 8′-hydroxylase increased the level of ABA in the dormant bud and induced longer ED mainly of lines #88, #4 and #5 (Figure 5; Figure S9). Knockout of 3/4 alleles in stcyp707a2 line #12 had no significant effect on ED duration (Figure 5; Figures S11 and S12) Since ABA is converted to PA by ABA 8′-hydroxylase and DPA is rapidly formed from PA, the lower level of DPA in line #88 support lower convertion of ABA and longer dormancy (Figure 5; Figure S9). Thus, the unique time gap in ED between sugar elevation and bud burst might be due to ABA's antagonistic effect on PD closure (Figure 6).
5 CONCLUSION AND PERSPECTIVE
Since dormancy cannot be studied in classical plant models, the potato tuber offers an attractive system to study bud dormancy because its burst and growth are not limited by a seasonal cycle and can be investigated under various temperature and light conditions. In the present study, we opted for a systematic approach used to distinguish between ED and ecodormancy in potato tuber. We showed the similarity between potato bud dormancy and tree bud dormancy and found that total sugar units are a better predictor of dormancy duration than chilling units. In addition, we developed a logistic function that can accurately predict dormancy duration based on sugar units measurements. Using CRISPR/Cas9 lines in which the vacuolar invertase gene (StVInv) or the energy sensor SnRK1 were knocked out or overexpressed, we showed that dormancy duration was affected (becoming longer or shorter, respectively) and correlated with the degree of sugar units modification. By labelling the callose in the dormant bud of these knockout lines, we could suggest a novel finding that the sugars induce symplastic connections to the dormant buds. We further found that chilling or knockout of ABA 8′-hydroxylase induces ABA accumulation concurrently to sweetening. Our results suggest that sugar units and ABA accumulation exert antagonistic signal to dormant bud symplastic connection to the plant vascular system. An open question remains about the possible direct interaction of ABA with sugar metabolism during ED period.
ACKNOWLEDGEMENTS
This research was funded by grants from the Chief Scientist of the Israeli Ministry of Agriculture and Rural Development (no. 20-06-00108), BARD (US–Israel Binational Agricultural Research and Development fund) project IS-5317-20C, the Israeli Ministry of Science and Technology (no. 3-15697), and by project no. RO0418 (Sustainable systems and technologies, improving crop production for a higher quality of production of food, feed, and raw materials, under conditions of changing climate) of the Ministry of Agriculture, Czechia, and the project “Plants as a tool for sustainable global development” (registration no.: CZ.02.1.01/0.0/0.0/16_019/0000827) within the programme Research, Development, and Education (OP RDE). The authors thank Prof. Naomi Ori from The Robert H. Smith Institute of Plant Sciences and Genetics in Agriculture, The Hebrew University of Jerusalem, for valuable suggestions and constructive criticism.
CONFLICTS OF INTEREST STATEMENT
The authors declare no conflicts of interest.
Open Research
DATA AVAILABILITY STATEMENT
The data that support the findings of this study are available from the corresponding author upon reasonable request.


