The planktonic food web in the Gulf of Naples based on the analysis of carbon and nitrogen stable isotope ratios
[Correction added on 21 October 2023, after first online publication: The copyright line was changed.]
Abstract
Plankton play a key role in marine food webs by producing and transferring organic matter and energy to higher trophic levels. To define the trophic structure and interactions within the planktonic communities in the Gulf of Naples, we determined carbon and nitrogen stable isotope ratios in particulate organic matter (POM, <20 μm), phytoplankton (20–200 μm), and bulk (unsorted) and sorted mesozooplankton (200–2000 μm) on a weekly basis in 2019. The stable isotope values of POM and, to a lesser extent, phytoplankton reflected the short-term (weekly) alternation between offshore and coastal waters within seasonal variability. Although the isotopic signatures of coastal and offshore sources were still detectable in bulk mesozooplankton, δ13C and δ15N of single groups remained almost unchanged throughout the year. The trophic niches of mesozooplankton groups defined using the Stable Isotope Bayesian Ellipses in R software showed a high degree of overlap among them, which was corroborated by the tendency of most groups toward omnivory, beyond their known feeding habits, as indicated by MixSIAR models. Collectively, our results highlight that the complex network of interactions within the planktonic community in the Gulf of Naples can buffer natural variability due to the specific hydrographic features of the system. This characteristic makes the trophic structure of this community an ideal model for monitoring the response of planktonic food webs to climate- and anthropic-driven changes.
1 INTRODUCTION
Plankton communities contribute fundamentally to the production and transfer of organic matter and energy at sea and their organisms shape pelagic food webs through their abundance, functional roles, and interactions (Sommer et al., 2012). In coastal waters, planktonic organisms and their interactions are affected by the remarkable variability in environmental conditions driven by a complex interplay between physical and anthropogenic forcing acting at different spatial and temporal scales. Assessing trophic links in coastal plankton communities is further challenged by the potential diversity of organic sources (terrestrial vs. marine, autotrophic vs. heterotrophic) entering and sustaining the food web. Most zooplankton consumers have diverse diets (Bode et al., 2004) by feeding on a variety of prey, including phytoplankton, microplankton, and detritus (Batten et al., 2001; Irigoien et al., 1998; Stoecker & Capuzzo, 1990). Based on observations under controlled conditions, zooplankton (mainly copepods) have been assigned to different trophic guilds (carnivores, omnivores, herbivores, and detritivores) (Benedetti et al., 2016; Hébert et al., 2016). However, the dietary flexibility of most species hinders the accurate determination of specific trophic traits and the definition of their roles within planktonic food webs.
Carbon and nitrogen stable isotopes (δ13C, δ15N) are used to disentangle trophic interactions within plankton communities and define food web structures (e.g., Décima et al., 2013; Sano et al., 2013; Tarling et al., 2012). Carbon stable isotope ratios are remarkably distinct among sources of different origins (e.g., terrestrial, freshwater, marine), which allows them to be tracked along trophic levels through primary producers (DeNiro & Epstein, 1978; Post, 2002). Nitrogen stable isotopes change in an often-predictable way across consumers, which allows the assignment of trophic levels to different organisms/groups based on their δ15N (DeNiro & Epstein, 1981; Post, 2002). Therefore, the stable isotope approach enables to capture the spatial and temporal variability of trophic webs, which are affected by physical processes, river discharges, dust, and urban inputs (Darnaude et al., 2004; Hauss et al., 2013; Millet et al., 2018).
Stable isotope signatures of plankton communities have been used to characterize water mass movements (Espinasse et al., 2014), spatial gradients (Fanelli et al., 2022), and seasonal variations by analyzing plankton according to size (Rolff, 2000) and functional groups (Burd et al., 2002; Sommer & Sommer, 2004). However, only a few studies have investigated the trophic interactions within planktonic communities (e.g., Hunt et al., 2017).
In the western Mediterranean Sea, the Gulf of Naples (GoN) is a highly dynamic system in which offshore and coastal waters mix owing to wind-driven transport (Cianelli et al., 2015). In the coastal area of the GoN, the structure and variability of phyto- and zooplankton have been regularly monitored (Zingone et al., 2019). Although a model was developed to depict the planktonic trophic web at this site (D'Alelio et al., 2016), a reconstruction of trophic interactions based on the direct definition of trophic levels and dietary compositions of the different planktonic components has never been attempted. To fill this gap, we determined δ13C and δ15N in particulate organic matter, phytoplankton, and mesozooplankton on a weekly scale during 2019 to define (1) the temporal variability of stable isotope signatures, (2) the plankton trophic niches and their degree of overlap, (3) the dietary composition of the most abundant mesozooplankton groups, and (4) their trophic levels. The overarching goal of our study was to sketch the trophic structure and interactions within the planktonic community of the GoN in response to environmental variability.
2 MATERIALS AND METHODS
2.1 Study area
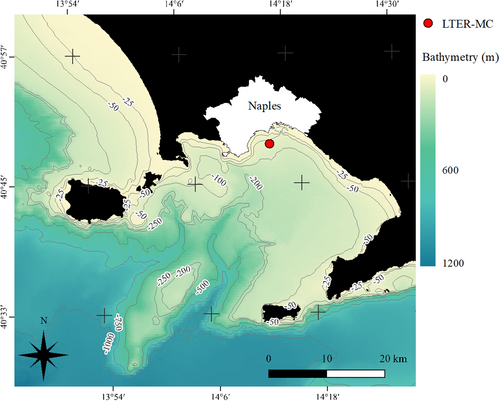
The GoN is a semi-enclosed basin in the central-southern Tyrrhenian Sea (Figure 1), where two distinct water masses originating from offshore and coastal areas prevail alternatively on a weekly scale and mix during intermediate phases (Cianelli et al., 2015). Anthropic activities are intense along the coastline, ranging from artisanal fisheries to maritime traffic. The Long Term Ecological Research station “MareChiara” (LTER-MC) was set (40°48′50″ N, 14°15′0″ E) in January 1984 to monitor regularly the physical and chemical characteristics of the water column and the plankton dynamics (Mazzocchi et al., 2023; Ribera d'Alcalà et al., 2004; Zingone et al., 2022).
2.2 Sample collection
Sampling was performed weekly from January to December 2019 at the LTER-MC site onboard the R/V “Vettoria”. Starting from March (due to technical problems), water samples were collected by deploying a 5 L Niskin bottle at the subsurface (−1 m), a depth chosen to capture the potential variability of δ13C and δ15N associated with the offshore and coastal waters. Water samples were then transferred into 5 L plastic carboys. Plankton samples were collected by vertical tows (from approximately 70 m depth) using a 20 μm and a 200 μm mesh nets, transferred into plastic jars, and transported to the laboratory on ice within 1 h after collection.
2.3 Sample processing
In the laboratory, seawater samples were sieved through a 20 μm mesh. The fraction <20 μm was collected by gentle vacuum onto precombusted Whatmann GF/F 0.7 μm filters to concentrate picoplankton (0.2–2 μm) and nanoplankton (2–20 μm) into a single size fraction called particulate organic matter (POM) hereafter. Filters were then frozen at −30°C before being freeze-dried. Samples collected using a 20 μm net were screened through a 200 μm mesh to remove mesozooplankton, concentrated onto a 20 μm mesh, and transferred into vials. This size fraction, which includes microphytoplankton and microzooplankton, was labeled phytoplankton in the present study. Samples were further concentrated by centrifugation, and the supernatant water was removed before freezing and freeze-drying. Both POM filters and phytoplankton samples displayed a green color, which ensured that detritus was negligible in them, as a consequence of repeated sieving.
Mesozooplankton were isolated by sieving the 200 μm net samples through a 2000 μm mesh to collect only the 200–2000 μm fraction and were concentrated onto a 200 μm mesh sieve. Each sample was split into two subsamples, which were transferred into separate vials and frozen at −30°C. Half of the 64 subsamples were unsorted (bulk mesozooplankton). In the other half, the organisms were sorted under a stereomicroscope. Copepods and cladocerans were sorted at the genus/species level and then grouped according to the literature into different trophic guilds (predominantly herbivorous, omnivorous, carnivorous, and detritivorous for copepods; herbivorous and omnivorous for cladocerans) (Table 1). The remaining mesozooplankton organisms were sorted at the taxonomic level. All the organisms were counted (Table S1). Bulk (unsorted) and sorted mesozooplankton groups were freeze-dried, ground into a fine powder, and homogenized individually using a mortar and a pestle. All samples were stored at −30°C and analysed within 6 months after collection.
| Species | Trophic guild | Prey | Reference |
|---|---|---|---|
| Copepoda | |||
|
Calocalanus spp. Temora stylifera Paracalanus spp. Ctenocalanus spp. Mecynocera clausi |
Predominantly herbivore | Phytoplankton | Benedetti et al. (2016); Suzuki et al. (1999) |
|
Acartia clausi Centropages spp. Lucicutia spp. Pleuromamma spp. |
Omnivore | Phytoplankton, microflagellates, ciliates | Saiz et al. (2007); Tiselius (1989) |
| Clausocalanus spp. | Benedetti et al. (2016) | ||
| Sapphirina spp.a | Phytoplankton, microzooplankton, faecal pellets | Kattner et al. (2003); Lampitt & Gamble (1982); Saiz et al. (2007) | |
| Corycaeidae | Carnivore | Nanoplankton, mesozooplankton | Benedetti et al. (2016) |
|
Candacia spp. Euchaeta spp. |
Mesozooplankton, doliolids, fish larvae, appendicularians | Benedetti et al. (2016) | |
| Oncaeidae | Detritivore | Diatoms, detritus | Kattner et al. (2003) |
| Euterpina acutifrons | Phytodetritus | Sautour & Castel (1993) | |
| Cladocera | |||
| Penilia avirostris | Herbivore | Small diatoms, flagellates, bacteria | Atienza et al. (2006); Paffenhöfer & Orcutt (1986); Turner et al. (1988) |
|
Pleopis polyphemoides Podon intermedius |
Large diatoms | Jagger et al. (1988); Kim et al. (1989) | |
|
Evadne spinifera Pseudevadne tergestina |
Omnivore | Phytoplankton, microzooplankton | Kim et al. (1989); Marazzo & Valentin (2001); Nival & Ravera (1979) |
| Chaetognatha | Carnivore | Mesozooplankton, gelata | Kehayias (2003); Purcell et al. (2004) |
| Decapoda (larvae) | Herbivore, omnivore, carnivore | Jones et al. (1997) | |
| Cirripedia (larvae) | Herbivore | Particles <8 μm | Gauld (1959) |
| Ichthyoplankton | Their own yolk sac | ||
| Siphonophorae | Carnivore | Small mesozooplankton | Purcell (1981) |
- a This genus is often found associated with pelagic tunicates, but we have included it in the “omnivores” category because accurate information about his diet is lacking.
2.4 Stable isotope determination
Freeze-dried filters with POM, fine and homogenized powder of phytoplankton, bulk mesozooplankton, and mesozooplankton groups (2.0 ± 0.1 mg of each sample) were packed into aluminum tin capsules and sent to the Stable Isotope Facility at the University of California in Davis (USA) for δ13C and δ15N determination.
Stable isotope values were determined using a PDZ Europa ANCA-GSL elemental analyzer interfaced with a PDZ Europa 20–20 isotope ratio mass spectrometer (Sercon Ltd.) with an instrumental precision of ±0.02‰ for δ13C and ± 0.03‰ for δ15N. The final δ13C and δ15N were expressed relative to the international standards Vienna Pee Dee Belemnite (VPDB) for carbon and air for nitrogen, according to the formula δ13C or δ15N = [(Rsample / Rstandard) − 1] × 103, where R is the ratio of heavy-to-light isotopes (13C/12C or 15N/14N) in the sample (Rsample) and in the standard (Rstandard).
Because lipids contain a high proportion of light carbon stable isotopes (DeNiro & Epstein, 1977), δ13C of samples with C:N > 3.5 need to be corrected for an unbiased interpretation of carbon stable isotope values (Post et al., 2007). Since average C:N ratios were 7.0 ± 0.6 in POM, 7.4 ± 1.1 in phytoplankton, and 4.4 ± 0.5 in bulk mesozooplankton, δ13C of POM and phytoplankton were normalized using the equation suggested by Post et al. (2007), owing to the lack of a specific correction, while the equation by Smyntek et al. (2007) was applied to mesozooplankton (bulk and sorted groups) for which it was specifically calculated.
2.5 Data analysis
Temporal variations in corrected δ13C and δ15N were defined in POM, phytoplankton, and mesozooplankton (bulk and sorted groups) by performing one-way and two-way analyses of variance (ANOVAs) across months and seasons, after testing the data for normality (Shapiro test) and homoscedasticity (Breusch-Pagan test). Significant differences were determined using pairwise post-hoc comparisons (Tukey's HSD).
All statistical tests were performed using RStudio (RStudio, 2016), and the significance was set at p-value ≤ .05.
3 RESULTS
3.1 Temporal variability of carbon and nitrogen stable isotope ratios
Stable isotope values were determined weekly in POM (n = 21), phytoplankton (n = 24), and bulk mesozooplankton (n = 32), and monthly in mesozooplankton groups (n = 97), because sorted organisms had to be pooled to ensure sufficient organic matter for stable isotope determination. Yearly averages were −19.4 ± 1.6‰, −16.6 ± 1.1‰, and −20.2 ± 1.1‰ for corrected δ13C and 4.4 ± 1.8‰, 5.0 ± 1.1‰, and 5.5 ± 0.8‰ for δ15N in POM, phytoplankton, and bulk mesozooplankton, respectively. The δ13C values ranged from −21.8‰ to −16.9‰ in POM and from −18.5‰ to −14.8‰ in phytoplankton, with a weekly oscillation of approximately ± 4‰ in POM and ± 2‰ in phytoplankton (Figure 2a,b), which is more than the variation expected for a trophic level (Table S2). In contrast, δ13C of bulk mesozooplankton ranged from −22.9‰ to −18.2‰ and changed smoothly on a weekly scale (Figure 2c). A statistical test could not be performed on weekly data because a single value was available per week.
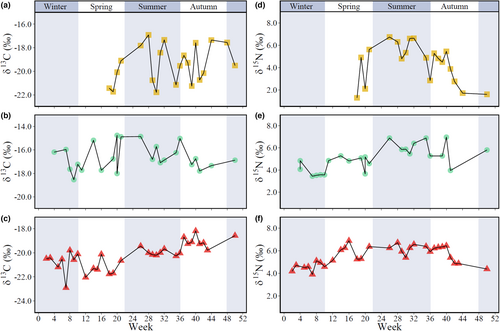
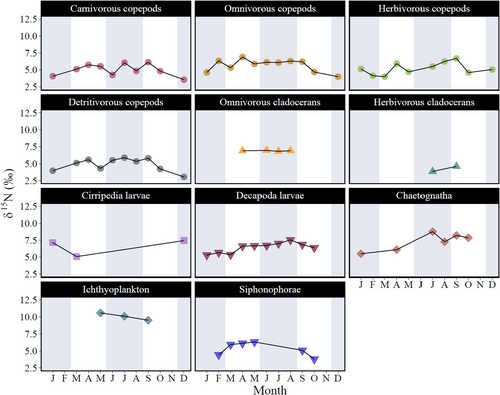
Over the monthly and seasonal scales, variations in δ13C were statistically significant only in bulk mesozooplankton, with values increasing by approximately 1‰ from winter to autumn (Table 2). In mesozooplankton groups, δ13C ranged from −21.2 ± 0.6‰ in detritivorous copepods to −17.6 ± 0.2‰ in cirriped larvae (Table S3). Most mesozooplankton groups had consistent δ13C values throughout the seasons, except for decapod larvae, which showed a significant increase in δ13C from spring to summer (Table 3, Figure 3).
| Group | Df | Sum of Sq | Mean Sq | F-value | p-Value | |
|---|---|---|---|---|---|---|
| δ13C | ||||||
| POM | Season | 3 | 6.70 | 2.23 | 0.70 | .57 |
| Month | 5 | 6.80 | 1.39 | 0.44 | .81 | |
| Phytoplankton | Season | 3 | 1.16 | 0.39 | 0.30 | .82 |
| Month | 7 | 10.06 | 1.44 | 1.12 | .41 | |
| Bulk mesozooplankton | Season | 3 | 16.64 | 5.55 | 9.15 | <.001* |
|
Tukey HSD: p-value = .01 (winter–autumn) p-value < .001 (spring–autumn) p-value = .04 (spring–summer) |
||||||
| Month | 7 | 5.21 | 0.74 | 1.23 | .33 | |
| δ15N | ||||||
| POM | Season | 3 | 28.84 | 9.61 | 6.86 | .006* |
|
Tukey HSD: p-value = .046 (winter–summer) p-value = .049 (spring–summer) p-value = .048 (summer–autumn) |
||||||
| Month | 4 | 13.70 | 3.42 | 2.44 | .10 | |
| Phytoplankton | Season | 3 | 13.96 | 4.65 | 10.12 | .001* |
|
Tukey HSD: p-value = .007 (winter–summer) p-value = .005 (spring–summer) |
||||||
| Month | 7 | 8.45 | 1.21 | 2.62 | .06 | |
| Bulk mesozooplankton | Season | 3 | 11.92 | 3.97 | 18.17 | <.001* |
|
Tukey HSD: p-value = .002 (winter–spring) p-value ≤ .001 (winter–summer) p-value = .001 (winter–autumn) |
||||||
| Month | 7 | 5.09 | 0.73 | 3.33 | .02* | |
|
Tukey HSD p-value = .001 (January–April) p-value = .020 (January–May) p-value = .040 (January–June) p-value = .002 (January–July) |
||||||
|
p-value = .001 (January–August) p-value = .001 (January–September) p-value = .020 (February–August) p-value = .030 (February–September) |
||||||
- Note: Significant differences are in bold (p-value ≤ .05). Pairwise post-hoc Tukey HSD comparisons were performed for significantly different months or seasons.
- Abbreviations: Df, degrees of freedom; Sq, squares.
| Group | Df | δ13C | δ15N | ||||||
|---|---|---|---|---|---|---|---|---|---|
| Sum of Sq | Mean Sq | F-value | p-Value | Sum of Sq | Mean Sq | F-value | p-Value | ||
| Copepoda | |||||||||
| Carnivorous | 3 | 0.70 | 0.23 | 0.66 | .60 | 3.88 | 1.29 | 2.67 | .14 |
| Omnivorous | 3 | 2.59 | 0.86 | 1.88 | .17 | 4.81 | 1.60 | 2.20 | .13 |
| Herbivorous | 3 | 6.81 | 2.27 | 4.50 | .06 | 2.16 | 0.72 | 0.88 | .51 |
| Detritivorous | 3 | 3.78 | 1.26 | 3.63 | .08 | 5.31 | 1.78 | 3.98 | .07 |
| Decapoda (larvae) | 3 | 3.59 | 1.20 | 5.10 | .04* | 3.26 | 1.09 | 3.99 | .07 |
| Tukey HSD: p-value = .05 (spring-autumn) | |||||||||
| Chaetognatha | 3 | 1.20 | 0.40 | 3.83 | .21 | 6.75 | 2.25 | 3.84 | .21 |
| Ichthyoplankton | 2 | 0.05 | 0.03 | 0.05 | .95 | 0.83 | 0.41 | 0.06 | .94 |
| Siphonophorae | 3 | 0.37 | 0.37 | 6.29 | .07 | 5.11 | 2.13 | 2.79 | .17 |
- Note: Significant differences are in bold (p-value ≤ .05). Pairwise post-hoc Tukey HSD comparisons were performed for significantly different seasons.
- Abbreviations: Df, degrees of freedom; Sq, squares.
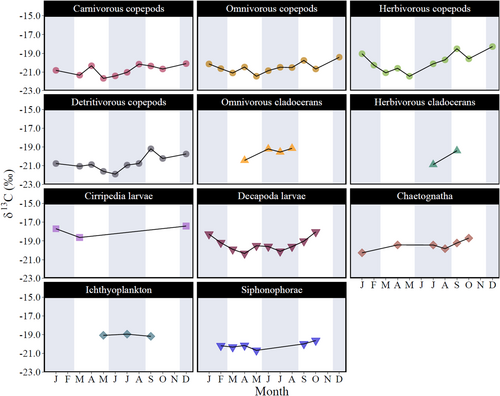
δ15N changed significantly across seasons within the three size fractions (Table 2, Figure 2). Significantly higher values were determined during summer in POM (5.9 ± 0.9‰), phytoplankton (6.2 ± 0.5‰), and bulk mesozooplankton (6.2 ± 0.4‰; Table S3). The δ15N values of mesozooplankton groups ranged from 3.5 ± 0.7‰ in detritivorous copepods to 10.1 ± 1.9‰ in ichthyoplankton (Table S3) and did not vary significantly across seasons, except for decapod larvae, for which the level of significance was at the threshold (Table 3, Figure 4).
3.2 Trophic niches and dietary composition of mesozooplankton groups
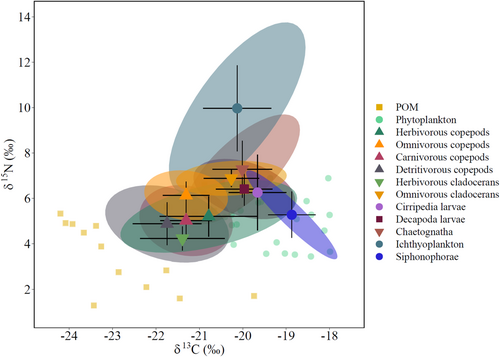
Overall, mesozooplankton groups had a mean Standard Ellipse Area corrected for small sample size (SEAc) ranging between 0.1‰ and 2.9‰ (Table 4). The SIBER ellipses calculated for each group across 2019 showed a high degree of overlap (Figure 5). The trophic niche of siphonophores showed the lowest overlap with the other groups and was stretched along the x-axis, whereas the trophic niche of icthyoplankton stretched along the y-axis, set completely outside the cluster of the overlapping mesozooplankton niches.
| Group | Mean | Credible intervals | ||
|---|---|---|---|---|
| 50% | 95% | 99% | ||
| Copepoda | ||||
| Herbivorous | 2.9 | 2.0–3.1 | 1.3–4.9 | 1.0–6.4 |
| Omnivorous | 2.2 | 1.7–2.3 | 1.2–3.2 | 1.1–3.6 |
| Carnivorous | 1.7 | 1.1–1.7 | 0.7–2.8 | 0.6–3.7 |
| Detritivorous | 2.6 | 1.7–2.7 | 1.2–4.5 | 0.9–5.9 |
| Cladocera | ||||
| Herbivorous | 0.1 | 0.4–0.9 | 0.2–2.2 | 0.1–3.2 |
| Omnivorous | 0.8 | 0.4–0.7 | 0.2–1.6 | 0.1–2.5 |
| Other groups | ||||
| Cirripedia (larvae) | 0.3 | 0.8–1.4 | 0.4–2.6 | 0.2–4.0 |
| Decapoda (larvae) | 1.8 | 1.2–1.9 | 0.7–3.0 | 0.6–3.8 |
| Chaetognatha | 2.0 | 1.2–2.1 | 0.7–4.2 | 0.5–6.1 |
| Ichthyoplankton | 0.9 | 1.2–2.3 | 0.7–5.0 | 0.4–7.3 |
| Siphonophorae | 0.8 | 0.5–1.0 | 0.3–2.0 | 0.2–2.5 |
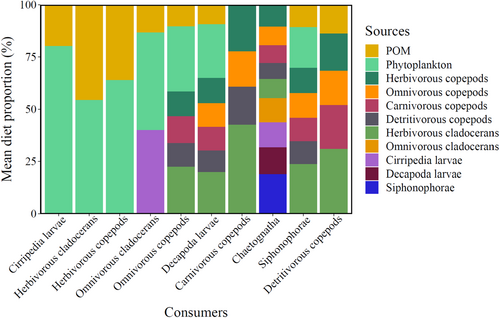
In agreement with the overlap shown by the SIBER ellipses, MixSIAR models indicated that most mesozooplankton groups had mixed dietary compositions (Figure 6, Table S4). Predominantly herbivorous copepods and cirriped larvae fed mainly on phytoplankton, whereas herbivorous cladocerans fed on a diet composed of POM and phytoplankton. Most other mesozooplankton groups exhibited a high degree of omnivory by preying upon a variety of mesozooplankton organisms, as well as POM and phytoplankton in minor proportions. Only chaetognaths and carnivorous copepods had strictly carnivorous diets. Although detritivorous copepods are not known to prey directly on other copepods or cladocerans, stable isotope values indicated that these groups were likely to be included in their dietary composition. The resulting mixing model highlighted a contribution ranging from 16% to 30% of other copepod groups and herbivorous cladocerans to their diet. Predominantly herbivorous copepods and herbivorous cladocerans were part of the dietary composition of all other mesozooplankton groups, except for omnivorous cladocerans, which mainly fed on phytoplankton and cirriped larvae. Siphonophores accounted for approximately 19% of the chaetognath diets but were not preyed upon by any other mesozooplankton group.
3.3 Trophic levels and interactions within the planktonic community
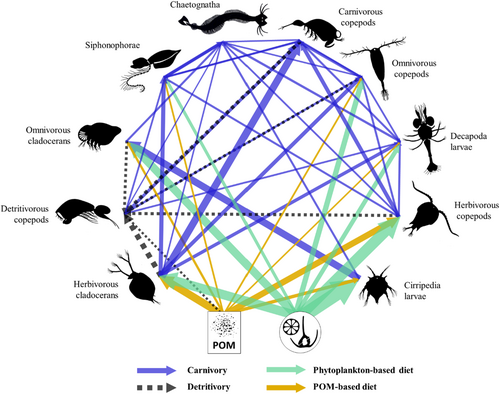
The planktonic food web diagram, based on dietary proportions determined using MixSIAR models, resulted in a complex network of trophic interactions among mesozooplankton groups (Figure 7). POM and phytoplankton were the main sources that supported, directly and/or indirectly, all mesozooplankton groups.
The mesozooplankton groups had TLs falling between 1.0 and 4.0 (Table 5). Overall, TLs did not vary more than 0.5 ± 0.2 across seasons, although the increase of δ15N in POM during spring and summer resulted in a generally lower TL of mesozooplankton groups during these seasons because their δ15N remained consistent in time, as illustrated above. Herbivorous cladocerans were at the lowest trophic level (0.1–1.3), whereas ichthyoplankton (fish eggs and early larval stages) had the highest TL (2.8–4.0). All copepod groups had remarkably lower TL in summer than in winter. Chaetognaths, decapod larvae, and cirriped larvae exhibited high TLs just below the ichthyoplankton.
| Group | Winter | Spring | Summer | Autumn |
|---|---|---|---|---|
| POM | 1.0 | 1.0 ± 0.9 | 1.0 ± 0.4 | 1.0 ± 0.6 |
| Phytoplankton | 2.1 ± 0.5a | 1.4 ± 0.3b | 1.1 ± 0.3b | 1.6 ± 0.5ab |
| Copepoda | ||||
| Herbivorous | 2.4 ± 0.2a | 1.6 ± 0.4ab | 1.0 ± 0.2b | 1.7 ± 0.6ab |
| Omnivorous | 2.4 ± 0.4a | 2.1 ± 0.4ac | 1.1 ± 0.2bc | 1.6 ± 0.4c |
| Carnivorous | 1.9 ± 0.2a | 1.8 ± 0.1a | 0.6 ± 0.4b | 1.7 ± 0.4a |
| Detritivorous | 1.8 ± 0.3a | 1.6 ± 0.3ab | 0.9 ± 0.1b | 1.5 ± 0.5ab |
| Cladocera | ||||
| Herbivorous | 0.1 | 1.3 | ||
| Omnivorous | 2.5 | 1.4 ± 0.2 | ||
| Other groups | ||||
| Cirripedia (larvae) | 3.5 | 1.7 | ||
| Decapoda (larvae) | 2.7 ± 0.1a | 2.2 ± 0.3a | 1.5 ± 0.2b | 2.2 ± 0.1ab |
| Chaetognatha | 2.7 | 2.1 | 1.9 ± 0.4 | 2.8 ± 0.1 |
| Ichthyoplankton | 4.0 | 2.8 ± 0.8 | 3.4 ± 1.4 | |
| Siphonophorae | 1.9 ± 0.4 | 1.2 ± 0.4 | ||
- Note: Different superscript letters (a,b) indicate significant differences (p-value ≤ .05) tested using Tukey post-hoc pairwise comparisons after one-way analyses of variance (ANOVAs) across seasons.
4 DISCUSSION
This study is the first attempt to define the trophic structure and interactions within plankton communities in the GoN, where plankton diversity, abundance, and temporal variability have been widely analysed during the almost 40 years of research at the LTER-MC site. Our results highlight that the planktonic food web buffers the natural environmental variability of inputs through a complex network of trophic interactions shaped by feeding regimes pointing to omnivory in several mesozooplankton groups. This study paves the way for monitoring the effects of climate- and anthropogenically driven changes on planktonic food webs in coastal systems.
4.1 Temporal patterns of stable isotope ratios
The 1-year series of δ13C and δ15N determined in POM indicated a consistent alternation between low and high values, which are typically found in offshore and coastal waters, respectively, keeping into account that δ13C values were normalized for lipid content in the present study, while they were not in others (e.g., Harmelin-Vivien et al., 2008, 2010; Hunt et al., 2017). Offshore waters usually have low δ13C and δ15N (Kurle & McWhorter, 2017; MacKenzie et al., 2014) because atmospheric nitrogen is the main source of N, which undergoes little fractionation during biological uptake by primary producers (Mompeán et al., 2013; Montoya et al., 2004). Carbon is recycled within pelagic systems and goes through a process of fractionation toward lighter isotopes (Fry, 2006). Conversely, coastal waters receive inputs from rivers and coastal runoff, which result in a high content of heavy C and N isotopes (Fry, 2006), leading to higher values of δ13C and δ15N in coastal primary producers (Harmelin-Vivien et al., 2010).
The pattern observed in δ13C and δ15N of POM matches the hydrographic (salinity) and biological (chlorophyll a) features of the offshore and coastal water masses identified at the LTER-MC site. The two water masses can be discriminated on the basis of their higher salinity and lower chlorophyll a in offshore waters compared to coastal waters (Cianelli et al., 2017; Kokoszka et al., 2022). Therefore, we suggest that the distinctly high and low δ13C and δ15N determined in the present study are indicative of the offshore and coastal water masses alternatively dominating at LTER-MC, whereas intermediate δ13C and δ15N likely reflect diverse mixing phases between the two water masses.
The different amplitudes observed between similar patterns of POM and phytoplankton may be explained by the fact that the phytoplankton community at LTER-MC is dominated by diatoms and dinoflagellates of coastal origin (D'Alelio et al., 2015; Ribera d'Alcalà et al., 2004). Therefore, phytoplankton incorporate δ13C and δ15N from offshore waters, which slightly decrease their coastal stable isotope signatures. Although POM was collected below the surface while the phytoplankton net was deployed along the whole water column, phytoplankton was most abundant above the thermocline at LTER-MC (Zingone et al., 1990), therefore changes in the stable isotope signature likely reflect changes in phytoplankton exposed to diverse water masses.
Similar to phytoplankton, the mesozooplankton community at LTER-MC includes mainly coastal species, with a limited number of offshore species (Mazzocchi et al., 2023; Ribera d'Alcalà et al., 2004). In contrast to phytoplankton, mesozooplankton do not incorporate δ13C and δ15N directly from water but indirectly through POM, phytoplankton, and other mesozooplankton. In addition to the fractionation process during assimilation, turnover rates of mesozooplankton organisms, which range from 1 week to 2 months (Frazer et al., 1997; Gorokhova & Hansson, 2011; Tamelander et al., 2006) may reduce the amplitude of the oscillation between high and low stable isotope values and determine a slight temporal mismatch between the patterns in primary producers (POM and phytoplankton) and bulk mesozooplankton.
Scaling up to a longer time scale, we detected a seasonal increase of δ15N in POM, phytoplankton, and bulk zooplankton, but not in mesozooplankton groups. The increase in δ15N at the base of the food web during spring and summer may be attributed to a combination of hydrographic features and plankton community composition. Starting from spring and during summer, a stable thermocline at 8–10 m depth increases the recirculation of coastal waters at the LTER-MC site (Uttieri et al., 2011). The retention of coastal waters may result in an increased amount of nutrients with high δ15N values available to primary producers. Regarding planktonic community composition, Ribera d'Alcalà et al. (2004) reported changes at the seasonal scale, with peaks in chlorophyll a and diatom blooms in late spring and summer, which directly uptake N with heavy isotopic composition from water, explaining the synchronic increase of δ15N in primary producers.
The increase in δ15N displayed by bulk mesozooplankton during spring and summer, which was not shown by the trend of single groups, may be due to changes in community composition over time. The abundance of the diverse groups differed across seasons, with some groups totally absent in some seasons but highly abundant in others (e.g., cladocerans), and species abundance varied within each group as well (Table S1). Mesozooplankton variability has already been reported in previous studies (Mazzocchi et al., 2023; Ribera d'Alcalà et al., 2004), but the δ13C and δ15N values determined in the present study highlight that the stable isotope signature of groups remains consistent over time beyond their species composition and abundance. The relevance of this pattern to the trophic structure of the community is discussed in detail in the next subsection.
While δ13C and δ15N are usually not determined on a weekly scale and comparative studies with ours are lacking, the seasonal increase in δ15N has been recorded in other areas of the Mediterranean Sea. Similar results were obtained in the Ligurian-Provençal basin, where δ15N of the planktonic fractions corresponding to our POM and phytoplankton increased significantly in spring and summer, whereas the zooplankton fractions that collectively correspond to our bulk mesozooplankton showed consistent values across seasons (Hunt et al., 2017). In contrast, the discharge of suspended particulate matter and organic N in the Rhone River caused the opposite seasonality of δ15N in POM within the Gulf of Lion, with higher values in November than in May (Harmelin-Vivien et al., 2010). The GoN lacks inputs from a large river, but the effect of coastal runoff on nutrient origin and availability, recently highlighted by Romillac et al. (2023), may be relevant for carbon and nitrogen stable isotopes entering the food web in the GoN through primary producers.
4.2 Trophic structure of the planktonic community
The high degree of overlap among trophic niches of mesozooplankton points to an unexpected similarity of resource use, considering that grouping was based either on known and potentially different feeding regimes for copepods and cladocerans or taxonomy for groups with a limited variety of feeding habits. Copepods are an effective example of how stable isotopes have highlighted a potentially wider dietary composition than expected from the literature. The comparable values of SEAc among the trophic niches of predominantly herbivores, detritivores, and omnivores suggest a similarity in their dietary compositions beyond the assigned labels. In comparison, the SEAc of carnivorous copepods was smaller, which indicates a more restricted diet, whereas herbivorous cladocerans and cirriped larvae displayed the smallest trophic niche areas, in agreement with their known specialized feeding regimes. However, the similarity of stable isotope signatures among groups limited our ability to identify additional potential prey of predominantly herbivorous copepods, whereas the MixSIAR model for detritivorous copepods, which includes a wider range of prey, is an attempt to move toward the assessment of complex trophic linkages among mesozooplankton groups.
Overall, our findings are in line with the results of recent studies in the Mediterranean Sea, which classified all non–carnivorous copepods as omnivorous, with a tendency toward herbivory, carnivory, or detritivory (Benedetti et al., 2016; Fanelli et al., 2022). These studies and the present one highlight that labels commonly used such as “herbivorous” or “carnivorous” and “detritivorous” may not reflect accurately the dietary composition of most mesozooplankton groups and rather suggest a trophic gradient from herbivory toward strict carnivory, with omnivory being by far the most common feeding habit. The ability of plankton to shift from one feeding regime to another stabilizes the food web (Thompson et al., 2012) and omnivory likely emerges in the GoN as an adaptive behavioral response of plankton against environmental perturbations and minimizes competition for resource use. Plankton communities in the GoN have been previously characterized as resilient at different spatial (Ianora et al., 1985) and temporal scales (Mazzocchi et al., 2012) by maintaining a stable composition despite the variability in environmental conditions and autotrophic biomass across seasons and decades (Mazzocchi et al., 2012, 2023; Zingone et al., 1990, 2022). Likewise, the trophic structure of plankton within the GoN appears to be able to buffer the variability of inputs entering the food web and may help to understand the effects of perturbations due to climate change and anthropogenic stressors.
4.3 Methodological considerations
Within the context of a potential mismatch between feeding regimes based on the literature and those defined in the present study, the low TLs, particularly during the summer, may be due to methodological limitations. The calculation of TLs is sensitive to the choice of two parameters: baseline and DTDF. We assumed POM to be the baseline because strictly herbivorous organisms such as herbivorous cladocerans were not available in all seasons, whereas choosing predominantly herbivorous copepods, which were available across all seasons, appeared inconsistent with the considerations made above. However, the increase in δ15N in POM during spring and summer affected the TL calculation by lowering their values during these seasons. As for DTDFs, their variability is high among organisms, and their availability in published dataset is very limited and often outdated, particularly for zooplankton (McCutchan et al., 2003; Vanderklift & Ponsard, 2003). Although we conducted a thorough literature search and used average DTDFs, we were still unable to limit the potential bias introduced by applying a single DTDF to various organisms with diverse prey types.
In addition to the calculation of TLs, our choice of averaging DTDFs may have affected the dietary determinations performed by the MixSIAR model. Furthermore, the similarity of stable isotope signatures among some groups and the lack of distinct stable isotope values complicate the choice of potential prey to be included into the model built for each group, and likely confused the software. This limitation was noted also by Hunt et al. (2017) for dietary reconstructions of zooplankton in the Ligurian-Provençal basin, where the model was unable to properly differentiate between pico- and nanoplankton. Despite these methodological limitations, the results from the present and other studies using stable isotopes to define trophic links and structures in zooplankton (e.g., Fanelli et al., 2022; Hunt et al., 2017) contribute to improving our understanding of the response of zooplankton communities to spatial and temporal variability.
ACKNOWLEDGMENTS
Louise Merquiol was supported by a PhD fellowship funded by the Stazione Zoologica Anton Dohrn (Open University—Stazione Zoologica Anton Dohrn PhD Program). We thank Marco Cannavacciuolo, Raffaella Casotti, Fabio Conversano, Iole Di Capua, Roberto Gallia, Francesca Margiotta, Augusto Passarelli, Isabella Percopo, Captain Enzo Rando, Maria Saggiomo, Francesco Terlizzi, Ferdinando Tramontano, and Gianluca Zazo for collecting samples and the Stable Isotope Facility at the University of California in Davis (USA) for stable isotope determinations. This paper is dedicated to the beloved memory of Bruno Scotto di Carlo and Donato Marino, who devoted their lives to study the zooplankton and phytoplankton in the Gulf of Naples.
FUNDING INFORMATION
This work was supported by the Stazione Zoologica Anton Dohrn.
CONFLICT OF INTEREST STATEMENT
The authors declare no conflict of interest.
Open Research
DATA AVAILABILITY STATEMENT
Data used in this study will be available in a public repository upon publication.


