α1-COP modulates plasmodesmata function through sphingolipid enzyme regulation
Edited by: Juan Dong, Rutgers the State University of New Jersey, USA
ABSTRACT
Callose, a β-1,3-glucan plant cell wall polymer, regulates symplasmic channel size at plasmodesmata (PD) and plays a crucial role in a variety of plant processes. However, elucidating the molecular mechanism of PD callose homeostasis is limited. We screened and identified an Arabidopsis mutant plant with excessive callose deposition at PD and found that the mutated gene was α1-COP, a member of the coat protein I (COPI) coatomer complex. We report that loss of function of α1-COP elevates the callose accumulation at PD by affecting subcellular protein localization of callose degradation enzyme PdBG2. This process is linked to the functions of ERH1, an inositol phosphoryl ceramide synthase, and glucosylceramide synthase through physical interactions with the α1-COP protein. Additionally, the loss of function of α1-COP alters the subcellular localization of ERH1 and GCS proteins, resulting in a reduction of GlcCers and GlcHCers molecules, which are key sphingolipid (SL) species for lipid raft formation. Our findings suggest that α1-COP protein, together with SL modifiers controlling lipid raft compositions, regulates the subcellular localization of GPI-anchored PDBG2 proteins, and hence the callose turnover at PD and symplasmic movement of biomolecules. Our findings provide the first key clue to link the COPI-mediated intracellular trafficking pathway to the callose-mediated intercellular signaling pathway through PD.
INTRODUCTION
One of the crucial components in the plant cell is callose, a polysaccharide in the form of β-1,3 glucan located at the cell walls. Callose plays a vital role in controlling the symplasmic permeability of plasmodesmata (PD) and regulates the cell-to-cell movement of signaling molecules. The callose deposition at the neck region of PD controls the symplasmic continuity. Callose is mainly synthesized by callose synthases/glucan synthase-like(s) (CalSs/GSLs) and antagonistically degraded by β-1,3-glucanases as callose degradation enzymes (BGs) (Iswanto and Kim, 2017; Wu et al., 2018; Vu et al., 2022).
Plasmodesmata, the sophisticated symplasmic apertures, are versatile. These intracellular channels play critical roles in numerous multicellular events during plant development by conferring the molecular exchange of transcription factors, RNAs, and plant growth regulators (Zambryski and Crawford, 2000; Iswanto et al., 2021). Previous studies have described that the plasmodesmal plasma membrane (PD-PM) is distinct from common cellular PM in terms of condensed sterols and sphingolipid (SL) molecules (Grison et al., 2015; Iswanto and Kim, 2017). The enrichment of sterols and SL molecules at PM and PD-PM is often known as the membrane microdomains or lipid raft compartments (Mongrand et al., 2010; Tapken and Murphy, 2015; Iswanto and Kim, 2017). Glycosyl inositol phosphoryl ceramides (GIPCs) and glucosyl ceramides (GlcCers) are the most abundant SL molecules found in the PM of the plant cell. Up to 64% of total sphingolipids are GIPCs, and ~25% of the PM lipids in the Arabidopsis thaliana leaf are GIPCs molecules (Markham and Jaworski, 2007; Fang et al., 2016). Several studies have described the roles of lipid rafts in PD regulation, especially by regulating the subcellular localization of GPI-anchored PD proteins (Bayer et al., 2014; Grison et al., 2015; Nicolas et al., 2017; Iswanto et al., 2020).
Coat protein I (COPI) is a coatomer, a transport vesicle-bound protein complex which is responsible for various actions and several distinct secretory pathways, including endoplasmic reticulum (ER)-Golgi anterograde transport, Golgi-ER retrograde transport, intra-Golgi cargo machinery of numerous proteins and maintenance of Golgi function and structural integrity (Pepperkok et al., 1993; Gaynor et al., 1998; Schroder-Kohne et al., 1998; Paul and Frigerio, 2007; Wang et al., 2010; Ahn et al., 2015). COPI is formed of seven subunits (α/β/β′/γ/δ/ε/ζ) which are further grouped into two subcomplexes, the B-subcomplex (α/β′/ε) and F-subcomplex (β/γ/δ/ζ) (Jackson, 2014). In contrast to mammals and yeast studies, there are several isoforms of all the coatomer subunits that have been identified in Arabidopsis, except γ-COP and δ-COP, which contain only one isoform (Donohoe et al., 2007; Gao et al., 2014; Ahn et al., 2015; Woo et al., 2015). A previous study revealed that disruption of ε-COP subunit isoforms impairs the Golgi apparatus integrity and changes the localization of endomembrane proteins (EMPs) in Arabidopsis (Woo et al., 2015). The action of COPI within intracellular trafficking is tightly connected to the cargo molecules containing the dilysine KKXX and KXKXX motifs presented on their C-terminal tail (Schroder-Kohne et al., 1998; Eugster et al., 2004; Jackson et al., 2012; Ma and Goldberg, 2013). Also, the recent study of Arabidopsis α-COP reveals that α2-COP is essential for plant growth and development by maintaining the morphology of the Golgi apparatus through the subcellular localization of a protein harboring dilysine motif, p24δ5 (Gimeno-Ferrer et al., 2017).
Previously, we generated dexamethasone inducible RNAi line of Glucan synthase-like 8 (dsGSL8 RNAi), which is defective in tropism due to the absence of GSL8-induced callose deposition (Han et al., 2014). In this study, ethyl methanesulfonate (EMS) mutagenesis of dsGSL8 RNAi resulted in a mutant that rescued the tropic responses and showed a high PD callose phenotype in Arabidopsis hypocotyls. In this mutant line, the next-generation sequencing-based next-generation mapping (NGM) revealed a point mutation in the AT1G62020 (α1-COP) with a single amino acid substitution. We also found that other T-DNA inserted α1-COP mutants exhibited similar excessive callose phenotype. Moreover, in the α1-cop mutant, the subcellular localization of ERH1 and GCS, which are two SL pathway enzymes with a dilysine motif, were mislocalized. Additionally, the localization of PD-localized β-1,3-glucanase 2 (PdBG2), one of the callose-degrading GPI-anchored enzymes, was also altered in the α1-cop mutant. Here, we provide evidence for the novel function of α1-COP in regulating PD callose deposition through SL pathway enzymes modulation.
RESULTS
Loss of function of α1-COP enhances PD callose depositions
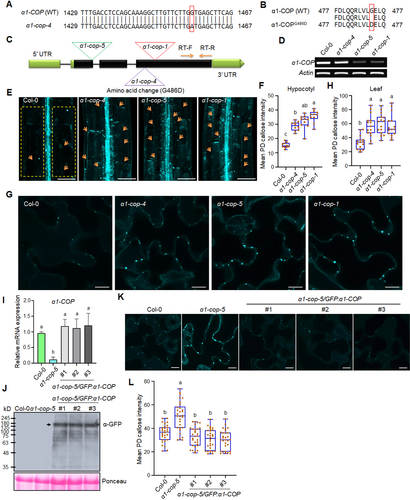
We treated tropism-defective dsGSL8 RNAi plants (Han et al., 2014) with EMS, then we conducted genotypic screening of M2 mutants. We found several dsGSL8 RNAi-EMS lines displayed rescued tropism responses (data not shown). The detailed primary screening method is shown in Figure S1. We selected one mutant line for subsequent analyses. NGM result predicted the point mutation in the AT1G62020 (α1-COP), with a single amino acid substitution, α1-cop-4 (G486D substitution) (Figures 1A, B, S2A), and this mutant line is still carrying the dsGSL8 RNAi construct (Figure S2B). For further study, we characterized two more mutants of α1-COP, α1-cop-1 (SALK_078465) and α1-cop-5 (SALK_003425), which have the T-DNA insertion at different positions of the gene and showed low transcript abundance (Figure 1C, D). Phototropic response by Arabidopsis hypocotyl is associated with callose-dependent modulation of PD permeability (Han et al., 2014). Hence, we conducted a PD permeability assessment using the 8-hydroxypyrene-1, 3, 6-trisulfonic acid trisodium salt (HPTS) dye movement assay for these mutants. The HPTS movement analysis was conducted at 3-d-etiolated seedlings of wild-type Col-0 and α1-cop mutant plants. Interestingly, three independent alleles of α1-cop mutants show reduced HPTS diffusions compared to wild-type Col-0 (Figure S2C, D). To test whether this PD permeability alteration is linked to the callose depositions, aniline blue staining was done to check the PD callose level in etiolated seedlings and rosette leaves of Arabidopsis wild-type Col-0 and α1-cop mutant plants. We found that α1-cop mutant plants showed elevated callose levels in both hypocotyl and Arabidopsis rosette leaves (Figure 1E–H).
Callose accumulation is increased in the α1-cop mutants
(A) Nucleotide sequence alignment of α1-COP WT (wild-type Col-0) and α1-COP ethyl methanesulfonate (EMS) mutant. The red box indicates a single nucleotide mutation (G to A). (B) Amino acid (AA) sequence alignment of α1-COP WT and α1-COPG486D (EMS mutant). The red box indicates a single AA mutation (G to D). (C) Gene structure of α1-COP with three allele mutations. α1-cop-4 was generated from EMS mutation and identified by next-generation sequencing (NGS)-based mapping. α1-cop-1 and α1-cop-5 were collected from the Arabidopsis Biological Resource Center as T-DNA insertions. (D) Reverse transcription - polymerase chain reaction (RT-PCR) analysis from WT and α1-cop mutants. One-pair primer was designed at the C-terminal domain close to 3′ untranslated region, as shown in the figure (A). (E) Representative images of plasmodesmata (PD) callose analysis in the Arabidopsis hypocotyls of WT Col-0 and α1-cop mutants. Scale bars: 100 µm. (F) Quantification of PD callose intensity (E) (n = 10). (G) Representative images of PD callose analysis in the Arabidopsis rosette leaves of WT Col-0 and α1-cop mutants. Scale bars: 10 µm. (H) Quantification of PD callose intensity (G) (n = 15). (I) Quantitative RT-PCR analyses of α1-COP transcripts after normalization against two reference transcripts (Actin and EF-1α) in total RNA samples of Arabidopsis seedlings from each genotype, Col-0 WT, α1-cop-5 mutant and α1-cop-5/GFP:α1-COP complementation lines. (J) Detection of green fluorescent protein (GFP):α1-COP fusion protein in the three independent complementation lines. The samples (Col-0, α1-cop-5, α1-cop-5/GFP:α1-COP#1, #2, #3) were subjected to immunoblot analyses using an anti-GFP antibody. Rubisco is served as a loading control. Black arrow indicates the expression of GFP:α1-COP. (K) Representative images of PD callose analysis in the Arabidopsis rosette leaves of WT Col-0, α1-cop-5 mutant, and α1-cop-5/GFP:α1-COP complementation lines. Scale bars: 10 µm. (L) Quantification of PD callose intensity (K) (n = 30). All three independent biological experiments were performed and statistical significances were done by one-way analysis of variance with the Tukey–Kramer test (F, H, J, L). Yellow square dotted lines (E) were designated as region of interest (ROI) for measuring PD callose intensity.
To further confirm if the loss of α1-COP function is highly associated with PD callose accumulation, we carried out a complementation assay by stably expressing p35S::GFP:α1-COP in α1-cop-5. Three independent T3 homozygous Arabidopsis transgenic lines showing similar transgene expression levels compared to endogenous α1-COP (Figure 1I) were selected, and the green fluorescent protein (GFP):α1-COP expression was also evaluated by western blotting (Figure 1J). As predicted, the expression of the GFP:α1-COP protein compromised the excessive PD callose level in the α1-cop-5 (Figure 1K, L). We also generated transgenic plants overexpressing α1-COP (α1-COP-OE#2 and α1-COP-OE#3) in the wild-type Col-0 background (Figure S3A) and subsequently tested for PD permeability analysis. α1-COP overexpression plants exhibited more substantial HPTS diffusion and less PD callose accumulation compared with wild-type Col-0 (Figure S3B, C). We also checked the phototropism phenotype from α1-cop mutants and α1-COP overexpression plants. Consistent with our initial mutant screening, three independent α1-cop mutants showed faster phototropism and more increased curvature angle than wild-type. Conversely, the hypocotyl curvature angle was attenuated in the α1-COP overexpression plants in comparison to the wild-type Col-0 and GSL8 overexpression plants (Figure S3D, E). In Arabidopsis, there are two isoforms of α-COP proteins, and it has been reported that α2-COP protein is critical for plant growth and development by regulating the secretory pathway of p24δ5 protein as well as maintaining the morphology of the Golgi apparatus (Gimeno-Ferrer et al., 2017). Next, to see any redundant role of α2-COP in controlling callose-mediated PD permeability, the PD callose level and phototropism were analyzed. Two independent α2-cop mutants showed a similar level of callose deposition and tropic response compared to wild-type Col-0 (Figure S4A–E), indicating that α2-COP is not involved in the PD callose deposition. In short, our results suggest that α1-COP functions specifically to increase PD permeability by decreasing callose depositions.
α1-COP partially co-localizes with trans-Golgi and PD marker proteins
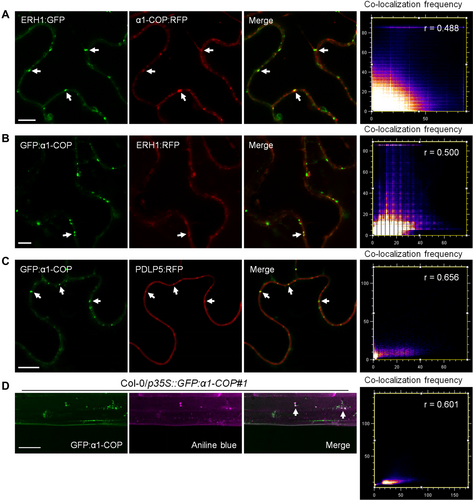
α1-COP is a member of COPI that facilitate retrieval/retrograde transport of numerous proteins from the Golgi to the ER, and for intra-Golgi delivery (Paul and Frigerio, 2007; Ahn et al., 2015). Therefore, to determine if α1-COP is localized at the Golgi compartment, α1-COP fusion proteins with GFP/red fluorescent protein (RFP)-tag at either N-terminal or C-terminal positions were generated and transiently expressed in Nicotiana benthamiana epidermal cells. All the configurations and tags showed a similar pattern of fluorescence (Figure S5). Next, we transiently expressed a well-known trans-Golgi protein, ERH1 (Wang et al., 2008), along with α1-COP in N. benthamiana leaves and found both C-terminally RFP-tagged α1-COP and N-terminally GFP-tagged α1-COP were partially co-localized with ERH1 (Figure 2A, B). Interestingly, we detected PD-like punctate fluorescent signals at the cell periphery. To further verify the PD localization, we conducted a co-localization analysis by transiently co-expressing GFP:α1-COP and PLASMODESMATA-LOCATED PROTEIN 5:RFP (PDLP5:RFP), a well-known PD reporter (Thomas et al., 2008). As a result, the green and red fluorescent signals were highly merged (Figure 2C), indicating that α1-COP is potentially located at PD. Next, Arabidopsis transgenic plants expressing GFP:α1-COP were used to validate the subcellular localization of α1-COP. Consistent with transient expression data, green fluorescent signals were highly co-localized with aniline blue-stained PD callose signals (Figure 2D). These results suggest that α1-COP is a PD-localized protein and partially located at trans-Golgi compartment.
α1-COP is localized at plasmodesmata (PD) and partially localized at the trans-Golgi compartment
(A) Confocal images of Nicotiana benthamiana epidermal cells transiently expressing ERH1:GFP (trans-Golgi protein) and α1-COP:RFP. (B) Confocal images of N. benthamiana epidermal cells transiently expressing GFP:α1-COP and ERH1:RFP. (C) Confocal images of N. benthamiana epidermal cells transiently expressing GFP:α1-COP and PDLP5:RFP (PD protein). (D) Arabidopsis hypocotyl transgenic plant expressing GFP:α1-COP stained with aniline blue. The white arrows indicate α1-COP:RFP/GFP:α1-COP accumulated in punctate spots along the cell periphery, co-localized with ERH1:GFP/ERH1:RFP, PDLP5:RFP and PD marker dye aniline blue (A–D). Additionally, co-localization frequency scatter plots, Pearson's coefficient (r) was calculated to evaluate the overlap between α1-COP localizations and ERH1/PDLP5/anile blue localizations (A–D). Scale bars: 10 µm (A–C), Scale bars: 50 µm (D).
α1-COP interacts with sphingolipid enzymes ERH1 and GCS
The primary function of COPI vesicles is to transport proteins and lipids back to the previous compartment along the secretory pathway. Furthermore, transmembrane proteins containing a KKXX or a KXKXX motif on their C-terminal tail are COPI-dependent cargo machinery, which is retrieved from the Golgi apparatus to the ER (Spang, 2013). Several studies in mammals have shown that COPI specifically interacts with SL species (Chaudhary et al., 1998; Contreras et al., 2012). In Arabidopsis, several well-known SL enzymes such as LONGEVITY ASSURANCE GENE ONE HOMOLOGs (LOHs), ERH1, and GCS (Wang et al., 2008; Msanne et al., 2015; Xie et al., 2015; Iswanto et al., 2020) have been reported.
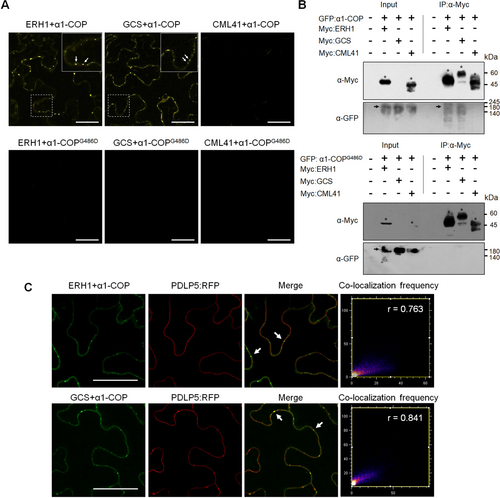
To determine if α1-COP also interacts with SL enzymes in planta, Arabidopsis SL pathway enzymes were analyzed for the presence of dilysine motif at their C-terminal domain. Detailed analysis showed that most of the SL pathway enzymes in Arabidopsis have dilysine motifs, and subsequently, we selected two prominent SL enzymes ERH1 and GCS for further study (Figure S6A). To examine the function of α1-COP at ERH1 and GCS cargo molecules, a bimolecular fluorescence complementation (BiFC) assay was performed. CALMODULIN-LIKE PROTEIN 41 (CML41) was selected as PD-localized negative control protein and used throughout the interaction analyses (Xu et al., 2017). Next, we transiently expressed the sets of BiFC constructs in the N. benthamiana leaves. The BiFC assay showed that α1-COP interacts with ERH1 and GCS (Figure 3A). We further confirmed these interactions using co-immunoprecipitation (Co-IP) analyses. GFP:α1-COP with Myc:ERH1/Myc:GCS/Myc:CML41 were transiently expressed in N. benthamiana leaves. Co-IP followed by immunoblot analyses exhibited that α1-COP interacts with ERH1 and GCS (Figure 3B). The fluorescent signals from the BiFC assays using α1-COP and ERH1/GCS were detected at the entire cell periphery, along with some PD-like punctate spots (Figure 3A). Further, we validated the PD localization by transiently expressing two sets of BiFC constructs in N. benthamiana leaves; (ERH1:nVenus and α1-COP:cVenus, GCS:nVenus and α1-COP:cVenus) along with PDLP5:RFP. Interestingly, the Venus fluorescence punctate signals on the cell periphery depicted from the interaction between α1-COP and ERH1/GCS showed co-localization with PDLP5:RFP, indicating PD localization of α1-COP interactions (Figure 3C). These results confirm that α1-COP interacts with ERH1 and GCS at the cell periphery along with PD.
α1-COP interacts with ERH1 and GCS
(A) Bimolecular fluorescence complementation (BiFC) assay of the interactions between α1-COP and ERH1/GCS/CML41 and α1-COPG486D and ERH1/GCS/CML41. Various combinations of BiFC vectors were transiently expressed in Nicotiana benthamiana leaves. The infiltrated leaves were subjected to confocal imaging at 3 d post-infiltration. The combinations of α1-COP and CML41, α1-COPG486 and CML41 were selected as negative controls. White arrows indicate the yellow fluorescent signals are located at the cell periphery and show plasmodesmata (PD)-like punctate spots. Three biological replicates were performed for each sample. Scale bars: 50 µm. (B) Co-immunoprecipitation (Co-IP) analysis of the interaction between α1-COP or α1-COPG486D with ERH1 and GCS. Various combinations of Myc-ERH1/GFP-α1-COP, Myc-GCS/GFP-α1-COP, Myc-CML41/GFP-α1-COP (negative control), Myc-ERH1/GFP-α1-COPG486D, Myc-GCS/GFP-α1-COPG486D, Myc-CML41/GFP-α1-COPG486D (negative control) were transiently expressed in N. benthamiana leaves. The extracted proteins were immunoprecipitated with anti-Myc. Co-IP of GFP-α1-COP or GFP-α1-COPG486D was detected by western blot using anti-GFP antibody. Asterisks indicate the expected protein sizes of Myc-ERH1, Myc-GCS and Myc-CML41, whereas black arrows indicate the expected protein sizes of GFP-α1-COP and GFP-α1-COPG486D. This experiment was repeated three times. (C) α1-COP, ERH1 and GCS interaction signals highly overlap with PLASMODESMATA-LOCATED PROTEIN 5 (PDLP5). Confocal images of Nicotiana benthamiana leaves agro-infiltrated with BiFC constructs of ERH1:Venus-N, GCS:Venus-N, and α1-COP:Venus-C (co-expressed with PDLP5-RFP). Green fluorescence resulting from the interactions of ERH1 and α1-COP, GCS and α1-COP was observed at the cell periphery. White arrows illustrate the green spots co-localize with the red spots emitted by red fluorescent protein (RFP)-labeled PDLP5. Three biological replicates were performed for each sample. Co-localization frequency scatter plots, Pearson's coefficient (r) was calculated to evaluate the overlap between BiFC and PDLP5 fluorescent signals. Scale bars: 50 µm.
Single amino acid substitution of α1-COP affects its interaction with ERH1 and GCS
In yeast, a single amino substitution at the N-terminal domain of α1-COP has shown several defective phenotypes in the intracellular transports of dilysine cargo molecules (Schroder-Kohne et al., 1998; Eugster et al., 2000; Kim et al., 2011). Next, to determine the effect of the α1-COPG486D single amino substitution mutant at ERH1 and GCS interactions, EMS mutated α1-COPG486D was amplified and cloned. First, the mutant version of α1-COP was fused to GFP (p35S::GFP:α1-COPG486D) (Figure S6B) to check the subcellular localization. The GFP:α1-COPG486D and α1-COP:RFP were transiently co-expressed in N. benthamiana leaves. Confocal images showed that α1-COPG486D was highly co-localized with wild-type α1-COP (Figure S6C). This result indicates that a single amino substitution (G486D) at the N-terminal of α1-COP does not change its subcellular localization.
Next, a BiFC assay was performed to analyze the effect of single amino substitution on the α1-COPG486D interactions with ERH1 and GCS. Three sets of constructs (ERH1:nVenus and α1-COPG486DcVenus, GCS:nVenus and α1-COPG486D:cVenus, CML41:nVenus and α1-COPG486D:cVenus) were transiently expressed in N. benthamiana leaves separately. Surprisingly, no interactions with ERH1 or GCS were observed by BiFC (Figure 3A). We further validated the BiFC data using a Co-IP assay. GFP:α1-COPG486D with Myc:ERH1/Myc:GCS/Myc:CML41 were transiently expressed in N. benthamiana leaves. Co-IP followed by immunoblot analyses showed that α1-COP does not interact with ERH1 and GCS (Figure 3B). The BiFC data agree with Co-IP data, validating that α1-COPG486D does not interact with ERH1 and GCS. Together, these data suggest that glycine residue at 486 aa in α1-COP plays a critical role in maintaining the physical interactions with ERH1 and GCS.
Loss of function of α1-COP alters the subcellular localization of ERH1 and GCS
Previously it was reported that the reduction in the COPI complex had favored the mislocalization of cholesterol, sphingolipids, Rac1, and Cdc42 away from the PM into the cytoplasmic compartment in the animal system (Misselwitz et al., 2011). Similarly, the cellular localization of AtERH1 in the absence of α1-COP was tested. As α1-COP partially localized at PD, there may be a probability that its interacting SL modifier ERH1 also confines to similar cellular loci. To check this possibility, ERH1:GFP and PDLP5:RFP were transiently co-expressed in N. benthamiana leaves. The GFP fluorescence signals were partially co-localized with RFP fluorescence signals (Figure 4A). Also, the stable transgenic plants overexpressing ERH1:GFP in the wild-type Col-0 and α1-cop-5 plants were generated. Consistent with transient expression, wild-type Col-0 plants overexpressing ERH1:GFP showed PD-like peripheral punctate spots (Figure S7A) and these peripheral punctate spots were partially co-localized with aniline blue signals (Figure 4B), which further validated the potential PD localization of ERH1. Surprisingly, ERH1 was mislocalized in the absence of α1-COP protein; it lacked the PD-like punctate spots and was mainly accumulated in the cell periphery and cytoplasm (Figure S7B). Further, we confirmed that the cytoplasmic ERH1:GFP signals in the α1-cop-5 plant did not co-localize with aniline blue signals (Figure 4C). These results indicate that α1-COP is required for ERH1 localization at PD.
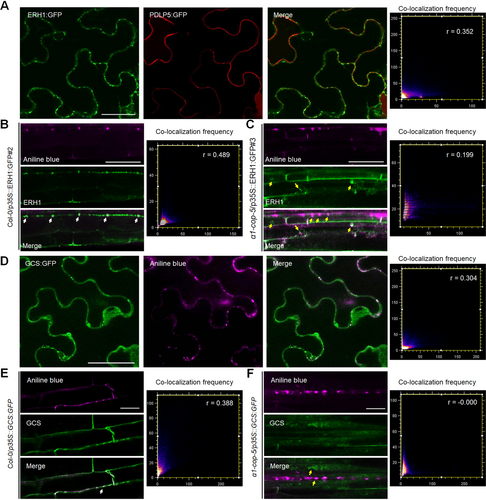
Plasmodesmata localization of ERH1 is altered in the α1-cop-5 mutant
(A) ERH1:GFP is partially co-localized with PDLP5:RFP at plasmodesmata (PD). Confocal images of Nicotiana benthamiana epidermal cells transiently expressing ERH1:GFP and PDLP5:RFP. White arrow indicates co-localization signals from green fluorescent protein (GFP) and red fluorescent protein (RFP). Scale bar: 50 µm. (B) Arabidopsis transgenic plant expressing ERH1:GFP (wild-type Col-0 background). Green fluorescent signals are partially co-localized with aniline blue-stained callose in the primary root. White arrows illustrate GFP signals co-localized with aniline blue signals (magenta) at PD. Scale bar: 40 µm. (C) Arabidopsis transgenic plant expressing ERH1:GFP (α1-cop-5 background). Green fluorescent signals do not co-localize (yellow arrows) with aniline blue-stained callose (magenta) in the primary root. Scale bar: 40 µm. (D) Confocal images of N. benthamiana epidermal cells transiently expressing GCS:GFP. Sample was stained with aniline blue for PD localization analysis. White arrow indicates the co-localization of GFP and aniline blue (magenta) signals at PD. Scale bar: 50 µm. (E) Arabidopsis transgenic plant expressing GCS:GFP (wild-type Col-0 background). Green fluorescent signals are partially co-localized with aniline blue-stained callose in the primary root. White arrow illustrates GFP signal co-localized with aniline blue signal (magenta) at PD. Scale bar: 20 µm. (F) Arabidopsis transgenic plant expressing GCS:GFP (α1-cop-5 background). Green fluorescent signals do not co-localize (yellow arrows) with aniline blue-stained callose (magenta) in the primary root. Scale bar: 20 µm. Co-localization frequency scatter plots, Pearson's coefficient (r) was calculated to evaluate the overlap between ERH1/GCS localizations and PLASMODESMATA-LOCATED PROTEIN 5 (PDLP5)/aniline blue localizations (A–F).
Since GCS was physically associated with α1-COP at PD, we asked whether GCS is also localized at PD. Thus, co-localization analysis was performed. Nicotiana benthamiana leaves transiently expressing GCS:GFP were stained with aniline blue. As a result, some GFP fluorescence signals on the cell periphery exhibited a co-localization with aniline blue-stained callose at PD (Figure 4D). Transgenic plants overexpressing GCS:GFP were generated to further validate GCS localization. Consistent with transient expression, GCS:GFP in the wild-type Col-0 background showed partial co-localization with aniline blue signals at PD (Figure 4E). However, in the absence of α1-COP protein, GCS was mainly localized at the cytoplasm and did not co-localize with PD callose (Figure 4F). Taken together, these results suggest that α1-COP protein is critical for ERH1 and GCS localizations at PD.
α1-COP is involved in the sphingolipid biosynthesis pathway
Since ERH1 and GCS interacted with α1-COP, and loss of function of α1-COP altered their subcellular localizations, we hypothesized that SL compositions are associated with α1-COP function. To experimentally test the hypothesis, first, the transcript levels of ERH1 and GCS, along with several genes involved in the SL pathway, were analyzed. In the absence of α1-COP, transcript levels of ERH1 and GCS were similar to that of wild-type Col-0 plants. In contrast, plants overexpressing α1-COP significantly induced the expression levels of several SL pathway-related genes as compared to wild-type Col-0 plants (Figure S8). These data suggest that loss of function of Arabidopsis gene α1-COP does not affect transcriptional regulations of SL metabolic pathway-related genes. However, the mechanisms that constitute expression of α1-COP-induced messenger RNA (mRNA) expression profiles of SL genes remain unknown.
Next, the SL molecules reported in plants such as LCBs, ceramides, hydroxyceramides, GlcCers, GlcHCers and GIPCs (Markham et al., 2006; Magnin-Robert et al., 2015; Ali et al., 2018; Yan et al., 2019; Iswanto et al., 2020) were analyzed from wild-type Col-0, α1-cop-1, α1-cop-5, α1-COP-OE#1 and α1-COP-OE#2 overexpression plants. The SL profiling exhibited significant alterations in the ceramides, GlcCers, and GlcHCers levels compared to wild-type Col-0 (Figure 5). Loss of function of α1-COP showed a significant reduction in the total ceramides, GlcCers, and GlcHCers contents. Conversely, α1-COP overexpression plants displayed significant elevation in several molecules of GlcCers (Figure 5). Overall, these results indicate that α1-COP is mainly involved in the GlcCers and GlcHCers homeostasis maintenance, presumably through intracellular regulation of SL enzymes in Arabidopsis.
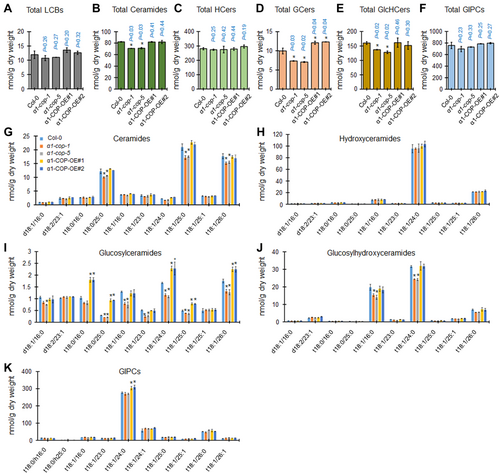
Loss of function of α1-COP reduces ceramides, GlcCers and GlcHCers
(A–F) Measurement of sphingolipids (SLs) from wild-type Col-0, α1-cop-1, α1-cop-5, α1-COP-OE#2 and α1-COP-OE#3 plants included total LCBs (A), total ceramides (B), total hydroxyceramides (C), total GlcCers (D), total GlcHCers (E) and total GIPCs (F). (G–K) SLs species characterized by LCB (d18:0, d18:1, d18:2, t18:0 and t18:1) and fatty acid (FA) (16:0–26:1) from wild-type Col-0, α1-cop-1, α1-cop-5, α1-COP-OE#1 and α1-COP-OE#2 overexpression plants included ceramides (G), hydroxyceramides (H), GlcCers (I), GlcHCers (J), and GIPCs (K). Measurements are the average of four independent biological experiments (n = 200). Data are means ± SD. Statistical significances were done by two-tailed Student's t-test; *P < 0.05, **P < 0.01.
ERH1 and α1-COP share the same intracellular compartment
In plants, a lipid raft-enriched vesicle is required for GPI-anchored PdBG2 translocation (Iswanto et al., 2020). The secretory pathway of GPI-anchored PdBG2 and non-GPI-anchored PDLP1 protein are segregated from ER to Golgi, which explicates that there are at least two types of cargo machinery in the early secretory pathway, lipid raft dependent and independent manners (Iswanto and Kim, 2017; Iswanto et al., 2020). Moreover, PDLP1 interacts with α2-COP protein, not α1-COP protein (Caillaud et al., 2014), which indicates that α2-COP protein may be involved in the secretory pathway of non-GPI-anchored PD protein, especially for PDLP1. Since the α1-COP function is required for cellular localization of SL pathway enzyme ERH1, thus we hypothesized that α1-COP is associated with ERH1 within the intracellular compartment. To test the hypothesis, the different combinations of ERH1:GFP, α1-COP:RFP and VAMP721:RFP (vesicle marker) were transiently expressed in the N. benthamiana leaves with or without Exo1, an ER to Golgi intracellular trafficking blocker (Iswanto et al., 2020). Confocal imaging showed that when GFP:α1-COP was co-expressed with VAMP721:RFP in the absence of Exo1, the fluorescent signals were partially co-localized at the cell periphery (Figure 6A), whereas in the presence of Exo1, the fluorescent signals were highly co-localized in the cytoplasm (Figure 6B). Similarly, when ERH1:GFP was co-expressed with VAMP721:RFP in the absence or presence of Exo1, the fluorescent signals were co-localized in the cell periphery or cytoplasm, respectively (Figure 6C, D). Co-localization fluorescent signals were also observed when ERH1:GFP and α1-COP:RFP were co-expressed with or without Exo1 (Figure 6E, F). Together, these results agree with BiFC and Co-IP results, validating that α1-COP physically interacts with ERH1 and might share similar intracellular compartments during secretory pathways.
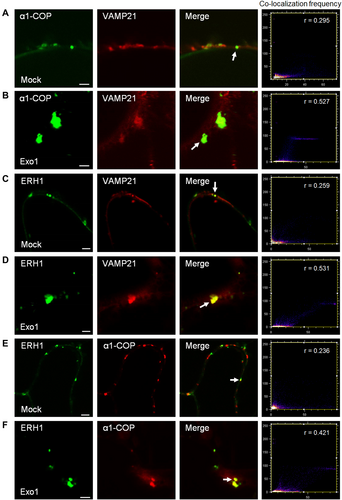
Subcellular localization of α1-COP and ERH1 in the presence of Exo1
(A, B) Confocal images of Nicotiana benthamiana leaf epidermal cells transiently expressing GFP:α1-COP and VAMP721:RFP in mock condition (A) and in the presence of Exo1 (B). (C, D) Confocal images of N. benthamiana leaf epidermal cells transiently expressing ERH1:GFP and VAMP721:RFP in mock condition (C) and in the presence of Exo1 (D). (E, F) Confocal images of N. benthamiana leaf epidermal cells transiently expressing ERH1:GFP and α1-COP:RFP in mock condition (E) and in the presence of Exo1 (F). White arrows indicate co-localization of green fluorescent protein (GFP) and red fluorescent protein (RFP) signals (A–F). Co-localization frequency scatter plots, Pearson's coefficient (r) was calculated to evaluate the overlap between α1-COP localizations and VAMP721 localizations (A, B), ERH1 localizations and VAMP721 localizations (C–D), ERH1 localizations and α1-COP localizations (E, F). Scale bars: 2 µm (A–F).
Loss of function of α1-COP changes the subcellular localization of PdBG2
As the loss of function of the α1-COP mutant showed enhanced PD callose phenotype, a question arises whether the subcellular localization of GPI-anchored proteins such as PdBG2 and PDCB1 was perturbed in the α1-cop mutants. Previous studies have remarkably identified the effect of sterols and SL alteration in the functions of GPI-anchored PD proteins, PdBG2 and PDCB1 (Farquharson, 2015; Grison et al., 2015; Iswanto and Kim, 2017; Iswanto et al., 2020). PdBGs belong to the group of GPI-anchored PD proteins, which are highly linked to sterol and SL-enriched lipid rafts in planta. In Arabidopsis, two PdBGs (PdBG1 and PdBG2) have been well studied, which are known to degrade callose deposition at the neck region of PD (Zavaliev et al., 2011, 2013, 2016; Benitez-Alfonso et al., 2013). First, transgenic plants overexpressing GFP:PdBG2 in the wild-type Col-0 and α1-cop-5 plants were generated. Furthermore, the subcellular localization of PdBG2 in the Arabidopsis leaves was analyzed. Consistent with previous reports (Iswanto et al., 2020), GFP:PdBG2 was localized at PD in the wild-type Col-0 background (Figure 7A). In contrast, in α1-cop-5, GFP:PdBG2 was not only detected at PD, but also at cytoplasm (Figure 7B). To confirm the mislocalization of PdBG2 in the α1-cop-5 mutant, the Arabidopsis leaves were stained with aniline blue before imaging. As expected, the observed green fluorescent signals in wild-type Col-0 plants showed high co-localization with PD callose, whereas green fluorescent signals depicted in the α1-cop-5 partially co-localize with PD callose (Figure 7A, B).
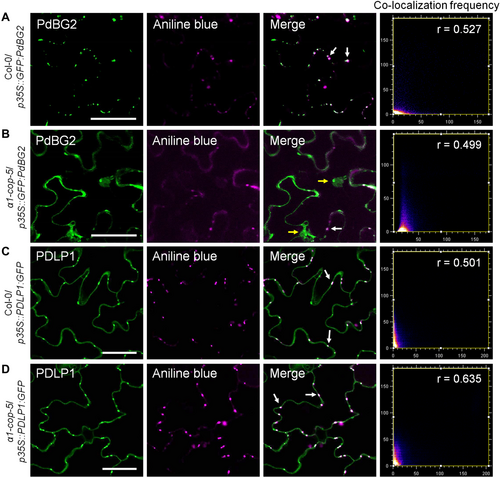
Subcellular localization of PdBG2 and PDLP1 in the absence of α1-COP
(A, B) Arabidopsis transgenic plants stably expressing GFP:PdBG2 in the wild-type Col-0 (A) and α1-cop-5 (B) backgrounds. (A) Green fluorescent signals are mainly detected at the cell periphery and show plasmodesmata (PD)-like punctate spots. (B) Green fluorescent signals are detected at the cell periphery, PD and cytoplasm. White arrows indicate GFP:PdBG2 is co-localized with aniline blue-stained callose. Yellow arrows indicate GFP:PdBG2 is retained in the cytoplasm. (C, D) Arabidopsis transgenic plants stably expressing PDLP1:GFP in the wild-type Col-0 (C) and α1-cop-5 (D) backgrounds. (C, D) Green fluorescent signals are mainly detected at the cell periphery and show PD-like punctate spots. White arrows indicate PDLP1:GFP is co-localized with aniline blue-stained callose. Co-localization frequency scatter plots, Pearson's coefficient (r) was calculated to evaluate the overlap between PdBG2 localizations and aniline blue localizations (A, B), PLASMODESMATA-LOCATED PROTEIN 1 (PDLP1) localizations and aniline blue localizations (C, D). Scale bars: 50 µm (A–D).
Next, the question arises whether α1-COP also plays a critical role in maintaining non-GPI-anchored PD protein functions. To answer the above question, the subcellular localization of PDLP1 in the absence of α1-COP was determined. Interestingly, the subcellular localization of PDLP1 was not changed in the absence of α1-COP (Figure 7C, D), indicating that α1-COP is not involved in regulating non-GPI-anchored PDLP1. These data suggest that α1-COP is essential for GPI-anchored PdBG2 function at PD. Moreover, the mislocalization of PdBG2 in the absence of α1-COP protein potentially led to the enhanced callose phenotype.
α1-cop mutants are susceptible to Botrytis cinerea
Several studies have shown the link between SLs and callose homeostasis in response to biotic stimuli (Jacobs et al., 2003; Nishimura et al., 2003; Wang et al., 2008; Ellinger et al., 2013; Fang et al., 2016; Iswanto et al., 2022; German et al., 2023). We examined the possible involvement α1-COP activity in plant response to B. cinerea (a necrotrophic fungus) infection. First, we grew and observed the intact phenotype of wild-type Col-0, α1-cop mutants along with α1-COP overexpression plants in normal growth conditions. However, we did not find a distinct morphological phenotype in all genotypes tested (Figure S9). Next, we challenged the loss of function mutants and overexpression plants of α1-COP with B. cinerea. Leaves from α1-cop mutants showed a severe lesion of fungus infection. The diameters of necrotic lesions in α1-cop mutants were significantly larger than in wild-type Col-0 and α1-COP overexpression plants (Figure 8A, B). Next, we analyzed the mRNA expressions of salicylic acid (SA)-mediated defense-associated genes such as pathogenesis-related protein 1 (PR1), PR2 and phytoalexin deficient 4 (PAD4) as well as jasmonic acid (JA)- and ethylene (ET)-mediated defense-associated gene, plant defensin 1.2 (PDF1.2). Interestingly, the expressions of PR1, PR2 and PDF1.2 were higher in the α1-cop-5 mutant in comparison to wild-type Col-0 plant at pre-inoculation with B. cinerea, whereas PAD4 expression was lower than that wild-type Col-0 (Figure 8C). Additionally, increased expressions of PR1, PR2 and PDF1.2 at 18 h post-inoculation (hpi) were not significantly different between wild-type Col-0 and α1-cop-5 plants (Figure 8C). Comparison of mRNA expression analysis in which Arabidopsis wild-type Col-0 and α1-cop-5 leaves were infected by B. cinerea revealed enhanced transcript levels of SA-, JA- and ET-responsive marker genes at pre-inoculation time, suggesting that the transcriptional changes of an assortment of defense marker genes may not contribute to the susceptibility of α1-cop-5 mutant to B. cinerea.
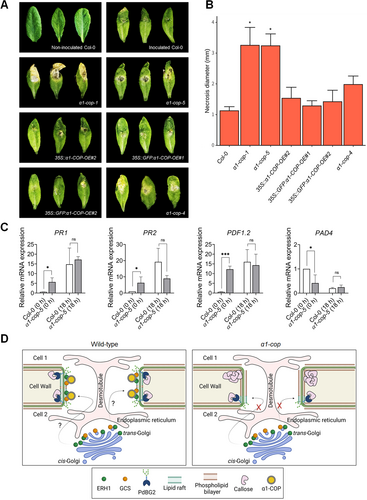
Pathogenesis assay of α1-cop mutants against Botrytis cinerea
(A) Disease symptoms observation at 5 d post-infection (dpi). (B) Leaf necrosis diameter was calculated at 5 dpi by measuring three leaves per plant for five plants. Two-sided Dunnett's multiple comparisons was performed to determine the significant difference with wild-type Col-0 (*P ≤ 0.05). (C) Quantitative reverse transcription – polymerase chain reaction analysis of defense marker genes of wild-type Col-0 and α1-cop-5 plants at 0 and 18 h after Botrytis cinerea inoculation. Statistical significance was determined by t-test (*P ≤ 0.05, ***P ≤ 0.001). PR1, PR2, PDF1.2 and PAD4 expressions from all genotypes were normalized with ACTIN2, UBQ10, UBC9 and EF-1α. Histograms show the mean ± SD of three biological replicates. (D) Schematic model of the role of α1-COP in the regulation of the plasmodesmata (PD). (Left; wild-type) sphingolipids are required for the formation of lipid rafts (membrane lipids marked in green color) at PD-PM (plasma membrane). Sphingolipid (SL) pathway enzymes ERH1 and GCS facilitate the formation of more complex SL-modulated lipid rafts. However, PD localization of ERH1 and GCS depends on the existence of α1-COP through direct binding activity. (Right; α1-cop) in the absence of α1-COP, ERH1 and GCS are not found at the PD, eventually altering lipid raft composition at the PD-PM. The alteration of lipid rafts composition particularly affects the subcellular localization of PdBG2, leading to a stabilization of callose deposition.
DISCUSSIONS
COPI is comprised of seven subunits (α/β/β′/γ/δ/ε/ζ) that have been classified into two sub-complexes, the B- (α/β′/ε) and F-sub-complex (β/δ/γ/ζ). In mammals, all the coatomer subunits have only one isoform, except γ-COP and ζ-COP subunits, whereas yeast contains only one isoform for all coatomer subunits. In contrast to mammals and yeast, in A. thaliana and other higher plants, except for γ-COP and δ-COP subunits, all coatomer subunits have more than one isoform. Two α-COP isoforms, α1- and α2-COP, have been characterized in Arabidopsis (Gimeno-Ferrer et al., 2017; Cabada Gomez et al., 2020). Here we showed that a missense mutation (G486D) and knockout T-DNA mutants of α1-COP exhibited excess callose accumulation (Figure 1), increased phototropic response (Figure S3), but had no or little defect in plant growth under steady conditions (Figure S9). It is interesting that loss of function of α1-COP has no apparent impact on Arabidopsis growth and development, despite significantly elevating PD callose levels. The biological significance of α1-COP-mediated regulation of PD is supported by the finding that loss of function of α1-COP improves Arabidopsis plant sensitivity to B. cinerea infection. This suggests that the mechanisms involved in normal plant growth may be less sensitive to alterations in α1-COP-mediated regulation of PD than the mechanisms involved in dealing with biotic stress. Moreover, our data in the transcriptional activity analysis of several defense marker genes suggest that upregulation of mRNA levels in the α1-cop-5 mutant at pre-inoculation stage may be not involved in susceptibility to B. cinerea (Figure 8C).
α1-COP controls PD permeability by regulating callose deposition at PD, which appears important for tropism. We also obtained evidence that α1-COP participates in a defense mechanism against B. cinerea infection, but its relation to callose-dependent PD regulation remains unclear. In general, callose accumulation suppresses infections. One possibility is that α1-COP may regulate disease response through PD-targeting of the LYSIN MOTIF DOMAIN-CONTAINING GLYCOSYLPHOSPHATIDYLINOSITOL-ANCHORED PROTEIN 2 (LYM2) protein. Besides defense-responsive genes expression analysis, an increased susceptibility to B. cinerea infection may also occur through other mechanisms. LYM2 is a GPI-anchored PD receptor-like protein and is suggested to be an essential factor during B. cinerea infection in Arabidopsis (Faulkner et al., 2013; Vu et al., 2020). Since α1-COP is required for the proper intracellular trafficking of GPI-anchored PdBG2, we hypothesized that α1-COP is presumably associated with GPI-anchored LYM2 functioning. Thus, the enhancement of susceptibility of α1-cop mutant plants against B. cinerea may be due to the malfunction of LYM2. Moreover, PR2 protein is also known as β-1,3-glucanase 2 (BG2) in Arabidopsis, which plays a critical role in plant defense response (Liu et al., 2023). So far, 50 genes have been identified as being in the β-1,3-glucanase family (Levy et al., 2007), and among them, only three are classified as GPI-anchored BG proteins, including A. thaliana β-1,3-glucanase_putative PD-associated protein (AtBG_ppap), PdBG1 and PdBG2 (Benitez-Alfonso et al., 2013; Wu et al., 2018). Since GPI-anchored PdBG2 subcellular localization is altered in the α1-cop -5 mutant, it would be interesting to identify the biological property of PR2/BG2, its role in PD control as well as plant defense and broad stress responses.
In contrast to α1-cop mutants, the loss of function of α2-COP resembled wild-type Col-0 callose phenotype (Figure S3), but the plant growth is severely impaired (Gimeno-Ferrer et al., 2017). These two α-COP isoforms harbor the WD40 domain at their N-terminal, which is required for the intracellular trafficking of cargo proteins containing the KKXX motif. Interestingly, as these isoforms share an amino acid sequence of 93% identity, the excessive callose phenotype and the absence of growth defects in the α1-cop mutants might be explained by their differences in the interaction partners and COPI composition. Nonetheless, further studies will be required to identify the differences between the functions of α1-COP and α2-COP in PD callose turnover and plant growth. The results here indicate that α1-COP has a role in PD callose-mediated symplasmic continuity regulation.
COPI vesicles are involved in several different intracellular transports of secretory proteins, such as anterograde transport within the Golgi stack (Rothman, 1994; Orci et al., 1997), ER to Golgi transport (Pepperkok et al., 1993; Bednarek et al., 1995), and retrograde transports of GPI-anchored proteins (Sutterlin et al., 1997) and particular proteins that contain dilysine (KKXX) motif in their cytosolic C-terminal (Eugster et al., 2004; Jackson et al., 2012). In addition, it has been proven that COPI interacts with several sphingolipid molecules (Chaudhary et al., 1998; Contreras et al., 2012). Arabidopsis ERH1 and GCS proteins are two key SL pathway enzymes responsible for converting ceramide species to produce inositolphosphorylceramide and glucosylceramide, respectively (Wang et al., 2008; Msanne et al., 2015). They contain a dilysine motif at their C-terminus, which interacts with COPI via α1-COP subunit (Figure 3). Here, we also found that loss of α1-COP causes obvious defects in the trafficking of ERH1 and GCS proteins, which are predominantly localized to the cytoplasm and were not found in the PD callose spot. These results suggest the role of a specific α1-COP type of COPI in maintaining normal cellular function and intracellular trafficking of dilysine motif proteins, especially for several SL enzymes in Arabidopsis.
Glycosyl inositol phosphoryl ceramides and GlcCers are the most abundant sphingolipid species found in the PM and other endomembranes which are particularly required in lipid raft formation. Moreover, PD-PM is enriched by lipid raft (Grison et al., 2015; Iswanto and Kim, 2017), and it has been reported that the proper form of lipid raft at PD is required for the GPI-anchored PD proteins localization, such as PDCB1 and PdBG2 for maintaining callose levels at the PD neck region (Grison et al., 2015; Iswanto and Kim, 2017). The result from SL analyses revealed that the reduction of GlcCers and GlcHCers molecules in the α1-cop mutants indicates the positive role of α1-COP in the SL biosynthesis pathways (Figure 5). In yeast studies, it has been reported that mutations in the ret1-1 (α-cop) disturb the ER to Golgi transport of GPI-anchored proteins (Sutterlin et al., 1997). Interestingly, we also found that loss of α1-COP changes the subcellular localization of GPI-anchored PdBG2, which was mainly detected in the cytoplasm rather than at the PD (Figure 7A, B). The attenuation of GPI-anchored PdBG2 at the PD channel might be caused by the mislocalizations of ERH1 and GCS to provide a biological property at PD-PM such as lipid rafts (Figure 8D).
In summary, all these results suggest that α1-COP plays a role in targeting GPI-anchored PdBG2 protein to PD-PM and modulating callose turnover through physical interaction with SL modifiers and their delivery in Arabidopsis. This work provides a critical clue in understanding PD regulation by COPI vesicle functioning primarily in the intracellular trafficking pathways.
MATERIALS AND METHODS
Plant materials and growth conditions
The mutants used in this study were in the A. thaliana wild-type Col-0 ecotype. The α1-cop-4 (single amino acid substitution, glycine to aspartic acid, G486D) mutant was obtained from M4 populations of dsGSL8-RNAi treated with EMS. The T-DNA insertion lines α1-cop-1 (SALK_078465), α1-cop-5 (SALK_003425), α2-cop-1 (SALK_103968) and α2-cop-2 (SALK_1229034) were obtained from the Arabidopsis Biological Resource Center. These mutants were verified by polymerase chain reaction (PCR) analysis using with T-DNA specific and flanking primers. The seeds were surface sterilized with 25% (v/v) bleach for 15 min, washed four times with sterile water, and kept in darkness at 4°C for 3 d before they were planted on agar Murashige and Skoog (MS) medium. Plants were grown at 22°C under 16 h light/8 h dark cycle.
Mutant screen and NGM
The detailed mutant screen process is shown in the supporting information (Figure S1A). Genetic mapping was conducted using an F2 population derived from a cross between dsGSL8-RNAi EMS mutant (from Col-0 genotype) and Landsberg erecta (Ler). F2 seedlings were assessed for bending sensitivity to tropic responses (phototropic and gravitropic responses) (Figure S1B). Genomic DNA of 60 F2 homozygous plants was isolated using a high-quality DNA purification system (DNeasy Plant Maxi Kit; Qiagen Korea, Ltd., Seoul, Republic of Korea), according to the manufacturer's instructions. Next, genomic DNA samples were sent to the THERAGEN BIO CO., LTD (Seongnam, Republic of Korea) for sequencing. For performing NGM analysis, the sequencing results were analyzed using a web-based tool at http://bar.utoronto.ca/NGM (Austin et al., 2011). NGM identified a substitution of a single nucleotide in the AT1G62020 (guanine to adenine) (Figure S2A).
Plasmid constructs
To create stable lines overexpressing α1-COP, ERH1 and GCS or to perform transient localization assay of α1-COP, α1-COPG486D, ERH1, GCS, PDLP1 and PDLP5, PCR products (with/without stop codon) amplified from coding sequence (CDS) were first cloned in the pDONR207 plasmid (Invitrogen). The resultant entry clones were subsequently transformed into gateway binary vectors; pMDC43, pMDC83 (Curtis and Grossniklaus, 2003), pH7RWG2.0 (Karimi et al., 2002), myc-pBA, pDEST-GWVYNE, pDEST-VYNE(R), pDEST-GWVYCE and pDEST-VYCE(R)GW (Gehl et al., 2009) to fuse GFP, RFP, Myc, Venus-N and Venus-C tags, respectively. PdBG2 construction was performed as previously described (Iswanto et al., 2020).
Plant transformation and transgenic plant screening
Transgenic Arabidopsis plants were obtained by Agrobacterium tumefaciens-mediated transformation (Zhang et al., 2006). The developing Arabidopsis inflorescences were dipped with 0.03% (v/v) Silwet L-77, 3% (m/v) sucrose and Agrobacterium cells carrying the chosen vectors for 5 s. T1 seeds were grown on selective media to screen transgenic Arabidopsis plants.
Aniline blue staining
Arabidopsis hypocotyls, root tips and rosette leaves were kept in callose staining buffer (CSB) for 3 h in darkness. CSB was a mixture of 0.1% (w/v) aniline blue in autoclaved triple-distilled water and 1 mol/L glycine (pH 9.5) at a volume ratio of 2:3. The samples were then washed, and the fluorescence was detected under a confocal microscope. During quantification, yellow square dotted lines were selected as a region of interest (ROI) and the mean relative fluorescence intensity was measured using ImageJ (https://imagej.nih.gov/ij/). For additional information on the quantification of callose using aniline blue staining, see (Zavaliev et al., 2011, 2013).
Hypocotyl loading assay
To measure symplasmic connectivity using the HPTS (Sigma-Aldrich) dye movement assay, a symplasmic dye tracer, was loaded on the top of sharply trimmed etiolated 3-d-old Arabidopsis hypocotyls as shown in previous publications (Han et al., 2014; Kumar et al., 2016). A cover slip was placed between each cut hypocotyl surface and the MS agar. For dye loading, individual agar blocks containing HPTS (5 mg/mL) were placed on the cut hypocotyl surface. After a 5 min loading period, the seedlings were washed in water for 15 min, and then fluorescent probe movements were observed by confocal microscopy (Kumar et al., 2016).
RNA extraction and quantitative reverse transcription-PCR analyses
Total RNA was extracted from 10-d-old Arabidopsis seedlings with an RNeasy® Plant Mini Kit (Qiagen) according to the manufacturer's instructions. First-strand complementary DNA synthesis was performed using 1 µg of total RNA with an anchored oligo (dT) and Transcriptor Reverse Transcriptase (Qiagen) following the manufacturer's protocol. Quantitative reverse transcription-PCR (qRT-PCR) was conducted on 384-well plates using the Light Cycler 480 system (Biorad) and the QuantiSpeed SYBR Green Kit (PhileKorea) under the following conditions: denaturation for 5 min at 95°C, 40 cycles of 10 s at 95°C for denaturation and 10 s at 60°C for annealing. Each reaction was performed with 3 µL of 1:20 (v/v) dilution of the first complementary DNA strand, with 0.5 µmol/L of each primer (Table S1) in a total reaction volume of 10 µL. The qRT-PCR data represent the mean value of two independent biological experiments, with four technical replicates after normalization with the four reference transcripts (ACTIN2, UBQ10, UBC9, and EF-1α) shown before to exhibit invariable expression levels.
Bimolecular fluorescence complementation assays
The combination of proteins (in the relevant figure) were transiently co-expressed in N. benthamiana. Yellow fluorescent signals were observed at 72 h post-infiltration under OLYMPUS FV1000-LDPSU (Olympus, Japan) confocal laser-scanning microscope.
Confocal microscopy
Confocal fluorescence microscopy was performed with an OLYMPUS FV1000-LDPSU (Olympus) inverted confocal microscope using 20X/0.8 oil-immersion objective or 40X/1.3 oil-immersion objective. GFP was excited with a laser using a 488 nanometer beam splitter. RFP and FM4-64 were excited with a laser using a 543 nanometer beam splitter. YFP was excited with a laser using a 515 nanometer beam splitter. Aniline blue and 4,6-diamidino-2-phenylindole (DAPI) were excited with a laser using a 405 nanometer beam splitter. Signal intensities from GFP (HPTS fluorescent signal) and aniline blue (PD callose detection) were quantified with ImageJ software for statistical analyses.
Co-localization analysis
To determine the intensity range of red/magenta and green pixels in the confocal image, we performed a co-localization scatter plot followed by Pearson's correlation coefficient (r) analysis using co-localization finder plugin in ImageJ software (https://imagej.net/ij/) (Dunn et al., 2011; Moser et al., 2017). The correlation between two images is indicated by r-values. 0 ≤ r ≤ 0.19 indicates low correlation (not co-localized), 0.2 ≤ r ≤ 0.49 indicates moderate correlation (partially co-localized), 0.5 ≤ r ≤ 1.0 indicates high correlation (highly co-localized).
Co-immunoprecipitation assay
The combination of proteins (in the relevant figure) were transiently expressed in N. benthamiana. For bead preparation, 150 µL of Ezview Red Anti-C-Myc Affinity Gel (Sigma, E6654) (for six samples) was washed in 750 µL IP buffer (100 mmol/L Tris-HCl pH 7.5, 150 mmol/L NaCl, 1 mmol/L ethylenediaminetetraacetic acid (EDTA) pH 8.0, 0.5% NP40, ddH2O,) with 1:100 complete protease inhibitor cocktail (Roche) and centrifuged at 1,008× g (3,000 rpm) for 1 min at 4°C. The washing step was repeated three times. The washing step was ended by adding 200 µL IP buffer. Next, 1 g fresh weight of infiltrated leaves was collected. The tissues were ground in 3 mL IP buffer. The broken tissues were transferred to the filter and aliquoted into Eppendorf tubes. The samples were centrifuged at 16,128× g (12,000 rpm) for 5 min at 4°C to remove cell debris. Fifteen microliters of supernatants (total proteins) served as the input controls. One milliliter of supernatants was then incubated with 50 µL of Myc-beads on a rotator at 4°C for 12 h. The Myc-beads were then spun down at 1,008× g (3,000 rpm) for 2 min at 4°C and washed three times with IP buffer. After the last centrifugation, supernatants were removed and beads were adjusted up to 40 µL with IP buffer. Proteins associated with the Myc-fusion proteins were eluted by adding 10 µL of 5x sample loading buffer and heating at 65°C for 10 min. The eluted proteins were analyzed by immunoblot assay. Primary antibodies used in this study were c-Myc (9E10) horseradish peroxidase (HRP) sc-40 HRP mouse monoclonal immunoglobulin G1 (IgG1) (Santa Cruz Biotechnology) and Anti-GFP (abcam ab6556). Secondary antibody used in this study was Anti-Rabbit IgG (H + L) Conjugate (Promega).
Sphingolipid extraction and sphingolipid analysis
Plant samples preparation for SL inhibitors treatments, Arabidopsis seeds from each genotypes, wild-type Col-0, α1-cop-1, α1-cop-5, α1-COP-OE#2, and α1-COP-OE#3 were grown on normal MS medium for 14 d. Two-week-old seedlings were immediately frozen in liquid nitrogen and ground to a fine powder (n = 250, four independent biological experiments). For plant sphingolipid analysis, the total lipids were extracted from 3 mg of lyophilized Arabidopsis seedlings using the combined upper phase (220 μL) and lower phase (110 μL) of methyl-tert-butyl ether (MTBE)/methanol/water (100:30:35, v/v/v) as previously described (Chen et al., 2013). Extracts were reconstituted in 100 μL chloroform/methanol (1:9, v/v). Sphingolipids profiling was performed using a Nexera2 liquid chromatography (LC) system (Shimadzu Corporation, Kyoto, Japan) connected to a triple quadrupole mass spectrometer (LC-MS 8040; Shimadzu) with reversed phase Kinetex C18 column (100 × 2.1 mm, 2.6 μm; Phenomenex, Torrance, CA, USA) for chromatographic separations of lipids. Mobile phase A consisted of water/methanol (1:9, v/v) containing 10 mmol/L ammonium acetate, and mobile phase B consisted of isopropanol/methanol (5:5, v/v) containing 10 mmol/L ammonium acetate. To achieve chromatographic separation, a gradient elution program was optimized as follows: 0 min, 30% B; 0–15 min, 95% B; 15–20 min, 95% B; 20–25 min, 30% B. The flow rate was set a 200 μL/min. Sample volumes at 5 μL were injected for each run. To achieve sphingolipid quantifications, the calculated ratio of analyte and internal standard is multiplied by the concentration of the internal standard to obtain the concentration for each lipid species (Xia and Jemal, 2009; Bure et al., 2013; Lee et al., 2017; Im et al., 2019). Since there is no commercial internal standard for the quantification of GIPC molecular species, ganglioside GM1 is often used as an alternative to it (Markham and Jaworski, 2007; Tellier et al., 2014). We performed quantitative analysis of SLs using one-point calibrations of each target SL species (dihydrosphingosine d17:0/LCBs, non-hydroxy-phytoceramide (t18:0/8:0)/ceramide, alpha-hydroxy-phytoceramide (t18:0/h6:0)/hydroxyceramide, glucosyl-ceramide (d18:1/12:0)/GlcCer or GlcHCer, and GM1 (d18:1/18:0)/GIPC with known concentration). Non-hydroxy-phytoceramide ((t18:0/8:0), molecular weight (MW) = 443.6) and alpha-hydroxy-phytoceramide ((t18:0/h6:0), MW = 431.6) were synthesized by Kyungpook University (Daegu, Korea) and other internal standards were purchased from Matreya (Pleasant Gap, PA, USA) or Avanti Polar Lipids (Alabaster, AL, USA).
Botrytis cinerea infection assay
The plant was grown in a growth chamber under 12/12 h light/dark at 22°C, 60% relative humidity. A challenging pathogen, B. cinerea, was cultivated on PDA (potato dextrose broth 24 g, agar 20 g, ddH2O 1 L) at 27°C for 7 d. Mycelium and spores were collected with sterile water and were filtered using the three layers of sterilized cheesecloth to collect spores. The spore concentration was adjusted to 1 × 10⁵ colony-forming units (CFU)/mL using a Hemocytometer (SUPERIOR, Lauda, DE). Rosette stage of A. thaliana of the wild-type and the mutants were used in the experiment to confirm susceptibility against B. cinerea. The spore (5 μL; 105 CFU/mL) was inoculated per leaf of A. thaliana. The plant was covered with parafilm to avoid dispersion of conidia spores and to maintain high humidity (95%–100%). Experimental repetition per line was performed by three leaves per plant for five plants. Necrosis symptoms were evaluated 5 d after inoculation. The diameter of the necrotic lesion on the leaves was measured using the Image J program. Two-sided Dunnett's Multiple Comparsions was performed to determine the significant difference in disease incidence (P < 0.05). Statistix 8 (version 8.0) was used as the analytical software.
For qRT-PCR assays, 5-week-old Arabidopsis plants (wild-type Col-0 and α1-cop-5) were inoculated by placing four 5-µL drops of 5 × 10⁵ spores/mL solution of B. cinerea on adaxial leaves. Samples of B. cinerea-inoculated leaves were collected at 0 and 18 hpi and were directly frozen in liquid nitrogen for further RNA extraction.
Data analyses and experimental repeats
The statistical analysis and sample size or number for each experiment are listed in the relevant figures and figure legends. All experiments in this study were at least conducted with three independent replications. Box plots were created using GraphPad Prism version 8.0.2 for Windows (www.graphpad.com). One-way analysis of variance and Tukey's multiple comparison tests were performed to test the statistical significance. Different letters above bars represent significant differences at P < 0.05.
Accession numbers
For accession numbers for the genes mentioned in this study, see Table S2.
ACKNOWLEDGEMENTS
This work was supported by the National Research Foundation of Korea (NRF) grant funded by the Korea Government (MSIT) (Grant Nos. NRF 2018R1A2A1A05077295, 2020M3A9I4038352, 2022R1A2C3010331, 2020R1A6A1A03044344, and 2022R1A5A1031361), and by a grant from the New Breeding Technologies Development Program (Grant No. PJ01653202), Rural Development Administration (RDA), Republic of Korea.
CONFLICTS OF INTEREST
The authors declare no conflict of interest.
AUTHOR CONTRIBUTIONS
A.B.B.I., M.H.V., J.C.S., R.K., S.W., H.K., D.R.K., G.H.S., W.Y.K., Y.S.K., K.H.L., S.H.K., and J.-Y.K. conceived the study. A.B.B.I. performed experiments, analyzed data and wrote the manuscript. M.H.V., J.C.S., R.K., S.W., H.K., D.R.K., and G.H.S. performed experiments. A.B.B.I., S.H.K., and J.-Y.K. designed experiments and edited the manuscript. S.H.K. and J.-Y.K. supervised the project. All authors contributed to the final manuscript and approved the submitted version.


