Busulfan induces steatosis in HepaRG cells but not in primary human hepatocytes: Possible explanations and implication for the prediction of drug-induced liver injury
Funding information: This work was supported by a grant from the Agence Nationale de la Recherche (ANR-16-CE18-0010 MITOXDRUGS). Julien Allard was a recipient of a fellowship from this ANR program.
Abstract
Background
The antineoplastic drug busulfan can induce different hepatic lesions including cholestasis and sinusoidal obstruction syndrome. However, hepatic steatosis has never been reported in patients.
Objectives
This study aimed to determine whether busulfan could induce steatosis in primary human hepatocytes (PHH) and differentiated HepaRG cells.
Methods
Neutral lipids were determined in PHH and HepaRG cells. Mechanistic investigations were performed in HepaRG cells by measuring metabolic fluxes linked to lipid homeostasis, reduced glutathione (GSH) levels, and expression of genes involved in lipid metabolism and endoplasmic reticulum (ER) stress. Analysis of two previous transcriptomic datasets was carried out.
Results
Busulfan induced lipid accumulation in HepaRG cells but not in six different batches of PHH. In HepaRG cells, busulfan impaired VLDL secretion, increased fatty acid uptake, and induced ER stress. Transcriptomic data analysis and decreased GSH levels suggested that busulfan-induced steatosis might be linked to the high expression of glutathione S-transferase (GST) isoenzyme A1, which is responsible for the formation of the hepatotoxic sulfonium cation conjugate. In keeping with this, the GST inhibitor ethacrynic acid and the chemical chaperone tauroursodeoxycholic acid alleviated busulfan-induced lipid accumulation in HepaRG cells supporting the role of the sulfonium cation conjugate and ER stress in steatosis.
Conclusion
While the HepaRG cell line is an invaluable tool for pharmacotoxicological studies, it might not be always an appropriate model to predict and mechanistically investigate drug-induced liver injury. Hence, we recommend carrying out toxicological investigations in both HepaRG cells and PHH to avoid drawing wrong conclusions on the potential hepatotoxicity of drugs and other xenobiotics.
Abbreviations
-
- ANGPTL3
-
- angiopoietin-like 3
-
- ANOVA
-
- analysis of variance
-
- ApoB
-
- apolipoprotein B
-
- ApoC3
-
- apolipoprotein C3
-
- ATF6
-
- activating transcription factor 6
-
- BSA
-
- bovine serum albumin
-
- CD36
-
- CD36 molecule
-
- DDIT3
-
- DNA damage-inducible transcript 3
-
- DMSO
-
- dimethyl sulfoxide
-
- DNL
-
- de novo lipogenesis
-
- EIF2AK3
-
- eukaryotic translation initiation factor 2 alpha kinase 3
-
- ER
-
- endoplasmic reticulum
-
- ERN1
-
- endoplasmic reticulum to nucleus signaling 1
-
- ETA
-
- ethacrynic acid
-
- FAO
-
- fatty acid oxidation
-
- FAT
-
- fatty acid transporter
-
- FBS
-
- fetal bovine serum
-
- GSH
-
- glutathione
-
- GSSG
-
- oxidized glutathione
-
- GST
-
- glutathione S-transferase
-
- GSTA1
-
- glutathione S-transferase isoenzyme A1
-
- HSPA5
-
- heat shock protein family A member 5
-
- HTRF
-
- homogeneous time-resolved fluorescence
-
- LC-MS/MS
-
- liquid chromatography-tandem mass spectrometry
-
- MSA
-
- methane sulfonic acid
-
- MTTP
-
- microsomal triglyceride transfer protein
-
- PBS
-
- phosphate-buffered saline
-
- P4HB
-
- prolyl 4-hydroxylase subunit beta
-
- PHH
-
- primary human hepatocytes
-
- RIDD
-
- regulated IRE1alpha-dependent decay
-
- SD
-
- standard deviation
-
- TUDCA
-
- tauroursodeoxycholic acid
-
- UPR
-
- unfolded protein response
-
- VLDL
-
- very low-density lipoprotein
1 INTRODUCTION
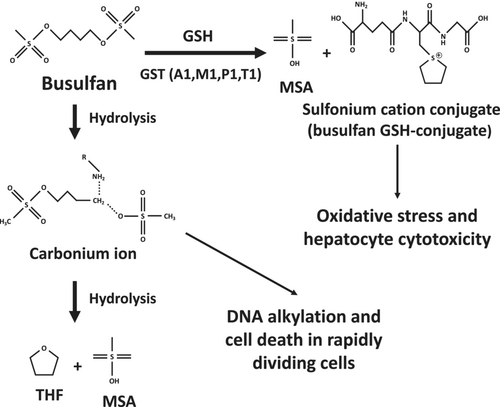
Busulfan (1,4-butanediol dimethanesulfonate) is an alkylating drug used for the treatment of chronic myelogenous leukemia as well as a myeloablative agent administrated prior to hematopoietic stem cell transplantation. The usual protocols of busulfan treatment comprise 2 to 16 intravenous administrations [1]. Once administrated, this anticancer drug spontaneously hydrolyzes leading to the formation of a reactive carbonium ion that alkylates DNA, thus causing cell death in rapidly dividing cells (Figure 1) [2, 3]. This carbonium ion is further hydrolyzed to tetrahydrofuran (THF) and methanesulfonic acid (MSA) (Figure 1) [2]. Busulfan can also be conjugated to reduced glutathione (GSH) by different glutathione S-transferase (GST) isoenzymes with GSTA1 playing a predominant role, whereas GSTM1, GSTP1, and GSTT1 appear to be involved only to a lesser extent (Figure 1) [2, 5, 6]. In keeping with this report, other studies showed that GSTA1 polymorphisms significantly affect busulfan clearance in treated patients [7-9].
Busulfan can induce various adverse effects involving different tissues and organs such as bone marrow, gastrointestinal tract, liver, lung, skin, bladder, central nervous system, and ovary [3, 10]. Regarding the liver, busulfan can induce different types of hepatic lesions including intrahepatic cholestasis, hepatocellular necrosis, nodular regenerative hyperplasia, and sinusoidal obstruction syndrome (SOS), which can be severe and even fatal [11, 12]. However, to the best of our knowledge, steatosis (i.e., lipid accumulation) has never been reported in patients. In rodents, investigations in mice treated with 33- and 40-mg/kg/day busulfan reported diffuse microvesicular steatosis, which was dose-dependent [13]. Nevertheless, as underlined by the authors, this liver lesion might not be specific because severe body weight loss was concomitantly observed in treated mice [13]. Hence, busulfan could be classified as a non-steatogenic drug, at least in humans. Alternatively, busulfan-induced steatosis might occur only in a few patients and/or might be mostly asymptomatic.
The mechanisms of busulfan-induced hepatotoxicity are still poorly understood. Investigations in cultured mouse hepatocytes showed that busulfan-induced cytotoxicity (as assessed by LDH release) required GST activity, thus suggesting that the sulfonium cation conjugate might be toxic (Figure 1) [4]. This study also showed that busulfan induced oxidative stress as reflected by significant GSH depletion and increased levels of oxidized glutathione (GSSG), which were exacerbated when hepatocytes were cultured in a medium without sulfur amino acids [4]. Busulfan-induced oxidative stress was also characterized by lipid peroxidation as assessed by increased levels of thiobarbituric acid reactive substances (TBARS) [4]. In keeping with these in vitro results, investigations in mice showed that repeated administration of 33-mg/kg busulfan induced a significant decrease in hepatic GSH levels [13]. Finally, earlier investigations in cultured rat hepatocytes reported that busulfan induced DNA damage [14].
In a recent study performed in HepaRG cells and primary human hepatocytes (PHH), we studied 12 different drugs reported to be steatogenic in treated patients [15]. Among these drugs, seven were found to induce a significant accumulation of neutral lipids in both differentiated HepaRG cells and PHH [15]. Further experiments in HepaRG cells also disclosed that in the absence of severe mitochondrial dysfunction, these seven drugs can induce steatosis by different mechanisms including impairment of mitochondrial fatty acid oxidation (FAO), increased de novo lipogenesis (DNL), inhibition of very low-density lipoprotein (VLDL) secretion, and possibly enhanced fatty acid uptake [15]. These investigations and others showed that the HepaRG cell line could be a suitable model to investigate drug-induced steatosis and related mechanisms [15-18].
In parallel to these investigations, we also treated HepaRG cells with three drugs that have never been reported to induce steatosis in patients, namely, busulfan, amoxicillin, and glimepiride [11, 12]. To our surprise, whereas glimepiride and amoxicillin caused little or no steatosis in HepaRG cells, busulfan induced a marked concentration-dependent increase in neutral lipids. In sharp contrast, this drug did not induce steatosis in six different batches of PHH. Hence, we decided to perform further experiments in differentiated HepaRG cells to get more insight into the mechanism(s) whereby this antineoplastic agent caused lipid accumulation in these cells. We also examined transcriptomic databases in order to understand why busulfan could be steatogenic in HepaRG cells but not in PHH. Our study highlights the need to use PHH to evaluate the ability of drugs and other xenobiotics to induce steatosis whenever their steatogenic potential in humans is still unknown.
2 MATERIALS AND METHODS
2.1 Chemicals and reagents
Busulfan, dimethyl sulfoxide (DMSO), ethacrynic acid (ETA), insulin, palmitic acid, acetic acid, L-carnitine, and fatty acid-free bovine serum albumin (BSA) were purchased from Sigma Aldrich (Saint-Quentin-Fallavier, France). William's E medium, Dulbecco's phosphate-buffered saline (PBS) Gibco™, glutamine, penicillin, streptomycin, formaldehyde, Nile red, and Hoechst 33342 dyes were obtained from Thermo Fischer Scientific (Waltham, MA). Radiolabeled [U-14C]palmitic acid and [2-14C]acetic acid, sodium salt were purchased from PerkinElmer (Waltham, MA). Hydrocortisone hemisuccinate was obtained from SERB Laboratories (Paris, France). Fetal bovine serum (FBS) was purchased from Eurobio (Les Ulis, France) and GE Healthcare (Little Chalfont, UK). Tauroursodeoxycholic acid (TUDCA) was purchased from Focus Biomolecules (Plymouth Meeting, PA).
2.2 Cell culture and treatments
Native HepaRG cells [19] were cultured as recently described [15]. Briefly, HepaRG cells were seeded in 96-well plates (density, 2.6 × 10⁴ cells/cm2) and were first incubated in William's E medium supplemented with 10% FBS (50% FBS from Eurobio and 50% FBS from GE Healthcare), 2-mM glutamine, 5-μg/mL insulin, 50-μM hydrocortisone hemisuccinate, 100-U/mL penicillin, and 100-μg/mL streptomycin. After 14 days, cell differentiation was stimulated by culturing HepaRG cells in the same medium supplemented with 1.7% DMSO for additional 14 days. During this 1-month period, the culture medium was renewed three times a week. Three days before busulfan treatment, FBS and DMSO concentrations were respectively lowered to 2% and 1% [15]. HepaRG cells were next cultured in the same FBS/DMSO conditions and incubated for 4 days with busulfan at different concentrations. Culture medium with or without busulfan was renewed every day, and all experiments were carried out after 96 h (i.e., 24 h after the fourth treatment). All investigations were carried out on passages 9 to 16. Busulfan, TUDCA, and ETA were dissolved in DMSO, whose concentration was fixed at 1% for control and treated cells. For investigations performed with TUDCA (4 mM) and ETA (10 μM), cells were first pretreated with either molecule for 2 h. The culture medium was then removed, and cells were cotreated with busulfan (1000 μM) and TUDCA, or ETA with the same protocol of 4-day treatment as the one described above.
Six batches of primary human hepatocytes (PHH) from different donors were purchased from Biopredic International (Saint-Grégoire, France). Donor's sex, age, ethnicity, liver pathology, and other information are provided in Table 1. Importantly, these PHH batches were the same as the ones used for our recent investigations [15]. Briefly, cells were seeded by the supplier in coated 96-well plates (density, 5 × 10⁴ cells/well). Upon receipt, culture medium was removed and replaced by William's E medium supplemented as described above for HepaRG cell differentiation, except for DMSO which was set at 1%. After 48–72 h, cells were treated with busulfan as for HepaRG cells. HepaRG cells and PHH were always maintained in incubators at 37°C with 5% CO2 and saturating humidity.
| Donor | Sex | Age (years) | Ethnicity | Liver pathology | Other information |
|---|---|---|---|---|---|
| 1 | Male | 71 | Unknown | Not available |
- Diabetes: No - Heart disease: Unknown - High blood pressure: Unknown - Smoking: No - Alcoholism: Unknown - Medication: Aspirin 100, Tahor, Inexium, Tamsulosin, Kardegic 75 |
| 2 | Female | 60 | Caucasian | Hepatic metastases |
- Diabetes: No - Heart disease: No - High blood pressure: No - Smoking: Yes - Alcoholism: No - Medication: Unknown |
| 3 | Female | 74 | Caucasian | Not available |
- Diabetes: No - Heart disease: No - High blood pressure: Yes - Smoking: No - Alcoholism: No - Medication: Unknown |
| 4 | Male | 74 | Caucasian | Hepatic metastases |
- Diabetes: Yes - Heart disease: No - High blood pressure: Yes - Smoking: No - Alcoholism: No - Medication: Metformin, Lercanidipine |
| 5 | Male | 75 | Unknown | Hepatocellular carcinoma |
- Diabetes: No - Heart disease: Unknown - High blood pressure: Unknown - Smoking: No - Alcoholism: Unknown - Medication: Unknown |
| 6 | Male | 65 | Caucasian | Not available |
- Diabetes: No - Heart disease: No - High blood pressure: No - Smoking: No - Alcoholism: No - Medication: Unknown |
2.3 Measurement of cellular ATP levels
Cellular ATP levels were measured using the CellTiter-Glo® Luminescent Cell Viability assay purchased from Promega (Charbonnières, France), according to the manufacturer's instructions. In brief, control and treated HepaRG cells were first washed with warm PBS and kept for 30 min in phenol red-free William's E medium. Cells were next incubated with the CellTiter-Glo® reagent for 10 min. Cells were then transferred in opaque-walled multiwell plates, and luminescence was quantified using a POLARstar Omega microplate reader (BMG Labtech, Ortenberg, Germany). All steps were performed at room temperature. Results were expressed in comparison to control cells.
2.4 Measurement of reduced GSH levels
To determine the levels of reduced GSH in HepaRG cells, the contents of three wells from a 96-well plate were combined and cell lysates were prepared using a 0.1% solution of NP-40. Subsequently, the cell lysates were deproteinized and neutralized using a 1% solution of trichloroacetic acid (TCA). The levels of reduced GSH concentration in each sample were then determined using a GSH detection kit (cat. No. ab205811) from Abcam (Boston, MA), employing a linear regression analysis of the GSH standard curve. Values expressed in nanomoles were normalized to total protein content determined using the Pierce BCA assay kit from Thermo Fischer Scientific (Waltham, MA).
2.5 Assessment of neutral lipids
The fluorescent Nile red dye allows the staining of neutral lipids, namely, triglycerides and cholesteryl esters [20]. Nile red staining and neutral lipid quantification normalized per number of Hoechst 33342-stained nuclei were carried out as recently described [15, 21]. Briefly, cells were washed with PBS, fixed and stained with PBS containing 4% formaldehyde and 10-μg/mL Hoechst 33342 dye for 30 min, and washed three times with PBS. Cells were then incubated with PBS containing 0.1-μg/mL Nile red for 30 min and washed once. Image acquisition was made with an automated epifluorescence microscope (ImageXpress Micro XLS, Molecular devices, San Jose, CA) using appropriate excitation/emission wavelengths, namely, 531/593 nm for Nile red and 350/461 nm for Hoechst 33342. Neutral lipids were then normalized per number of nuclei and expressed relative to control cells [15, 21].
2.6 Assessment of mitochondrial fatty acid oxidation with [U-14C]palmitic acid
Mitochondrial fatty acid oxidation (FAO) was assessed by measuring the acid-soluble radiolabeled metabolites resulting from the mitochondrial oxidation of [U-14C]palmitic acid, as recently described [15]. In brief, culture medium was removed and cells were washed with warm PBS before addition of phenol red-free William's E medium containing 1% fatty acid-free BSA, 100-μM cold palmitic acid, [U-14C]palmitic acid (185 Bq per well, corresponding to 0.5 pM), 1-mM L-carnitine, and 1% DMSO. After 3 h of incubation at 37°C, perchloric acid (final concentration, 6%) was added and plates were centrifuged at 2000g for 10 min, and supernatant was counted for [14C]-labeled acid-soluble β-oxidation products using a Tri-Carb 4910TR liquid scintillation counter (PerkinElmer). These [14C]-labeled acid-soluble β-oxidation products are deemed to be mainly ketone bodies and to a lesser extent intermediates of the tricarboxylic acid cycle [22]. Results were normalized to total protein content determined using the Pierce BCA assay kit from Thermo Fischer Scientific and expressed in comparison to control cells.
2.7 Assessment of de novo lipogenesis from [2-14C]acetic acid
De novo lipogenesis (DNL) was assessed by measuring newly synthesized radiolabeled lipids from [2-14C]acetic acid, as recently described [15]. Briefly, culture medium was removed and cells were washed with warm PBS. Next, cells were incubated for 3 h with phenol red-free William's E medium containing 1% fatty acid-free BSA, 50-μM cold acetic acid, and [2-14C]acetic acid (1850 Bq per well, corresponding to 19.4 pM). Medium was then removed, and cells were washed with warm PBS before adding a mixture of hexane/isopropanol (3/2;v/v). Cell culture plates were sealed and incubated for 1 h at room temperature for lipid extraction. After transfer of the plate content in 200-μL microtubes, hexane and PBS were added in order to have a hexane/isopropanol/PBS ratio of 6/2/3 (v/v/v). Microtubes were then centrifuged at 1000g for 5 min, and radiolabeled lipids were counted in the upper phase with a Tri-Carb 4910TR liquid scintillation counter (PerkinElmer). Results were normalized to total protein content and expressed in comparison to control cells.
2.8 Measurement of apolipoprotein B and C3 levels
Levels of apolipoprotein B (apoB) and apolipoprotein C3 (apoC3) were measured in cell supernatants as recently described [15]. Briefly, cell supernatants were removed and stored at −80°C until use for apolipoprotein measurement. ApoB level was measured using the Human Apolipoprotein B ELISApro kit from Mabtech (Nacka Strand, Sweden), according to the manufacturer's instructions. Absorbance at 450 nm was measured using a POLARstar Omega microplate reader (BMG Labtech). ApoB level was calculated utilizing a 4-parameter standard curve, normalized to the total cellular protein content, and expressed in comparison to control cells [15]. ApoC3 level was measured using the Human Apolipoprotein C3 kit from Cisbio Bioassays (Codolet, France), according to the manufacturer's recommendations. The detection principle of apoC3 is based on HTRF® (Homogeneous Time-Resolved Fluorescence), a time-resolved FRET (Förster Resonance Energy Transfer) technology. ApoC3 level was calculated utilizing standard curve, based on the ratio of A665 nm/A615 nm, and normalized to the total cellular protein content. Results were expressed in comparison to control cells [15].
2.9 Assessment of fatty acid uptake
Fatty acid uptake was measured by using the Fatty Acid Uptake kit (Sigma-Aldrich). Briefly, HepaRG cells were washed with warm PBS and incubated at 37°C for 1 h in an unsupplemented William's E medium. Cells were then washed with warm PBS and incubated with a fluorescent probe derived from dodecanoic acid (TF2-C12) for 1 h at 37°C. After two washes with PBS, fluorescent intensity was measured using a POLARstar Omega microplate reader (BMG Labtech) with excitation/emission wavelengths at 482/520 nm. TF2-C12 fluorescence intensity values were then normalized per number of nuclei using Hoechst 33342 fluorescence, and results were expressed relative to control cells.
2.10 Isolation of RNA and measurement of gene expression
Total RNA was extracted with the Nucleospin RNA isolation system purchased from Macherey-Nagel (Düren, Germany), which included a DNase treatment step. Quantification of isolated RNAs was assessed using a Nanodrop 1000 (Thermo Fischer Scientific, Waltham, MA). RNAs were reverse-transcribed into cDNAs using the High-Capacity cDNA Reverse Transcription Kit purchased from Applied Biosystems (Woolston, UK). Gene expression was assessed by real-time quantitative PCR analysis (RT-qPCR) using SYBR Green PCR Master Mix (Applied Biosystems, Woolston, UK) and a 384-well QuantStudio™ 7 Flex Real-Time PCR System (Thermo Fischer Scientific, Waltham, MA). Sequences of the primers used to measure gene expression are presented in Table 2. Expression of GAPDH was chosen as a reference, and the 2−ΔΔCt calculation method was used to express the relative expression of each selected gene.
| Gene symbol (and alias) | Gene name | Accession number | Forward primer (5′-3′) | Reverse primer (5′-3′) |
|---|---|---|---|---|
| ANGPTL3 | Angiopoietin like 3 | NM_014495.4 | TACGCTACATCTAGTTGCGATTAC | CCACCAGCCTCCTGAATAAC |
| APOB | Apolipoprotein B | NM_000384.2 | CCCTCAGTCCTCTCCAGATAAA | GCTGCCTCTTCTTCCCAATTA |
| APOC3 | Apolipoprotein C3 | NM_000040.3 | TCTGCCCGAGCTTCAGA | GCTGCTCAGTGCATCCTT |
| ATF6 | Activating transcription factor 6 | NM_007348.4 | GTCAGAGAACCAGAGGCTTAAA | CCAACATGCTCATAGGTCCATA |
| CD36 (FAT) | CD36 molecule | NM_001001548.2 | GCCAGGTATTGCAGTTCTTTTC | TGTCTGGGTTTTCAACTGGAG |
| DDIT3 (CHOP) | DNA damage-inducible transcript 3 | NM_001195053.1 | GTCTAAGGCACTGAGCGTATC | CACTTCCTTCTTGAACACTCTCT |
| EIF2AK3 (PERK) | Eukaryotic translation initiation factor 2 alpha kinase 3 | NM_004836.7 | GACCTCAAGCCATCCAACATA | CTGGTCCATTGCAGTCACTAA |
| ERN1 (IRE1α) | Endoplasmic reticulum to nucleus signaling 1 | NM_001433.5 | CCAGACAGACCTGCGTAAAT | CCGGTAGTGGTGCTTCTTATT |
| GAPDH | Glyceraldehyde-3-phosphate dehydrogenase | NM_001256799.2 | AGCCTCAAGATCATCAGCAAT | GTCATGAGTCCTTCCACGATAC |
| HSPA5 (BIP) | Heat shock protein family A (Hsp70) member 5 | NM_005347.5 | TGGAGGTGGGCAAACAAA | AACTGCATGGGTAACCTTCTT |
| MTTP | Microsomal triglyceride transfer protein | NM_000253.3 | TACCAGGCTCATCAAGACAAAG | CTGACACCCAAGACCTGATTT |
| P4HB (PDI) | Prolyl 4-hydroxylase subunit beta | NM_000918.4 | TCGTGAACTGGCTGAAGAAG | GACTCCACGTCCTTGAAGAAG |
2.11 Data mining and transcriptomic data analysis
In the present study, we analyzed the transcriptomic datasets GSE25844 [23] and GSE41289 [24], which overall were obtained from several replicates of native HepaRG cells and 12 different PHH batches. Transcriptomic data analyses comparing HepaRG cells and PHH were then performed separately using GEO2R, a bioinformatics tool from the National Center for Biotechnology Information [25]. The fold change of expression between HepaRG cells and PHH was then calculated, and adjusted p-values were determined with the Benjamini & Hochberg false discovery rate method.
2.12 Statistical analysis
All results are expressed as mean with standard deviation (SD). Statistical analyzes were carried out using GraphPad Prism software V6.07. For each data analysis, the Kolmogorov–Smirnov normality test was performed. Comparisons between multiple groups were performed using a one-way analysis of variance (ANOVA), followed by a Newman–Keuls multiple comparisons test.
3 RESULTS
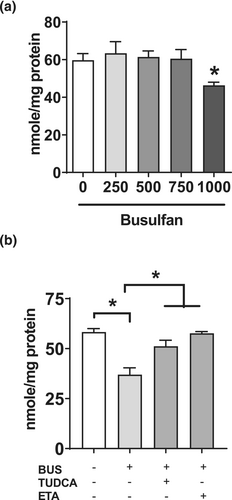
In our previous study, drug-induced steatosis in differentiated HepaRG cells was assessed with drug concentrations that did not induce severe mitochondrial dysfunction [15]. This allowed us to disclose that drug-induced lipid accumulation could be induced by at least four mechanisms, namely, moderate impairment of mitochondrial FAO, increased DNL, inhibition of VLDL secretion, and possibly enhanced fatty acid uptake [15]. Noteworthy, severe mitochondrial dysfunction was defined as a loss of cellular ATP levels in treated HepaRG cells greater than 30% of the control cells [15], in accordance with previous investigations [26-28]. Hence, in the present study, we first assessed the effect of different concentrations of busulfan on ATP levels in HepaRG cells. Our results showed that busulfan concentrations above 750 μM led to a concentration-dependent loss of cellular ATP levels. Indeed, ATP levels were reduced by 23%, 53%, 75%, and 99% in HepaRG cells treated with 1000, 1250, 1500, and 2000 μM of busulfan, respectively (Figure 2a). Hence, a maximum concentration of 1000 μM was used for subsequent experiments in order to avoid severe mitochondrial dysfunction.
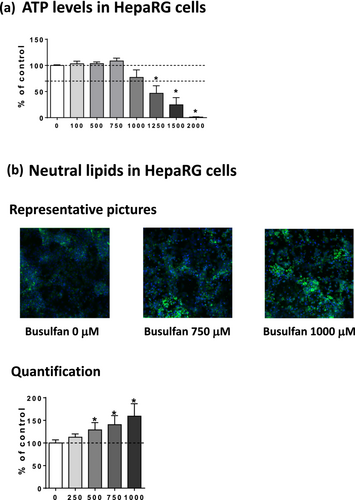
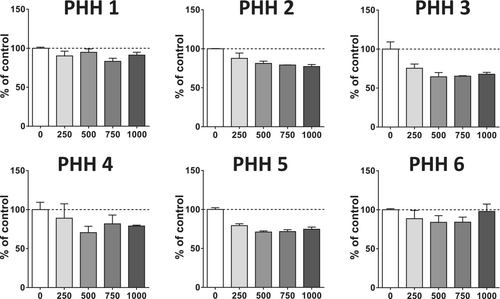
Next, we evaluated the effects of busulfan on neutral lipids in HepaRG cells (Figure 2b). Neutral lipid level was significantly enhanced by 29%, 41%, and 59% in HepaRG cells treated with 500, 750, and 1000 μM, respectively (Figure 2c). In sharp contrast, busulfan did not induce steatosis in six different PHH batches (Figure 3). This drug even tended to lower neutral lipids in some PHH batches, as for PHH 2, 3, and 5 (Figure 3). Although we did not assess busulfan-induced cytotoxicity in these PHH batches, recent investigations in three different PHH batches showed that busulfan induced significant cytotoxicity (assessed with the CellTiter-Blue assay) with a median EC50 greater than 1000 μM for 1 and 2 days of treatment and equal to 210 μM after 7 days [29]. Hence, these data suggested that the absence of steatosis in PHH treated by busulfan could not be attributed to a lack of responsiveness of these cells to the antineoplastic drug.
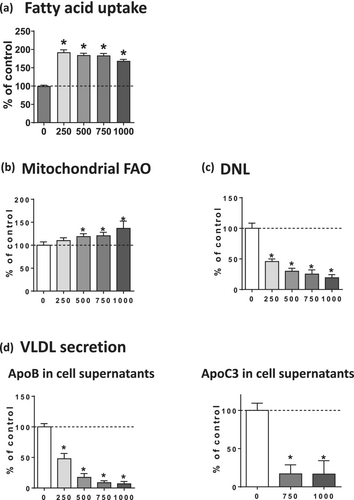
In order to determine the mechanisms whereby busulfan could induce steatosis in HepaRG cells, fatty acid uptake, mitochondrial FAO, DNL, and VLDL secretion were investigated by measuring the corresponding metabolic fluxes. Fatty acid uptake was significantly enhanced by 92%, 85%, 84%, and 69% with 250, 500, 750, and 1000 μM of busulfan, respectively (Figure 4a). Mitochondrial FAO was significantly increased by 10%, 21%, and 37% with 500, 750, and 1000 μM of busulfan, respectively (Figure 4b), whereas DNL was significantly decreased by 54%, 70%, 75%, and 81%, with 250, 500, 750, and 1000 μM of this drug, respectively (Figure 4c). Finally, apoB and apoC3 secretion in the culture medium was strongly reduced by busulfan (Figure 4d), thus indicating a severe impairment of VLDL secretion [15]. Hence, our results suggested that busulfan-induced steatosis could be secondary to a dual mechanism, namely, increased fatty acid uptake and reduced VLDL secretion. Of note, increased mitochondrial FAO and reduced DNL fluxes in the face of drug-induced steatosis in HepaRG cells might represent an adaptation in order to limit lipid accumulation [15]. In keeping with this hypothesis, the lack of significant increase in neutral lipids induced by 250-μM busulfan (Figure 2b) might be due to the presence of a strong reduction of DNL that was concomitant to increased fatty acid uptake and reduced apoB secretion (Figure 4). Nonetheless, further investigations at different time points might be of interest to confirm whether higher mitochondrial FAO and lower DNL fluxes represent adaptive mechanisms.
By measuring gene expression, we found that FAT/CD36 mRNA levels were markedly increased by 5.5- and 8.2-fold with 750- and 1000-μM busulfan, respectively (Figure 5a), thus suggesting that FAT/CD36 upregulation might be involved in the stimulation of fatty acid uptake induced by busulfan (Figure 4a). Next, we measured the mRNA expression of several key proteins (APOB, APOC3, ANGPTL3) and enzymes (MTTP, P4HB) involved in VLDL formation and secretion [15]. Notably, we found a significant and sometimes profound reduction in the mRNA levels of APOB (coding for apolipoprotein B), APOC3 (coding for apolipoprotein C3), MTTP (coding for microsomal triglyceride transfer protein), and ANGPTL3 (coding for angiopoietin-like 3) (Figure 5b), whereas the expression of P4HB (coding for prolyl 4-hydroxylase subunit beta) was unchanged (data not shown).
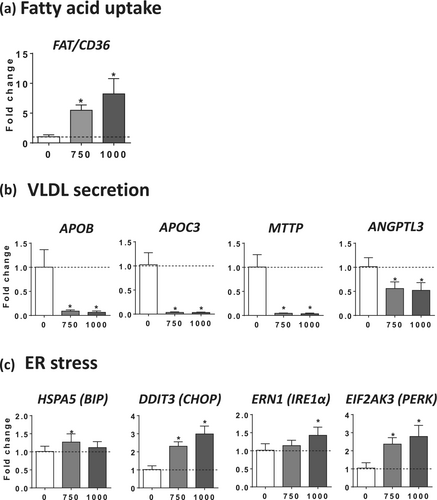
Since our recent investigations unveiled that drug-induced impairment of VLDL secretion was always associated with endoplasmic reticulum (ER) stress [15], we assessed the mRNA levels of five different proteins involved in ER stress-induced unfolded protein response (UPR), namely, heat shock protein family A member 5 (HSPA5, also known as BIP), DNA damage-inducible transcript 3 (DDIT3, also known as CHOP), endoplasmic reticulum to nucleus signaling 1 (ERN1, also known as IRE1α), eukaryotic translation initiation factor 2 alpha kinase 3 (EIF2AK3, also known as PERK), and activating transcription factor 6 (ATF6). Interestingly, the mRNA abundance of BIP, CHOP, IRE1α, and PERK was significantly enhanced by 750 and 1000 μM of busulfan, albeit with different magnitudes (Figure 5c). In contrast, ATF6 expression was not significantly increased (data not shown).
Next, we wished to understand why busulfan induced steatosis in HepaRG cells but not in PHH. Because previous investigations in mouse hepatocytes suggested that busulfan-induced toxicity might be linked to GST-catalyzed formation of the sulfonium cation conjugate [4], we compared the expression of GSTA1, GSTM1, GSTP1, and GSTT1 between HepaRG cells and 12 different batches of PHH by using two different transcriptomic datasets, namely, GSE25844 [23] and GSE41289 [24]. Notably, investigations in HepaRG cells used to generate these datasets were performed by investigators from our laboratory with the same native HepaRG cells used in the present study. GSTA1 expression was much higher in HepaRG cells than in PHH, while GSTP1 expression was much lower in HepaRG cells than in PHH (Table 3). GSTT1 expression was lower in HepaRG cells than in PHH, but the difference was significant only in the GSE41289 dataset (Table 3). Finally, results for GSTM1 expression showed opposite results between both datasets (Table 3). Hence, busulfan-induced steatosis in HepaRG cells might be related to high GSTA1 expression, which in turn could lead to the formation of high level of sulfonium cation conjugate.
| HepaRG cells vs PHH | ||||
|---|---|---|---|---|
| GSE25844 | GSE41289 | |||
| Fold change | Adjusted p-value | Fold change | Adjusted p-value | |
| GSTA1 | 8.00 | 3.8E-05 | 7.94 | 3.3E-20 |
| GSTM1 | 1.93 | 0.333 | 0.67 | 2.8E-03 |
| GSTP1 | 0.01 | 9.6E-06 | 0.00 | 1.6E-20 |
| GSTT1 | 0.74 | 0.398 | 0.66 | 2.4E-05 |
In order to test this hypothesis, levels of reduced GSH were measured in HepaRG cells treated with different concentrations of busulfan. Interestingly, 1000-μM busulfan significantly decreased the levels of reduced GSH by 25%, whereas lower concentrations were without effect (Figure 6a). We also measured reduced GSH levels in cells treated with 1000-μM busulfan in the absence or presence of ethacrynic acid (ETA), a diuretic drug known to inhibit different human GST isoenzymes, in particular GST of the alpha-class [30, 31]. Importantly, ETA almost fully prevented the decrease in reduced GSH levels induced by 1000-μM busulfan (Figure 6b), thus suggesting that this reduction could be secondary to the formation of busulfan GSH-conjugate. In addition, the chemical chaperone tauroursodeoxycholic acid (TUDCA) partially but significantly alleviated busulfan-induced lowering of reduced GSH (Figure 6b).
We next determined the potential protective effect of ETA on busulfan-induced lipid accumulation. Furthermore, since busulfan appeared to induce ER stress, we wished to determine whether TUDCA could protect against busulfan-induced steatosis as it did for the pharmaceuticals allopurinol, indomethacin, and rifampicin and for the prototypical ER stress inducer tunicamycin [15]. Interestingly, both ETA and TUDCA alleviated lipid accumulation induced by 1000-μM busulfan (Figure 7a).
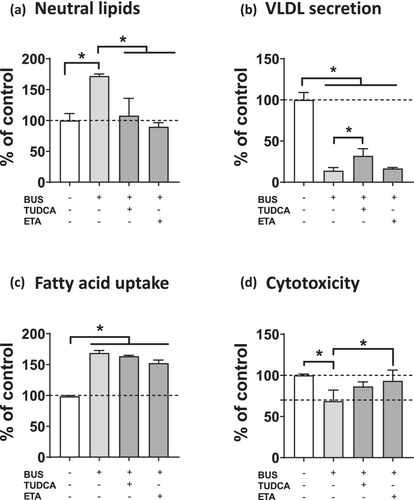
We also tested the ability of ETA and TUDCA to restore the reduction of VLDL secretion and the increase in fatty acid uptake stimulation induced by 1000-μM busulfan. Only TUDCA partially but significantly alleviated ApoB secretion (Figure 7b), whereas ETA tended (P = 0.09) to reduce fatty acid uptake (Figure 7c). Of note, both ETA and TUDCA alleviated busulfan-induced cytotoxicity (as assessed with ATP), although the protective effect was significant only for ETA (Figure 7d).
4 DISCUSSION
In this study, the anticancer busulfan induced a marked accumulation of neutral lipids in HepaRG cells, while no steatosis was observed in six different batches of PHH. Indeed, busulfan caused significant neutral lipid accumulation in HepaRG cells in a concentration-dependent manner from 500 to 1000 μM, while the same concentrations in PHH had no effect or tended to decrease intracellular lipids. Of note, the lack of steatosis in PHH is in line with the fact that busulfan-induced steatosis has not been reported so far in treated patients [11, 12]. However, we cannot exclude the possibility that more PHH batches would have been necessary to uncover the possible steatogenic potential of this antineoplastic agent. Hence, we wished to determine the mechanism(s) whereby busulfan induced lipid accumulation in HepaRG cells and understand why this drug was not steatogenic in PHH.
Busulfan-induced steatosis in HepaRG cells was observed for concentrations ranging from 500 to 1000 μM. Importantly, the upper values of the maximum plasma concentrations (Cmax) of busulfan in patients were found to be around 15 μM (i.e., 3.7 μg/L) [32, 33]. Hence, 1000-μM busulfan is below 100 × Cmax, a threshold classically used in toxicological studies pertaining to drug-induced liver injury [15, 34, 35]. Of note, concentrations of busulfan between 625 and 2500 μM were previously used to study the mechanisms of its toxicity in cultured murine hepatocytes [4].
The initial goal of this study was to determine the mechanism(s) whereby busulfan caused steatosis in HepaRG cells. Our data suggested that a first mechanism of busulfan-induced steatosis could be an impairment of VLDL secretion (Figure 8), as reflected by reduced levels of both apoB and apoC3 in the cultured medium. Impairment of VLDL secretion might be linked to reduced mRNA levels of different proteins and enzymes playing a significant role in VLDL assembly, particularly APOB, APOC3, MTTP, and ANGPTL3, although we cannot rule out other mechanisms such as direct apoB protein degradation [15]. In addition, reduced VLDL secretion was associated with enhanced expression of four proteins involved in ER stress-induced UPR, namely, HSPA5 (BIP), DDIT3 (CHOP), ERN1 (IRE1α), and EIF2AK3 (PERK), thus extending our recent data with seven steatogenic drugs showing that impairment of VLDL secretion in HepaRG cells was always associated with ER stress [15]. ER stress could alter VLDL secretion by different mechanisms such as specific degradation of mRNA of key proteins involved in VLDL assembly through regulated IRE1α-dependent decay (RIDD), decreased MTTP expression and activity, and apoB degradation via both proteasomal and non-proteasomal pathways [15, 36-38]. Importantly, the chemical chaperone TUDCA significantly alleviated busulfan-induced steatosis and partially restored apoB secretion, thus indicating that ER stress could be involved, at least in part, in VLDL secretion impairment and triglyceride accumulation (Figure 8). Of note, previous investigations in different experimental models showed that reducing ER stress in hepatocytes can alleviate intracellular lipid accumulation [39-41].
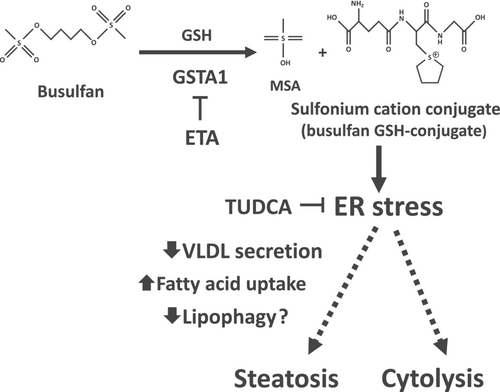
Although ETA alleviated steatosis, this GST inhibitor did not restore VLDL secretion. Hence, we surmise that busulfan-induced steatosis might involve a second mechanism, possibly increased uptake of fatty acids (Figure 8). In keeping with this hypothesis, busulfan markedly enhanced fatty acid uptake, possibly via upregulation of FAT/CD36 expression. However, although several investigations reported a close relationship between ER stress and high FAT/CD36 expression [42-44], TUDCA did not significantly reduce fatty acid uptake. Several reasons might explain this discrepancy: (a) ER stress might have a limited impact on the kinetics of fatty acid uptake; (b) the protocol of TUDCA exposure might not have been optimal to prevent ER stress-induced stimulation of fatty acid uptake; (c) TUDCA could have alleviated adverse events other than ER stress that might also play a role in busulfan-induced steatosis. For instance, TUDCA was shown to afford protection against mitochondrial dysfunction and oxidative stress and to activate several intracellular signaling pathways secondary to its binding to membrane-bound integrins [45-48].
In addition to reduced triglyceride secretion and increased fatty acid uptake, other mechanisms of busulfan-induced steatosis cannot be excluded. For instance, it would be interesting to determine whether busulfan could inhibit lipase-mediated lipid droplet lipolysis and/or lipophagy (i.e., a specific type of autophagy targeting lipid droplets), which would favor lipid accumulation [49-51] (Figure 8). Interestingly, previous investigations suggested that in some circumstances, ER stress can impair lipophagy/autophagy, thus contributing to fatty liver but also to hepatocyte death [40, 52, 53].
Of note, previous investigations showed that busulfan induced ER stress in mouse testis and spermatogonial stem cells [54, 55], thus suggesting that this antineoplastic drug can trigger ER stress in different tissues. Moreover, busulfan was shown to induce oxidative stress in murine hepatocytes, as assessed by increased GSSG levels and lipid peroxidation [4]. Because there are possible interrelationships between oxidative stress and ER stress [56, 57], further investigations would be needed in order to determine whether busulfan-induced ER stress is secondary to oxidative stress or vice versa.
The second goal of the present study was to understand why busulfan triggered steatosis in HepaRG cells but was not steatogenic in PHH. Our working hypothesis was that high GST expression in HepaRG cells might generate the sulfonium cation conjugate, which was deemed to be the toxic busulfan metabolite in murine hepatocytes (Figure 1) [4]. To this end, we first compared the mRNA expression of GSTA1, GSTM1, GSTP1, and GSTT1 between HepaRG cells and PHH. We found that GSTA1, which plays a predominant role in busulfan conjugation [2, 5, 6], was much more expressed in HepaRG cells than in PHH (Table 3). Importantly, a global proteomic analysis using liquid chromatography–tandem mass spectrometry (LC–MS/MS) previously reported a higher abundance of the GSTA1 protein in HepaRG cells compared with cryopreserved PHH [58]. Hence, HepaRG cells might be able to accumulate more sulfonium cation conjugate than PHH, thus triggering ER stress, impairment of lipid metabolism, and steatosis (Figure 8). In line with this hypothesis, GST inhibition with ETA significantly alleviated busulfan-induced decrease in reduced GSH levels and steatosis, although this was not associated with a restoration of apoB secretion. As previously mentioned, this result suggests that impairment of VLDL secretion might not be the primary mechanism of lipid accumulation induced by busulfan (Figure 8). It is also noteworthy that ETA was able to prevent busulfan-induced cytotoxicity in HepaRG cells. Hence, ER stress might also be involved, at least in part, in busulfan-induced cytolysis (Figure 8). In keeping with this assumption, TUDCA partially restored busulfan-induced cytolysis and this was associated with a partial restoration of GSH levels. This suggested that ER stress might also be involved in GSH level reduction, as previously reported [57, 59]. Thus, busulfan-induced decrease in reduced GSH levels could be secondary to its consumption for the generation of the sulfonium cation conjugate and also to ER stress. The lack of GSH level reduction in HepaRG cells treated with 750-μM busulfan (that induced steatosis and ER stress) might be secondary to a compensatory enhancement of GSH synthesis, as previously described under some conditions of cellular stress [60, 61].
Our results showed that busulfan did not induce steatosis in PHH. Moreover, this anticancer agent even tended to decrease neutral lipids in some PHH batches. Because busulfan increased mitochondrial FAO and reduced DNL in HepaRG cells these metabolic changes could also occur in these PHH batches, thus leading to fewer intracellular lipids. However, this hypothesis does not exclude the possibility that higher mitochondrial FAO and lower DNL also participate in the adaptive response aiming to limit neutral lipid accretion in HepaRG cells, as already mentioned.
As mentioned above, busulfan-induced steatosis has never been reported so far in treated patients [11, 12]. However, this does not mean that macrovacuolar steatosis never occurred in some patients. Indeed, this liver lesion can develop without clinical and biological signs, and thus, it can be silent for years [62, 63]. Furthermore, busulfan-induced steatosis might occur only in patients with high hepatic GSTA1 expression, as the one found in the female patient whose liver tumor was used for the isolation of the HepaRG cell line [19]. Notably, various factors can significantly modulate GSTA1 expression including genetic polymorphism [64], hormones [65], and cytokines [66]. Whether high GSTA1 expression is uncommon in the general population would require further investigations. It is also worth mentioning that different xenobiotics including drugs, environmental toxins, and plant compounds can induce the hepatic expression and activity of GSTs [67-69]. Hence, patients exposed to these xenobiotics might be at risk of busulfan-induced hepatotoxicity.
Previous studies showed that GST-mediated biotransformation of some xenobiotics can generate glutathione conjugates that can be cytotoxic [70, 71]. For instance, this has been shown with dibromomethane, perfluoropropene, hexachlorobutadiene, trichloroethene, and bromobenzene [70, 71]. Hence, for some molecules including busulfan, GST-catalyzed GSH conjugation is associated with bioactivation rather than detoxication.
Notably, busulfan-induced cellular effects in HepaRG cells were quite similar to those induced by tunicamycin and thapsigargin. Indeed, like both prototypical ER stress inducers [15], busulfan induced ER stress, impairment of VLDL secretion, and steatosis. Moreover, busulfan increased mitochondrial FAO and reduced DNL, similar to tunicamycin and thapsigargin [15]. Further investigations are warranted to determine whether sulfonium cation conjugate (i.e., busulfan GSH conjugate) impairs the glycosylation of newly synthesized proteins like tunicamycin and/or inhibits the sarcoplasmic/endoplasmic reticulum calcium ATPase (SERCA) like thapsigargin [56].
Previous investigations showed that the HepaRG cell line is an invaluable tool to investigate drug-induced steatosis [15-18] and other types of hepatotoxicity such as cholestasis and hepatocyte cell death [72-75]. Nevertheless, the present study suggests that this might not be always an appropriate model to predict drug-induced hepatotoxicity. In addition, this cell line could identify molecular mechanisms that are potentially not relevant in the clinic, or that might occur only rarely in the general population. Thus, we strongly recommend carrying out in vitro toxicological investigations in both HepaRG cells and PHH in order to avoid drawing wrong conclusions on the potential hepatoxicity of xenobiotics including drugs. Nevertheless, while both types of cells can be used to search for different patterns of hepatotoxicity such as steatosis, cytolysis, and cholestasis, HepaRG cells are better suited for mechanistic investigations than PHH, whose availability is increasingly limited [76, 77]. Finally, our study highlights that novel in vitro tools should require thorough characterization in order to determine the potential artefactual expression of some proteins or the presence of metabolic pathways that could differ from the in vivo situation.
AUTHOR CONTRIBUTIONS
Bernard Fromenty drafted the original manuscript. Julien Allard, Simon Bucher, Pierre-Jean Ferron, and Youenn Launay performed the experiments and critically amended the manuscript. All the authors have read and approved the final version of the manuscript.
ACKNOWLEDGMENTS
We are grateful to the Agence Nationale de Sécurité du Médicament (ANSM) for the financial support granted for the PREVITOX network and to INSERM (Institut National de la Santé et de la Recherche Médicale) for its constant financial support. We would like to thank Dr. Pascal Loyer (Institut NuMeCan, Rennes, France) for his help and advice regarding the experiments carried out with the radiolabeled molecules and Dr. Anne Corlu for her tremendous expertise in HepaRG cell function and culture. We are grateful to Dr. Kyle Hoehn (University of New South Wales, Sydney, Australia) for having given us the detailed protocol to investigate de novo lipogenesis in cultured cells.
CONFLICT OF INTEREST STATEMENT
J. Allard, S. Bucher, P-J. Ferron, Y. Launay, and B. Fromenty declare that they have no conflict of interest in relation to this work.


