Skin inflammatory signatures, as measured by disordered spatial redness patterns, predict current and future skin ageing attributes
Abstract
Facial skin redness can be an indicator of skin inflammation, however the physiological connection between facial redness and inflammatory status, as well as its role in age-related skin changes, remains poorly understood. This study aims to investigate the association between the pattern of facial skin redness and biological inflammatory status, as well as age-related changes occurring in the skin. Four studies were conducted recruiting healthy Northern Asian females. Disordered spatial patterns of facial skin redness signals were assessed using image analysis, i.e., the a* gradient algorithm, which quantifies the disordered shape and pattern of localized redness signals on facial skin. This redness pattern was compared with (1) inflammatory protein markers (IL-1Ra/ IL-1α and IL-8) measured from stripped corneocyte samples, (2) gene expression profiles obtained through transcriptome analysis using skin biopsy samples, and (3) the distribution pattern of blood vessel measured using a photoacoustic microscope. The association between the skin redness pattern and current and future ageing-related skin changes was examined through a longitudinal study tracking the same subjects for 10 years. A significant correlation was observed between the a* gradient and the levels of inflammatory cytokines (IL-1Ra/IL-1α and IL-8). Transcriptome analysis revealed upregulation of genes related to acute inflammation, chronic inflammation, cellular senescence, and angiogenesis in subjects with higher a* gradients. The high a* gradient group exhibited an extension of blood vessel diameter and increased blood vessel density, while the medium a* gradient group only exhibited blood vessel extension. Lastly, the 10-year longitudinal study demonstrated that the a* gradient was associated with current and future skin ageing-related attributes, such as increased skin texture and wrinkle formation. The spatial pattern of localized redness on the skin reflects the biological inflammatory status, and this inflammatory condition helps predict current and future age-related skin changes.
1 INTRODUCTION
With the progression of chronological ageing, facial skin experiences distinct changes in its attributes, such as the formation of wrinkles, enlargement of texture and pores, appearance of pigmented spots and loss of colour homogeneity. Therefore, it is a common concern among humans to enhance their attractiveness and preserve a youthful appearance through the improvement and prevention of these skin changes.1
Transient and acute inflammation is an essential physiological response of the body to biological, chemical and/or physical stimuli, aimed at eliminating and repairing damaged cells caused by these stressors. On the other hand, prolonged and/or repeated inflammatory damage has been shown to trigger chronic inflammation and cellular senescence which play significant roles in the development of numerous diseases affecting various organs; rheumatic disease, atherosclerosis, diabetes, cancer and more.2-8 Given that our skin is constantly exposed to stressors, such as UV radiation, air particulate, dryness and physical irritations, it is widely recognized that these factors can locally induce chronic inflammation and cellular senescence within the skin itself. Although the understanding of the connection between the skin inflammation and its visible skin appearance is still limited, experimental evidence has demonstrated that chronic inflammation in the skin leads to significant cellular changes, including the degradation of the extracellular matrix and heightened melanogenesis. Consequently, it is evident that chronic inflammation and cellular senescence contribute to the development of ageing phenotypes, such as wrinkles and pigmentation.9-12 Therefore, the identification and treatment of inflammatory signals at an early stage can be a beneficial strategy for preventing the development of chronic inflammation and age-related skin problems. Biological markers for chronic inflammation, acute inflammation and cellular senescence have been identified, however, the detection of these markers usually involves the collection of punch biopsy samples or, at minimum, stratum corneum samples. Alternatively, employing image analysis techniques using colour skin images can be explored as a simpler method. However, it should be acknowledged that the application of this approach is not yet well-established based on our current knowledge.
In the previous article,13 we introduced a novel image analysis algorithm called a* gradient, which quantifies the disordered shape and pattern of localized redness signals on facial skin. These redness signal patterns have demonstrated a correlation with human perception of inflamed and unhealthy skin. We postulate that this imaging method may serve as a valuable tool for not only assessing human perception but also evaluating the underlying biological inflammatory condition. This article aims to evaluate two key aspects, (1) the relationship between the a* gradient and the biological inflammatory status, and (2) the association between the inflammatory condition and the ageing-related changes occurring in the skin.
2 MATERIALS AND METHODS
A total of four studies were conducted to generate data for evaluating the association between skin imaging attributes and biometric attributes. Prior to measuring the subjects, their faces were washed using a standardized cleansing method. Subsequently, the subjects were acclimated in a facility maintained at 21 ± 1°C and 45% ± 5% relative humidity.
2.1 Subjects for the study for tape strip sampling for IL analysis
A total of 59 females, ranging in age from 20 to 50, were randomly selected from a pool of 171 healthy Chinese females residing in Beijing to participate in the study (R7). Each subject provided written and witnessed informed consent, which outlined the objectives, risks and benefits of the study, upon enrollment. The study protocol was approved by the Ethical Committee of Global Product Stewardship in P&G International Operations (SA) Singapore Branch (ethical approval number SG21-0018).
2.2 Subjects for the study for biopsy collection
A total of 150 healthy Chinese female ranging in age from 20 to 50 were enrolled in the study at Shanghai Dermatology Hospital in China in 2015. Cheek biopsies (2 mm) were obtained using protocols approved by the Institute Review Board of Shanghai Skin Disease Hospital (Approval Number 2014#11). Biopsies were embedded in Optimum Temperature Compound (Sukura Finetek, Torrance, CA) before freezing over liquid nitrogen and stored at −80°C until cryostat sectioning for transcriptome analysis.
2.3 Subjects for the study for 3D blood vessel pattern scanning
A total of 34 healthy East Asian females ranging in age from 18 to 45, including Chinese, Singapore Chinese, Korean and Japanese individuals, residing in Singapore were enrolled in the study. Each subject provided written and witnessed informed consent, which outlined the objectives, risks and benefits of the study, upon enrollment. The study protocol was approved by the Ethical Committee of Global Product Stewardship in P&G International Operations (SA) Singapore Branch (ethical approval number SG23-0018).
2.4 Subjects for the study for tracking 10-year skin changes
A total of 452 healthy Chinese females were enrolled in the study, with a subset of 185 subjects completing two visits in Nov 2006 and Nov 2016. The age range of the subjects who completed both visits was 10–66 (mean = 40.2, SD = 14.3) at the time of their enrollment in Nov 2006. Each subject provided written and witnessed informed consent, which outlined the objectives, risks and benefits of the study, upon enrollment. The study was executed strictly following protocol agreed by PI (CSD2016224). Because the conditions of imaging hardware changed between 2006 and 2016, absolute values for each image analysis were compared only within each database.
2.5 Facial skin image collection and objective analysis
Full-face 2D images were captured using Visia-CR® imaging system (Canfield Scientific, USA). Visia-CR® is a commercially available clinical imaging device.14, 15 It is capable of capturing the entire face area using various light modalities. We used the standard 1 (S1) modality for wrinkle and texture analysis and cross-polarized (XP) modality for spots and a* gradient analysis. The region of interest (ROI) for image analysis extended from the outer edge of the eye to the cheek, and binary masks for selecting the ROI were manually created to detect the target skin attributes within the ROI. Customized image analysis methods reported previously, were employed to measure wrinkle area fraction, texture area fraction, spot area fraction and a* gradient.1, 13, 16 The original size of images (3648 × 5472 pixel) were used for a* gradient algorithm. The images were resized into 2016 × 3024 pixel for compatibility before being applied to the other image analysis algorithms. The number of pixels of skin attributes detected by each algorithm was normalized by ROI area and used for statistical analysis as area fraction values. To evaluate the contribution of the a* gradient to each skin measurement and biological endpoint, cohort analysis was performed by dividing the subjects in each study into three groups based on their a* gradient values. subjects with a* gradients within the ±30% of SD from the mean, were classified into the medium a* gradient group. subjects with a* gradients above the range were classified into the high a* gradient group and subjects with a* gradients below the range were classified in the low a* gradient group.
2.6 Analysis of IL-1Ra/ IL-1α and IL-8 with stripped stratum corneum samples
Stratum corneum samples were collected using 22 mm D-Squame tapes (D-Squame®, CuDerm, Dallas TX, USA) through tape stripping. Seven consecutive tapes were collected from the same area on both sides of the cheek and stored at −80°C until further analysis.17 Cytokines (IL-1Ra, IL-1α and IL-8) and soluble protein were quantified using the second and third tapes. D-Squame® tapes collected from subjects were extracted with phosphate-buffered saline (PBS) containing an additional 0.25 M NaCl and a commercially available protease inhibitor cocktail containing a mixture of protease inhibitors with broad-spectrum inhibitory specificity (Roche Diagnostics GmbH, Mannheim, Germany) for 30 min with sonication on ice. The extracts were then centrifuged for 5 min at 3000 rpm to remove skin solids that might interfere in the assay. Aliquots of these extracts were then analysed for soluble protein using the Pierce BCATM Protein Assay Kit (Thermo Scientific, Rockford, IL, USA) using bovine serum albumin (BSA) as a reference standard. Other aliquots of the tape extracts were supplemented with 2% BSA, transferred into 96-well polypropylene deep-well plates and frozen at −70°C for cytokine analysis. Human cytokines IL-1α and IL-1Ra were simultaneously quantitated using a Bio-Plex Pro™ multiplex immunoassay kit (Bio-Rad Laboratories, Inc, Hercules, CA, USA), while IL-8 was measured using MSD V-PLEX Proinflammatory Panel 1 Human Kit (MESO Scale Diagnostics, Rockville, MD, USA). The ratio of IL-1Ra to IL-1α (IL-1Ra/IL-1α) and IL-8 to total protein were compared among three a* gradient groups. Statistical analysis was performed using the Student's t-test on log-transformed data using JMP® Pro 17.1.0 (SAS Institute Inc., Cary, NC, USA).
2.7 Preparation of collected biopsies for transcriptome analysis
For transcriptome analysis, biopsies were separated into three compartments by Laser Capture Microdissection (LCM) to enrich cell biological information. Basal epidermis, supra-basal epidermis and dermal LCM fractions were collected from ten 14 μm serial sections of each biopsy and pooled to create one sample per fraction for each subject from which total RNA was isolated. The dermis is defined as the tissue remaining following the removal of all epidermal appendages (hair follicles, sebaceous glands and sweat glands) and subcutaneous adipose tissue.
2.8 Transcriptome analysis, statistics, bioinformatics and data presentation
Transcriptome analysis was performed by using Affymetrix GeneTitan® U219 array plates (Affymetrix, Santa Clara, CA) with the Affymetrix GeneTitan® instrument and protocol provided. Following processing, chip images were converted to numeric data using the PLIER algorithm as executed in the Affymetrix Gene Chip Expression Console. R packages (R Core Team: http://www.R-project.org/) were used for statistical analyses and graph generation. Differentially expressed probe sets for each condition were analysed using ANOVA model implemented in the lima R package. Hierarchical cluster analysis and heatmaps of gene expression data were done using the coolmap function implemented in lima R package. Probe sets which were significantly changed (p < 0.05) in at least one condition were included in the clustering analysis. Gene Set Enrichment Analysis (GSEA) was performed using GAGE implemented in R and graphs of GAGE results were plotted using ggdotchart function implemented in ggpubr R package. List of the specific genes analysed related to cellular senescence, DNA repair, chronic inflammatory response, acute inflammatory response and inflammatory response were summarized in DataS1.
2.9 3D blood vessel pattern scanning and objective analysis
Three-dimensional blood vessel distributions were acquired using the Hadatomo™ Z Photoacoustic Microscope WEL5200 (ADVANTEST, Tokyo, Japan). Three probing positions with red signals were selected from the cheek of each subject based on a* gradient analysis of VISIA images, and a 6 mm × 6 mm area was scanned for each measurement. The scanned data were visualized using EUCLID R2.00 software (ADVANTEST, Tokyo, Japan) to perform image analysis and quantify blood vessel diameter and count on a top view image. Statistical analysis was conducted using the Student's t-test with JMP® Pro 17.1.0 (SAS Institute Inc., Cary, NC, USA).
2.10 Aging prediction modelling with 10-year interval data
To evaluate the relationships between the seven facial skin colour attributes (L* mean, L* SD, a* mean, a* SD, b* mean, b* SD and a* gradient) and future aging phenotypes over a 10-year period, we utilized two supervised machine-learning algorithms: logistic regression (LR) and Random Forest (RF) models. Validation testing was conducted with the 5-fold cross-validation for the LR model and RF model. Subjects were classified into two groups: ‘Less Aging Attributes’, indicating individuals with fewer aging phenotypes than the average for their age, and ‘More Aging Attributes’, indicating individuals with more aging phenotypes than the average for their age. This classification was based on the Wrinkle Area Fraction and Spots Area Fraction measurements in 2016. Two-class classification models were constructed using the seven colour attributes as explanatory variables and the labels as the response variable. To visually interpret the RF model, we employed Partial Dependence and Shapley Additive explanations (SHAP) analysis18, 19 using Python version 3.8.12 along with data science libraries including Scikit-learn version 1.0.2, Pandas version 1.3.5, NumPy version 1.22.1, SciPy version 1.7.1 and SHAP version 0.40.0. To mitigate the impact of existing aging phenotypes in 2006 on the modelling process, we selected data from 49 subjects aged 23 to 38 in 2006 from the database. This was done to understand which colour attribute contributes to the acceleration of ageing, as these ageing phenotypes significantly increase after the age of 40.
3 RESULTS
3.1 a* gradient correlates with acute and chronic inflammation
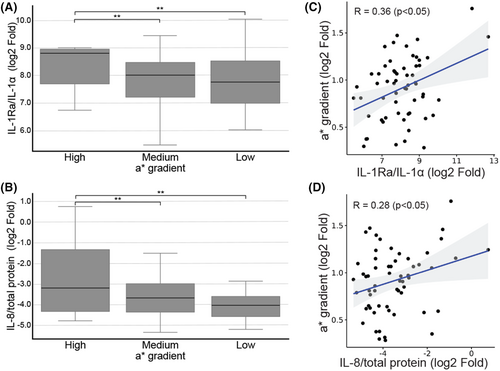
Protein analysis conducted on stripped stratum corneum samples revealed a significant upregulation of inflammatory markers, IL-1Ra/IL-1α and IL-8, in the high a* gradient group compared to both the medium a* gradient group (p < 0.05 for both markers) and low a* gradient group (p < 0.05 for both markers) (Figure 1A,B). Furthermore, a significant correlation was observed between a* gradient and amount of IL-1Ra/ IL-1α (R = 0.36, p < 0.05) and IL-8 (R = 0.28, p < 0.05) (Figure 1C,D).
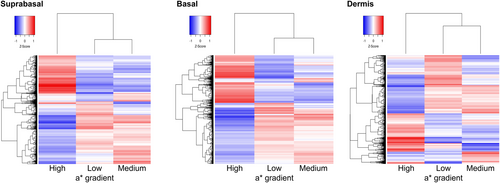
Consistent observations were made in genomics analysis conducted using skin biopsy samples. The heatmap of significantly altered genes (p < 0.05) demonstrated a marked difference in the high a* gradient group compared to the other two groups (Figure 2). Although the difference between middle and low a* gradient groups was relatively smaller, distinctions were still observed across all three skin layers.
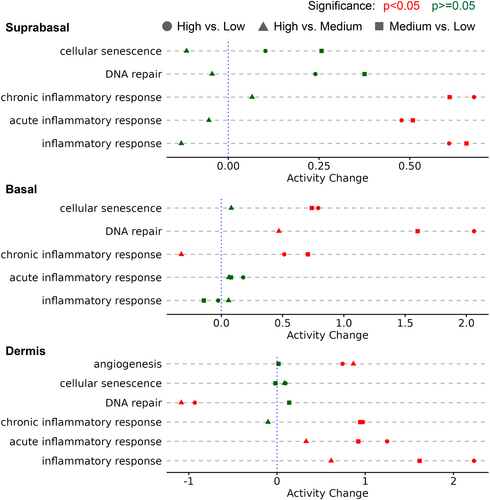
Further analysis focused on commonly regulated biological themes. Genes associated with both acute and chronic inflammation were significantly upregulated in the high a* gradient group compared to the low and medium a* gradient groups (Figure 3). Significant increases in cellular senescence were also observed in basal layer in medium and high a* gradient groups. The relationship between DNA repair and a* gradient was inconclusive, as DNA repair genes were found to be upregulated in the basal layer but downregulated in the dermis layer of the high a* gradient group. Additionally, the medium a* gradient group exhibited an induction of acute inflammatory response compared to the low a* gradient group in the dermal layer. Moreover, genes related to angiogenesis were significantly upregulated in both the high and medium a* gradient groups as compared to the low a* gradient group in dermis.
3.2 Medium a* gradient is induced by an increase in blood vessel diameter, while high a* gradient is induced by an increase in blood vessel diameter and density
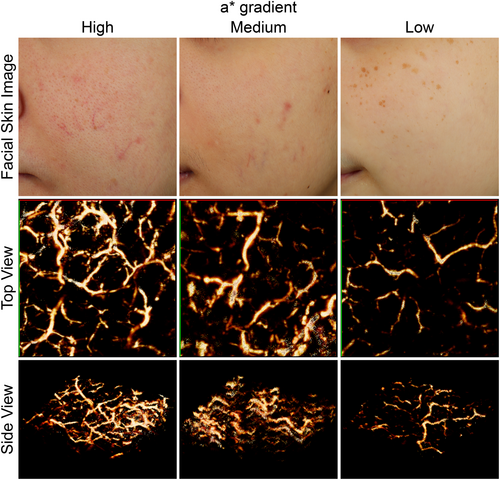
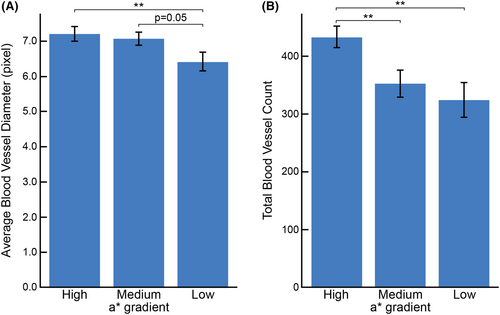
It is known that redness on skin surface is dominantly dependent on haemoglobin,20 therefore we employed a photoacoustic microscope to measure the 3D blood vessel pattern among the three groups. Interestingly, we found that the average diameter of the detected blood vessels, a measure of vascular extension, was significantly larger in both the high and medium a* gradient groups compared to the low a* gradient group. There was no significant difference in the average diameter between the high and medium a* gradient groups (Figure 4, Figure 5A). Additionally, a higher number of blood vessels, a measure of vascular development, were detected in the high a* gradient group compared to both the medium and low a* gradient groups (Figure 4, Figure 5B). These results suggest that the localization of redness in the medium a* gradient group is primarily induced through vascular extension. Conversely, in the high a* gradient group, both vascular development and vascular extension might contribute to the redness observed on the skin surface.
3.3 a* gradient correlates with future accelerated aging
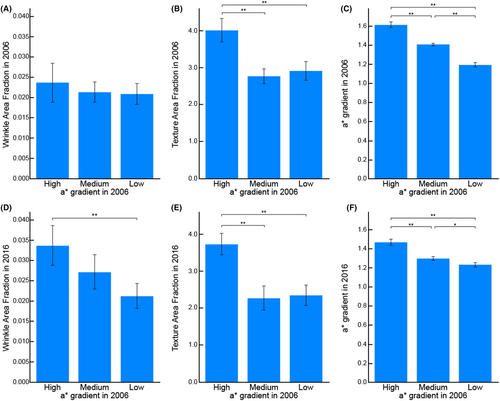
To examine the associations between the a* gradient and current and future skin attributes, skin measurements were conducted at two time points, with a 10-year interval, in 2006 and 2016. In 2006, no significant difference in wrinkle area fraction was observed among the three groups (Figure 6A). However, subjects categorized into the high a* gradient group based on their skin condition in 2006 exhibited a higher wrinkle area fraction in 2016 compared to those in the low a* gradient group based on their skin condition in 2006 (Figure 6D). Conversely, the high a* gradient group already displayed a higher texture area fraction compared to the other two groups in 2006 (Figure 6B). The relationship of a* gradient observed in 2006 remained in 2016 (Figure 6C,F).
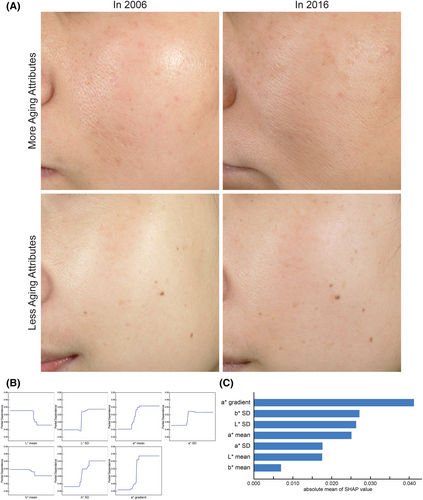
Furthermore, we evaluated seven skin colour attributes in 2006: L* mean, L* SD, a* mean, a* SD, b* mean, b* SD and a* gradient, to understand which attributes were associated with determining the presence of more or less ageing attributes in 2016 (Figure 7A). The random forest (RF) model exhibited a higher area under the curve (AUC) value (0.69 (SD = 0.19)) compared to the LR model (0.64 (SD = 0.24)) in the 5-fold cross-validation, thus the RF model was selected for further parameter evaluation. The partial dependence plot for each attribute showed reasonable behaviour (Figure 7B). The partial dependence increased as the values of L* SD, a* SD, b* SD, a* mean and a* gradient became larger. Conversely, the partial dependence value increased as the value of L* mean and b* mean became smaller. SHAP analysis revealed that the absolute mean of SHAP value of a* gradient was significantly higher than that of any other tested attribute (Figure 7C).
4 DISCUSSION
In our previous research, we introduced the use of a* gradient as an algorithm to assess the disordered shape and pattern of localized red signals on facial skin. Based on this algorithm, skin exhibiting less localized red signals is assigned a low a* gradient value, skin exhibiting localized red signals with a uniform colour and/or consistent circular shape is assigned a medium a* gradient value, while skin displaying localized red signals with an uneven colour and/or irregular shape is assigned a high a* gradient value. Empirical findings demonstrated that the spatial pattern of localized redness on facial skin influences human perception of inflamed, unhealthy and aged skin.13 In this article, we conducted four studies aiming to investigate the association between the pattern of skin redness and the underlying biological status of the skin with future skin aging.
The protein and genomics analyses conducted in this study revealed associations between a* gradient and various biological processes, including acute inflammation, chronic inflammation, cellular senescence and angiogenesis. Specifically, acute inflammation was induced in the medium a* gradient group, while chronic inflammation and cellular senescence were observed in the high a* gradient group. In the study with a photoacoustic microscope, vascular extension was observed in the medium a* gradient group, whereas both vascular extension and vascular development were observed in the high a* gradient group. These observations seem to align with the biomarker observations. Simultaneous regulation of inflammation and vascular permeability and angiogenesis through cytokines have been well studied.21, 22 Increased blood circulation, facilitated by vascular extension and angiogenesis, is a necessary process for supplying nutrients required for healing.23 On the other hand, it is also known that angiogenesis provides oxygen and nutrients for the metabolic needs of the cells present at inflammatory site, leading to mutual-activation between chronic inflammation and angiogenesis.21 Our results suggest that subjects with a medium a* gradient experience acute inflammation accompanied by temporal vascular extension. Conversely, those with a high a* gradient experience more severe or repetitive skin damages, potentially resulting in cellular senescence mediated by IL-8 9,12 and leading to chronic inflammation with angiogenesis. Mathematical models reported in the literature have explained different patterns of redness caused by vascular extension and angiogenesis.13, 24-26 Our findings demonstrate an association between skin redness patterns and inflammatory conditions, and show that the redness patterns, as reflective of vascular distribution patterns, can be an indicator of inflammatory status.
We also found associations between a* gradient and other skin attributes. Subjects in the high a* gradient group exhibited early signs of aging, characterized by smaller lines measured as texture area fraction. Although no significant difference was observed in the more visible morphological ageing signal, as measured by wrinkle area fraction, among the three groups initially, a significant increase in wrinkle area fraction was observed 10 years later in the high a* gradient group compared to the low a* gradient group. We also confirmed that subjects in the high a* gradient group, who had higher levels of IL-8 (Figure 1B), showed a significantly greater presence of wrinkles (data not shown). These results suggest that subjects experiencing chronic inflammation and/or cellular senescence tend to have more noticeable skin problems from their 20s, and these skin problems become increasingly visible after their 30s.
We acknowledge the limitations of our study methodology. One limitation is the relatively small number of subjects who participated in the studies, ranging from 34 to 452 in each study, due to the difficulties of recruitment of the participants. This limited sample size may affect the generalizability of our findings to a larger population. Furthermore, it is important to note that our research primarily focused on healthy East Asian females in the age range of 20s-40s. Therefore, the applicability of our model and findings to other skin types, different age groups and skin conditions such as skin cancer is not well understood. Further research with larger and more diverse populations will help to validate and extend our findings to these other demographics. We conducted experiments to predict the absolute values of ageing phenotypes, such as Wrinkle Area Fraction and Spots Area Fraction, using data collected from the 10-year interval study. However, we encountered challenges in developing a reliable model for these predictions. Therefore, we opted to use a classification model to predict groups labelled as ‘Less Aging Attributes’ and ‘More Ageing Attributes’. Factors other than the image data alone, such as life habit, might help improve prediction accuracy.
In conclusion, we demonstrated an association between the spatial pattern of localized redness on facial skin and both acute and chronic inflammation. This image analysis approach holds promise as a non-invasive method for predicting inflammatory conditions. By identifying and addressing these issues at an earlier stage, it may be possible to prevent their progression and improve facial ageing symptoms.
AUTHOR CONTRIBUTIONS
Study Conception and design: TO, WZ, MR, ME, DD, HL, TH; Acquisition of data: TO, MR, DD, HL, TH; Analysis and interpretation of data: TO, WZ, HL, TH; Drafting of manuscript: TO, WZ, ME, HL, TH; Critical revision: TO, WZ, MR, ME, DD, HL, TH.
ACKNOWLEDGEMENTS
This research was funded by the Procter & Gamble Company.
CONFLICT OF INTEREST STATEMENT
The authors have declared no conflicting interests.
Open Research
DATA AVAILABILITY STATEMENT
The data that support the findings of this study are available on request from the corresponding author. The data are not publicly available due to privacy or ethical restrictions.


