Frequent loss of metastatic ability in subclones of Apc, Kras, Tgfbr2, and Trp53 mutant intestinal tumor organoids
Abstract
Cancer evolution is explained by the accumulation of driver mutations and subsequent positive selection by acquired growth advantages, like Darwin's evolution theory. However, whether the negative selection of cells that have lost malignant properties contributes to cancer progression has not yet been fully investigated. Using intestinal metastatic tumor-derived organoids carrying Apc, Kras, Tgfbr2, and Trp53 quadruple mutations, we demonstrate here that approximately 30% of subclones of the organoids show loss of metastatic ability to the liver while keeping the driver mutations and oncogenic pathways. Notably, highly metastatic subclones also showed a gradual loss of metastatic ability during further passages. Such non-metastatic subclones revealed significantly decreased survival and proliferation ability in Matrigel and collagen gel culture conditions, which may cause elimination from the tumor tissues in vivo. RNA sequencing indicated that stemness-related genes, including Lgr5 and Myb, were significantly downregulated in non-metastatic subclones as well as subclones that lost metastatic ability during additional passages. Furthermore, a CGH analysis showed that non-metastatic subclones were derived from a minor population of parental organoid cells. These results indicate that metastatic ability is continuously lost with decreased stem cell property in certain subpopulations of malignant tumors, and such subpopulations are eliminated by negative selection. Therefore, it is possible that cancer evolution is regulated not only by positive selection but also by negative selection. The mechanism underlying the loss of metastatic ability will be important for the future development of therapeutic strategies against metastasis.
Abbreviations
-
- AKTP
-
- Quadruple mutations at Apc, Kras, Tgfbr2 and Trp53
-
- Apc Δ716
-
- Apc truncation mutation at codon 716
-
- CGH
-
- comparative genomic hybridization
-
- Chr
-
- chromosome
-
- COL1A1
-
- collagen type I alpha I chain
-
- CRC
-
- colorectal cancer
-
- GFP
-
- green fluorescent protein
-
- GFR
-
- growth factor reduced
-
- GO
-
- gene ontology
-
- Kras G12D
-
- Kras Gly to Asp missense mutation at codon 12
-
- PCA
-
- principal component analysis
-
- RFP
-
- red fluorescent protein
-
- RT-PCR
-
- reverse transcription polymerase chain reaction
-
- s.c.
-
- subcutaneous
-
- SC
-
- subclone
-
- Stat3
-
- signal transducer and activator of transcription 3
-
- TAGLN
-
- transgelin
-
- Trp53 R270H
-
- Trp53 Arg to His missense mutation at codon 270
1 INTRODUCTION
It has been established that the accumulation of driver gene mutations causes malignant transformation of colorectal cancer.1, 2 This concept is based on the positive selection by genetic mutation-associated growth advantages, which results in cancer evolution toward a malignant state. Consistently, organoid culture experiments confirmed the evolutional progression of TP53-deficient human gastric epithelial cells toward malignant programs with the accumulation of copy number alterations.3 Moreover, we previously examined the mechanism of multistep tumorigenesis of colon cancer by using mouse models with multiple driver mutations, which demonstrated the mutation combination-specific malignant progression.4-6 In particular, intestinal tumor-derived organoid cells carrying mutations in Apc, Kras, Tgfbr2, and Trp53 acquired metastatic ability by loss of wild-type Trp53 and achieved dominance in metastatic foci by positive selection.7, 8
Furthermore, a genome analysis at multiple points of colon cancer specimens indicated that trunk mutations accumulate in the early phase of tumorigenesis and that the intratumor heterogeneity of progressed cancer is caused by neutral evolution rather than positive selection.9, 10 Accordingly, the positive selection mechanism for malignant progression is possibly limited to the early phase of tumorigenesis. Thus, the present cancer evolution models are insufficient to fully explain the mechanism of malignant progression, particularly in the late stage.11
It has been reported that negative selection also contributes to cancer evolution. In comparing observed mutation rates to the expectation or the ratio of nonsynonymous mutations, significant negative selection in genes of essential functions or immune-exposed peptides has been noted.12, 13 Moreover, numerous genes in cancer cells showed signs of strong negative selection during tumor evolution, suggesting the functional importance of negative selection in cancer evolution.14 In contrast, it has been reported that cancers evolve predominantly by positive selection, and nearly all coding mutations are tolerated and escape negative selection.15 Such discrepancy is possibly caused by the limitation of the mathematical approach using the genome analysis data as a snapshot of human cancers. Therefore, it is important to examine the mechanism of negative selection using experimental model systems, which may cooperatively contribute to uncovering the mechanism of cancer evolution.
We examined the metastatic ability of subclones that were derived from metastatic intestinal tumor-derived organoids carrying ApcΔ716 KrasG12D Tgfbr2−/− Trp53R270H mutations. Although parental cells maintained high metastatic ability, approximately 30% of subclones showed a loss of metastatic ability with a decreased proliferation rate. Notably, the expression of stem cell-related genes was downregulated in non-metastatic subclones. These results suggest that a greater-than-expected number of cancer cells continuously lose their metastatic ability, even after the accumulation of driver mutations. Such regressed cells are possibly continuously eliminated by negative selection because of their decreased survival and proliferation rate. Thus, the present results will contribute to understanding the dynamic change of heterogeneity in cancer tissues through positive and negative selections.
2 MATERIALS AND METHODS
2.1 Organoid culture and subcloning experiments
Intestinal tumor-derived AKTP organoids were established from ApcΔ716 KrasG12D Tgfbr2−/− Trp53R270H mice,6 and the 1C9 cell line was established by subcloning AKTP organoids.7 The organoid cells were cultured on a cell-culture treated dish (Thermo Scientific) with Advanced DMEM/F-12 medium (Gibco) supplemented with 5 μM A83-01 (Sigma), 5 μM CHIR 99021 (Tocris Bioscience), and 10 μM Y27632 (Wako). For a cell proliferation assay, organoids were cultured in GFR-Matrigel (Corning) or Type I collagen gel (Nitta Gelatin) with Advanced DMEM/F-12 medium (Gibco) supplemented with 10 mM HEPES, 2 mM Glutamax, 1× B27, 1× N2 (Invitrogen), 100 ng/mL Noggin (Peprotech), and 1 μM N-acetylcysteine (Sigma).
To establish luciferase-expressing subclones, luciferase cDNA from pGL3-Promoter Vector (Promega) was subcloned to pPB-CAG-IB PiggyBac transposon expression vector (a kind gift from Dr Hitoshi Niwa) and co-transfected with transposase expression vector using Lipofectamine 3000 (Thermo Scientific). The luciferase activity of each subclone was measured by IVIS Lumina LT (Perkin Elmer) with the application of 150 μg/mL D-luciferin potassium salt solution (Wako) on 1 × 10³ cells.
Cell growth was examined by calculation of the luciferase activity relative to the initial luciferase activity of 2 × 10² cells (day 0 value). Luciferase activity was analyzed by IVIS Lumina LT and Living Image Software (Perkin Elmer). The size and number of organoids were measured on the photographs of five independent experiments.
The labeling of subcloned cells with Venus and tdTomato was described previously.8 For co-culture experiments, differentially labeled cells were mixed at 1:1 and co-cultured on a cell culture dish. On day 2 of co-culture, cells were passaged onto culture dishes or collagen gel. Cells were then passaged on days 5, 8, and 12, and the ratio of each cell line was examined.
2.2 Mouse experiments
Female C57BL/6 mice were purchased (Charles River). For the liver metastasis analysis, 3 × 10⁵ dissociated cells were transplanted into the mouse spleen (n = 2–3 for each subclone). At 1 and 2 weeks, mice were intraperitoneally injected with 150 mg/kg D-luciferin (Wako), and the bioluminescence of the liver was measured on the liver area by IVIS Lumina LT and Living Image Software (Perkin Elmer). For the subcutaneous (s.c.) tumor analysis, 1 × 10⁴ cells were transplanted subcutaneously, and luciferase activity was examined (n = 8 for each subclone). For the serial subcloning analysis, cells were continuously cultured on culture dishes until passage 30. At passage 0, 10, and 30, cells were subcloned (10 subclones for each line) and transplanted into the spleen (n = 3 for each subclone). Luciferase activity was examined on day 0 and at 2 weeks after transplantation.
The multiplicity of liver metastasis was analyzed by marking metastatic tumors with yellow on digital images of H&E sections using an All-in-One microscope and BZ-II Analyzer (Keyence). All animal experiments were carried out according to the protocol approved by the Committee on Animal Experimentation of Kanazawa University.
2.3 Histology and immunohistochemistry
Liver tissue specimens were embedded in paraffin, and 4-μm-thick sections were prepared and stained with H&E. To detect collagen fibers, sections were stained with Sirius red using a Picrosirius Red Stain Kit (Polysciences). For immunohistochemistry, antibodies against Luciferase (Novus Biologicals, NB100-1677), Ki67 (SP6; Abcam, ab16667), COL1A1 (E8F4L; Cell Signaling, #72026), TAGLN (Abcam, ab14106), F4/80 (Cl:A3-1; Serotec, MCA497), and phosphorylated Stat3 (Tyr705; D3A7; Cell Signaling, #9145), were used as the primary antibodies. Staining signals were visualized using a Vectastain Elite Kit (Vector Laboratories). For fluorescent immunohistochemistry, antibodies against GFP (1E4; MBL, M048-3) and RFP (Rockland Immunochemicals, 600-401-379) were used to detect Venus-labeled and tdTomato-labeled organoid cells, respectively. Alexa Fluor 594- or Alexa Fluor 488-conjugated antibodies (Thermo Scientific, A21202 or A21207) were used as the secondary antibodies.
The mean Ki67-labeling indices were calculated by counting the positive cells in 15–20 independent lesions (n = 3 mice for each genotype).
2.4 Genotype analysis by genomic PCR
Genomic DNA was prepared from the respective organoid cells as well as 1C9 cells and C57BL/6 mouse liver. Primer sequences for genomic PCR to detect ApcΔ716, KrasG12D, Tgfbr2−/−, and Trp53R270H alleles were previously reported.6, 7, 16-19
2.5 Western blotting
Subcloned cells were lysed in TNE buffer with cOmplete Mini Protease Inhibitor Cocktail (Roche), and 10 μg of the protein sample was separated using 10% SDS-polyacrylamide gel. Antibodies against active (dephosphorylated) β-catenin (8E7; Millipore, 05–665), total β-catenin (#9562), phospho-p44/42 Erk1/2 (#9101), ERK (#9102), and p53 (1C12; Cell Signaling, #2524) were used as primary antibodies. Anti-GAPDH antibody (Wako, 016-25523) was used as a control. The ECL detection system (GE Healthcare) was used to detect the signals.
2.6 Real-time RT-PCR
Total RNA was extracted from organoids using ISOGEN (Nippon Gene), reverse-transcribed using a Prime Script RT reagent Kit (Takara Bio), and amplified using ExTaqII SYBR Premix (Takara) on a Mx3000P real-time thermocycler (Agilent Technologies). The relative mRNA levels of Lgr5, Reg3g, and Myb to the β-actin (Actb) were calculated. The following primer sequences were used. Lgr5-F: TCAAACGCAGGGCGTTAAGTC, Lgr5-R: CCAGTTTCTGTTGAGTCCGAAGTG; Reg3g-F: TGTATGGATTGGGCTCCATGAC, Reg3g-R: CATCACATCAGCATTGCTCCAC; Myb-F: AGGCGTCTCCTGTGGCAGAT, Myb-R: CCGTCATCTGGTCCTCTGTCTT; Actb-F: CATCCGTAAAGACCTCTATGCCAAC, Actb-R: ATGGAGCCACCGATCCACA.
2.7 Comparative genomic hybridization analysis
Genomic DNA was extracted and purified from organoid cells, and the whole genome comparative genomic hybridization (CGH) array was performed using the SurePrint G3 Mouse Genome CGH microarray 1 × 1 M (Agilent, DNA CHIP Research).
2.8 RNA sequencing and analyses
Total RNA was extracted, and RNA-Seq Libraries were prepared using a Nextera XT DNA library Prep Kit (Illumina). Paired-end sequencing (150 bp) was performed using an Illumina NovaSeq6000 (Takara Bio). The sequencing data were deposited in the DNA Data Bank of Japan (DDBJ, accession #DRA014612).
A differential expression analysis was performed using edgeR,20 with the cut-off set at p < 0.01 and >2-fold change. A principal component analysis (PCA) and clustering analysis were performed with iDEP v0.96 (http://bioinformatics.sdstate.edu/idep/) with z-scores of >2 and p-values of <0.05. The relevant gene ontology (GO) terms were applied using DAVID bioinformatics resources (http://david.ncifcrf.gov/).21
2.9 Statistical analyses
The data are presented as the mean ± SD. The statistical analysis was performed using two-sided unpaired t-tests or a one-way ANOVA, followed by Tukey's post-hoc test. p-values of <0.05 were considered statistically significant.
3 RESULTS
3.1 Loss of metastatic ability in tumor organoid subclones
AKTP organoid established from mouse intestinal tumors was subjected to subcloning to establish metastatic 1C9 cells (Figure 1A).6, 7 We confirmed a high incidence of liver metastasis of 1C9 cells after long passages (approximately 50 times) by transplantation to the spleen (Figure S1A). We then performed a second round of subcloning of 1C9 cells with transfection of the luciferase expression vector (Figure 1B). There is heterogeneity in the basal luciferase activity of the 24 subclones (Figure 1C).
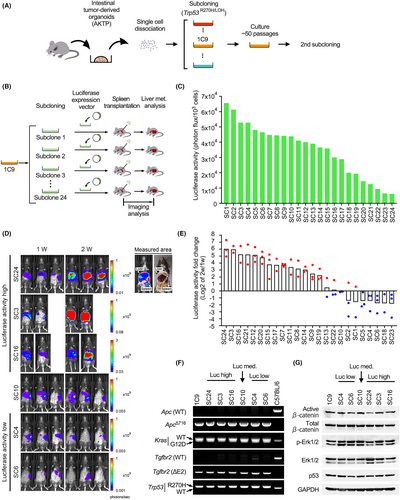
We transplanted each subcloned cell line into the mouse spleen to examine liver metastasis by measurement of luciferase activity (Figure 1D). To discriminate the bioluminescence of the liver from that of the spleen, we determined an area to measure based on the anatomical localization (Figure 1D top right). Two weeks after transplantation, the mean luciferase activity was increased >4-fold in 14 clones (58%) compared to that at 1 week (Figure 1E, red dots), while the luciferase activity at 2 weeks was decreased to <0.5 in 7 subclones (29%; Figure 1E, blue dots). A histological analysis showed the development of multiple liver metastatic foci in the high luciferase activity group, like in the parental 1C9 cell-transplanted mice (Figure S1A,B). In contrast, metastatic lesions were not detected in the low luciferase activity group, indicating a loss of metastatic ability.
We confirmed by genomic PCR that all subclones, including non-metastatic ones, carried the same ApcΔ716, KrasG12D, Tgfbr2−/−, and Trp53R270H/LOH mutations as parental 1C9 cells (Figure 1F). Moreover, activation of Wnt signaling and the Kras/Erk pathway and stabilization of mutant p53 were confirmed by the detection of dephosphorylated β-catenin, phosphorylated Erk, and p53 by western blotting (Figure 1G). Accordingly, the loss of metastatic ability in low luciferase activity subclones was not caused by impaired driver mutation pathways.
3.2 Decreased proliferation of non-metastatic subclones
For further analyses, we used SC3, SC16, and SC24 as highly metastatic subclones, SC4 and SC6 as non-metastatic subclones, and SC10 as intermediate. All subclones showed a similar cell proliferation rate when cultured on cell culture dishes (Figure 2A). However, non-metastatic subclones showed significantly decreased proliferation when cultured in Matrigel. The decreased proliferation was more obvious when cells were 3D cultured in collagen gel. Consistently, developed organoid size in collagen gel was significantly smaller in SC6 cells (Figure 2B,C), and the numbers of organoids were significantly low in the non-metastatic SC4 and SC6 cells (Figure 2B,D). These results indicate that the survival and proliferation of non-metastatic subclones were significantly decreased when cultured in collagen gel.
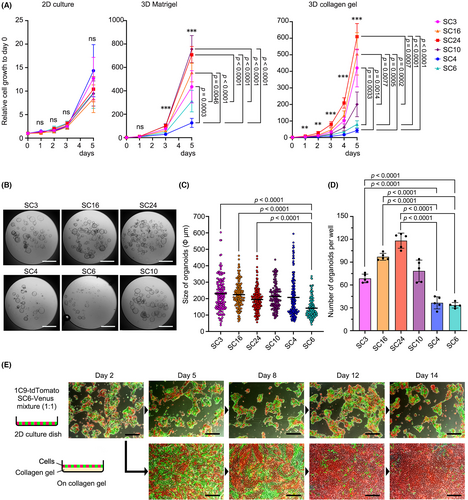
To confirm the decreased proliferation of non-metastatic subclones, Venus-labeled SC6 cells were co-cultured with tdTomato-labeled parental 1C9 cells on a cell culture dish or collagen gel (Figure 2E). Although both cell lines proliferated to almost equal extent on the culture dishes, the ratio of non-metastatic SC6 cells gradually decreased when cultured on collagen gel, and it became a minor population on day 14. Similar results were obtained when Venus-labeled non-metastatic SC4 cells were co-cultured with 1C9 cells (Figure S2). Accordingly, non-metastatic subclones are possibly eliminated from the population by negative selection if cells were maintained in the extracellular matrix environment like collagen fibers.
3.3 Loss of in vivo tumorigenicity of non-metastatic subclones
To further examine the tumorigenicity, subcloned cells were subcutaneously transplanted into C57BL/6 mice. Highly metastatic subclones SC3 and SC24 formed large s.c. tumors with increased luciferase activity (Figure S3A–C). However, non-metastatic subclones SC4 and SC6 did not form palpable tumors, and the luciferase activity was significantly decreased after transplantation. A histological analysis confirmed the s.c. tumors of highly metastatic subclones with the generation of a fibrotic microenvironment (Figure S3D). In contrast, only limited numbers of non-metastatic subcloned cells remained at the transplanted sites. These data, taken together, indicate the decreased in vivo tumorigenicity of non-metastatic subcloned cells. Consistent with these results, we confirmed that tumor development in the spleen at 2 weeks after transplantation was significantly suppressed in non-metastatic subclones (Figure S3E).
3.4 Impaired micrometastasis development of non-metastatic subclones
We next examined the liver tissue in the early stage after spleen transplantation. The luciferase activity of highly metastatic SC3 and SC24 cells was significantly increased on day 5 compared to that on day 1 after transplantation (Figure 3A,B). In contrast, the luciferase activity of non-metastatic SC4 and SC6 cells significantly decreased. Consistently, multiple micrometastasis foci of SC3 and SC24 cells were found in the liver on histology sections on day 5, while those of SC4 and SC6 cells were rarely detected (Figure 3C,D). Moreover, most tumor foci of SC4 and SC6 cells consisted of <20 cells, which were significantly smaller than those of SC3 and SC24 cells (Figure 3E).
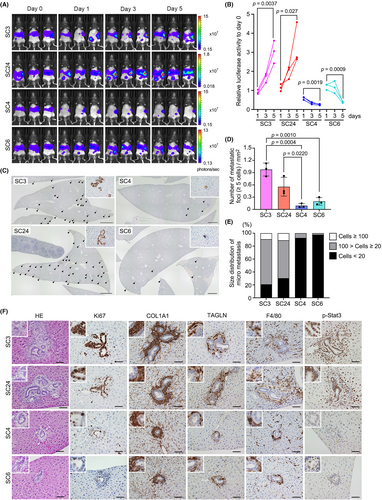
The histological analysis on day 5 showed that tumor lesions of SC3 and SC24 cells were associated with fibrotic microenvironment with COL1A1 and transgelin (TAGLN) expression and macrophage infiltration (Figure 3F). In contrast, small SC4 and SC6 tumors were found in the liver without such a microenvironment. TAGLN has been identified as a fibroblast-specific biomarker of malignant CRC stroma.22 Thus, the results suggest that highly metastatic subcloned cells form micrometastasis associated with activated fibroblasts in the liver. Moreover, the mean Ki67 labeling index was significantly decreased in SC4 and SC6 tumors (Figure S4).
Interestingly, in SC3 and SC24 cell liver tumors, phosphorylated Stat3 was detected in the hepatocytes surrounding tumors (Figure 3F). It has been shown that Stat3 plays a key role in liver regeneration.23 Accordingly, it is possible that colonization of highly metastatic subclones activated regeneration responses, and thus Stat3 was activated in hepatocytes surrounding tumors. Such Stat3 activation in hepatocytes was not detected in tumor lesions of SC4 and SC6 cells. These results indicate that non-metastatic subclones cannot form metastatic lesions from the early stage after dissemination.
3.5 Highly metastatic cells partially rescue metastasis of non-metastatic subclones
We previously showed that non-metastatic tumor cells can metastasize with highly metastatic cells by polyclonal mechanism.8 Therefore, we performed co-transplantation experiments to see whether non-metastatic subcloned cells can metastasize with highly metastatic cells (Figure 4A). For this experiment, tdTomato-labeled highly metastatic SC3 cells and Venus-labeled non-metastatic SC4 cells were co-cultured, and cell clusters for transplantation were prepared by gentle trypsinization and pipetting (Figure 4B). We confirmed that approximately 33% of cell clusters were a mixture of SC3 and SC4 cells.
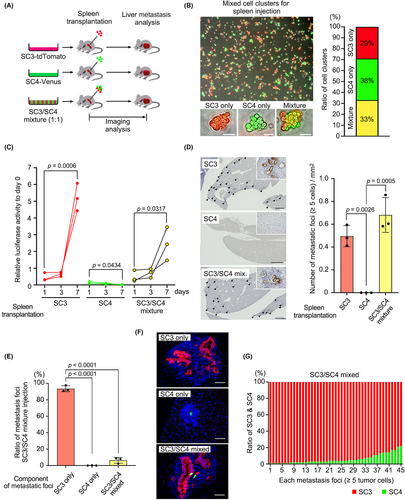
As a control experiment, the luciferase activity in only SC3 cell-transplanted mice increased significantly by day 7, while that in only SC4 cell-transplanted mice did not (Figure 4C). Consistently, multiple micrometastases were found in SC3- but not in SC4-transplanted mouse livers (Figure 4D). When SC3/SC4 mixed cell clusters were transplanted, the luciferase activity increased by day 7, and the number of metastatic foci was similar to the highly metastatic SC3-transplanted mice (Figure 4C,D). However, fluorescent immunohistochemistry revealed that chimeric tumor lesions of SC3 and SC4 cells were found in only approximately 7% in the SC3/SC4 mixture-transplanted mice (Figure 4E), and the ratio of SC4 cells in the chimeric foci was significantly low (Figure 4F,G). Similar results were obtained by co-transplantation of highly metastatic SC3 and non-metastatic SC6 subclones (Figure S5). These results indicate that liver metastasis of non-metastatic cells was only slightly rescued by a polyclonal mechanism. Thus, it is possible that non-metastatic subclones cannot survive in the heterogenous population and are eliminated during the metastasis process.
3.6 Downregulation of stem cell signatures in non-metastatic subclones
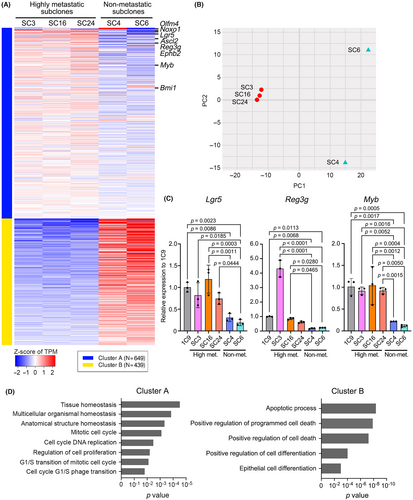
To examine the possible mechanism for the loss of metastatic ability in non-metastatic subclones, we performed RNA sequencing of highly metastatic SC3, SC16, and SC24 cells and non-metastatic SC4 and SC6 cells and extracted the differentially expressed genes between two groups (Figure 5A). A principal component analysis indicated that the expression profiles of non-metastatic cells were significantly changed from highly metastatic subclones (Figure 5B). Notably, in the downregulated gene set in non-metastatic cells, stem cell-related factors in the gastrointestinal tract (e.g., Olfm4, Noxo1, Lgr5, Ascl2, Reg3g, Ephb2, Myb, and Bmi1) were included (Figure 5A, cluster A, Table S1).24-28 Among them, Lgr5 is a well-characterized intestinal stem cell-related gene,29 and Reg3g plays a role in the maintenance of gastric epithelial stem cells.30 Moreover, Myb has been shown to expand the intestinal stem cell pool, resulting in intestinal tumorigenesis.31 Notably, the significant downregulation of stem cell-related genes was confirmed in non-metastatic subcloned cells by RT-PCR (Figure 5C). A GO term analysis suggested the dysregulation of tissue homeostasis, mitotic cell cycling, and cell death and differentiation in non-metastatic cells (Figure 5C). Accordingly, the results suggest that stem cell properties are impaired in non-metastatic subclones, which may cause reduced proliferative and metastatic ability through the alteration of these biological processes.
3.7 Loss of metastatic ability of metastatic subclones during passaging
To examine whether metastatic ability is fluctuating or not, we continued cultures of highly metastatic subclone SC3 and non-metastatic subclone SC4 by passaging on culture dishes and performed serial subcloning (Figure 6A). Transplantation of non-metastatic SC4-derived subclones at passages 0, 10, and 30 did not cause liver metastasis, indicating that the metastatic phenotype was not recovered in offspring of non-metastatic cells (Figure 6B, Figure S6A). Importantly, the metastatic ability of SC3 cells was dramatically decreased at passage 10, and all SC3-derived subclones at passage 30 showed a complete loss of metastatic ability (Figure 6B, Figure S6A). We also found that SC3 cells after 30 passages were gradually eliminated when co-cultured with parental 1C9 cells on the collagen gel (Figure S7).
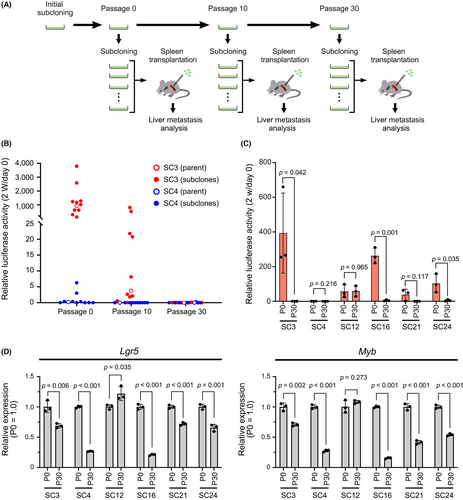
Notably, other highly metastatic subclones, SC16, SC21, and SC24 cells, also showed a loss of metastatic ability at passage 30 after subcloning (Figure 6C, S6B). However, in one of the highly metastatic subclones, SC12, the metastatic ability was maintained at passage 30 at the same level as passage 0. Moreover, expression of Lgr5 and Myb in highly metastatic subclones at passage 30, except SC12 cells, was significantly downregulated compared with that at passage 0 (Figure 6D). These results suggest that metastatic ability is frequently lost in subclones of malignant cancer populations with decreased stem cell properties, while other subclones like SC12 cells maintain it.
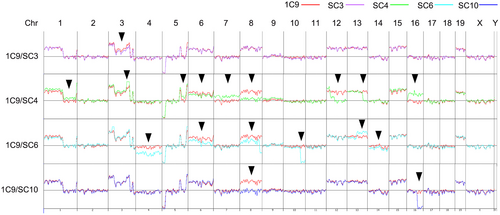
We finally examined the evolutional state of highly metastatic and non-metastatic subclones in 1C9 cells using a CGH analysis (Figure 7). Notably, the CGH pattern of highly metastatic SC3 cells was almost the same as that of parental 1C9 cells, with the exception of partial loss of Chr 3, suggesting that SC3 was derived from a major population of 1C9 cells. In contrast, multiple chromosomal losses and gains were found in SC4 and SC6 cells in comparison to 1C9 cells. SC10 cells also showed losses at Chr 8 and 16. Accordingly, it is possible that non-metastatic subclones were derived from a minor population of 1C9 cells. These results suggest that non-metastatic subclones frequently rise and fall without achieving dominance.
4 DISCUSSION
The malignant progression of colon cancer has been explained by multiple processes of driver mutations and positive selection. Mouse model studies showed that simultaneous mutations in major driver genes cause the development of metastatic intestinal tumors.6, 32-34 Moreover, multistep tumorigenesis has been demonstrated by genetic engineering of human colon epithelia-derived organoids.35 Based on these studies, cancer evolution has been thought to be promoted toward malignant progression. However, in the present study, we demonstrated that certain populations of metastatic tumor cells lose their metastatic ability after the acquisition of malignant characteristics by driver mutations. These results indicate that the accumulation of driver mutations is not sufficient for the maintenance of malignant phenotypes. Although we have not identified the mechanism underlying the loss of metastatic ability in this study, induction of such a mechanism in the malignant cells by drug treatment could be a possible therapeutic strategy against CRC metastasis.
It is noteworthy that the metastatic ability was maintained in the parental 1C9 cells following 50 passages, although subpopulations may have continuously lost their metastatic ability. The role of negative selection in cancer evolution is controversial.12-15 However, the present results suggest that non-metastatic subclones are continuously eliminated through negative selection caused by decreased stemness, survival, and proliferation efficiencies. Otherwise, the metastatic ability of parental 1C9 cells would have been diminished with an increased number of non-metastatic cells. The CGH analysis indicated that non-metastatic subclones were derived from a minor population of 1C9 cells, suggesting that non-metastatic subclones do not become the majority of the population. Therefore, cancer cells that lose malignant phenotype are possibly eliminated by negative selection, which results in the dominance of the remaining malignant cells and maintenance of the metastatic ability of tumors.
It has been shown that cancer cells carrying mutations in essential cell function genes are eliminated by negative selection.12, 13 However, in the present study, non-metastatic subcloned cells proliferated on the cell culture dishes, suggesting that essential cell functions were not impaired. RNA sequencing analysis showed that the expression of stem cell-related genes decreased significantly in non-metastatic subclones. Cancer cell stemness is regulated by various mechanisms. For example, mutant KRAS promotes glutaminolysis-associated epigenetic regulation, leading to Wnt signaling activation and the expression of Lgr5.36 Moreover, the expression of cholesterol biosynthetic genes is increased in colon cancer, which promotes stemness and tumorigenicity.37 Therefore, it is possible that suppression of such metabolic regulation-related gene expression impairs stemness and metastatic ability. Notably, it has been reported that MLL1 sustains the expression of stem cell-related genes, including Lgr5, through epigenetic regulation in the intestinal tumor cells.38 Thus, such epigenetic alteration may also be involved in the downregulation of stem cell-related genes in non-metastatic subclones.
Interestingly, non-metastatic subclones did not show delayed proliferation when cultured on culture dishes. In organoid cultures in Matrigel, the stem cell population is enriched; thus, it is possible that non-metastatic subclones with decreased stemness showed decreased proliferation in 3D culture in Matrigel or collagen gel. It is also possible that disseminated non-metastatic cells failed to develop micrometastasis in the liver because of decreased stemness, which is required for survival in the insufficient extracellular matrix environment.
In conclusion, a certain population of metastatic cells show loss of metastatic ability with the downregulation of stem cell-related genes through decreased survival and proliferation ability. Such non-metastatic subpopulations may continuously arise but are eliminated by negative selection. Therefore, heterogeneity in cancer tissues is regulated not only by positive selection but also by negative selection. Understanding the mechanism of loss of metastatic ability in cancer cells will be important for a novel therapeutic strategy against colon cancer metastasis.
AUTHOR CONTRIBUTIONS
Investigation: A. M., M. N., and D. W.; methodology: K. M.; writing, review and editing, M. O.; funding acquisition: M. N., and M. O.
ACKNOWLEDGEMENTS
We thank Yoshie Jomen, Manami Watanabe, and Ayako Tsuda for their technical assistance.
FUNDING INFORMATION
This work was supported by AMED (22ck0106541h0003; 22gm4010012h0002) from the Japan Agency for Medical Research and Development, Japan and Grants-in-Aid for Scientific Research (A) (22H00454) and (C) (20K07585) from the Ministry of Education, Culture, Sports, Science and Technology of Japan.
CONFLICT OF INTEREST
The corresponding author, Masanobu Oshima, is an Editorial Board Member of Cancer Science. All the other authors have no conflict of interest.
ETHICS STATEMENT
Approval of the research protocol by an Institutional Reviewer Board: N/A.
Informed Consent: N/A.
Registry and the Registration No. of the study/trial: N/A.
Animal Studies: All animal experiments were carried out according to the protocol approved by the Committee on Animal Experimentation of Kanazawa University, Japan.


