Roles of the hexosamine biosynthetic pathway and pentose phosphate pathway in bile acid-induced cancer development
Abstract
Esophageal squamous cell carcinomas (ESCCs) as well as adenocarcinomas (EACs) were developed in rat duodenal contents reflux models (reflux model). The present study aimed to shed light on the mechanism by which bile acid stimulation causes cancer onset and progression. Metabolomics analyses were performed on samples of neoplastic and nonneoplastic tissues from reflux models, and K14D, cultivated from a nonmetastatic, primary ESCC, and ESCC-DR, established from a metastatic thoracic lesion. ESCC-DRtca2M was prepared by treating ESCC-DR cells with taurocholic acid (TCA) to accelerate cancer progression. The lines were subjected to comprehensive genomic analyses. In addition, protein expression levels of glucose-6-phosphate dehydrogenase (G6PD), nuclear factor kappa B (NF-κB) (p65) and O-linked N-Acetylglucosamine (O-GlcNAc) were compared among lines. Cancers developed in the reflux models exhibited greater hexosamine biosynthesis pathway (HBP) activation compared with the nonneoplastic tissues. Expression of O-GlcNAc transferase (OGT) increased considerably in both ESCC and EAC compared with nonneoplastic squamous epithelium. Conversely, cell line-based experiments revealed the greater activation of the pentose phosphate pathway (PPP) at higher degrees of malignancy. G6PD overexpression in response to TCA exposure was observed. Both NF-κB (p65) and O-GlcNAc were expressed more highly in ESCC-DRtca2M than in the other cell lines. Moreover, ESCC-DRtca2M cells had additional chromosomal abnormalities in excess of ESCC-DR cells. Overall, glucose metabolism was upregulated in both esophageal cancer tissue and cell lines. While bile acids are not mutagenic, chronic exposure seems to trigger NF-κB(p65) activation, potentially inducing genetic mutations as well as facilitating carcinogenesis and cancer progression. Glucose metabolism was upregulated in both esophageal cancer tissue and cell lines, and the HBP was activated in the former. The cell line-based experiments demonstrated upregulation of the pentose phosphate pathway (PPP) at higher degrees of malignancy. While bile acids are not mutagenic, chronic exposure seems to trigger G6PD overexpression and NF-κB (p65) activation, potentially inducing genetic mutations as well as facilitating carcinogenesis and cancer progression.
1 INTRODUCTION
Exposure to bile acids is widely recognized to be involved in the onset and progression of esophageal adenocarcinoma (EAC),1-3 gastric stump cancer,4, 5 and colon cancer.6, 7 However, there remains much uncertainty regarding how bile acids influence the pathology of gastrointestinal cancers as bile acids are not mutagenic. Persistent esophageal inflammation due to reverse flow of bile acid-containing gastric fluids is a major risk factor for EAC. The condition often precedes Barrett's esophagus, in which the stratified squamous epithelia transform into columnar epithelia. Previously, our research group has developed several models of esophageal reflux that are surgically induced by re-routing bile acid-containing duodenal contents back into the esophagus.8-11 We developed not only EACs but also esophageal squamous cell carcinomas (ESCCs) in the rat reflux models (reflux model).8, 9, 12, 13 Our previous study also revealed that N-nitroso bile acid-mutagenic derivatives of bile acids produced in vivo under highly acidic conditions could stimulate EAC.14, 15 However, we also observed EACs in modified Levrat models with total gastrectomy suggesting that the tumors could be induced by exposure to unmodified nonmutagenic bile acids in the absence of gastric acid.8, 9
We selected taurocholic acid (TCA) among various bile acids to stimulate ESCC cells because of the following 5 reasons: (i) in cases with Barrett's esophagus/stricture, taurine conjugates are predominant in the esophagus;16 (ii) increased proportions of taurine conjugates due to a high-fat diet influence Barrett's carcinogenesis in reflux models;17 (iii) exposure to TCA promotes cell proliferation in a dose-dependent manner in an experiment using E-G junction cancer cells (OE-19);18 (iv) chronic exposure to TCA causes tumor progression in ESCC cells;19 and (v) acid and bile acids induce NF-κB pathway signaling in esophageal squamous cells in gastroesophageal reflux disease.20-22 In addition, TCA significantly increased protein levels of p-NF-κB (p65) in both a time-dependent and dose-dependent manner, and TCA significantly increased nuclear translocation of NF-κB (p65) in a human cholangiocarcinoma cell line.23
Under aerobic conditions, mammalian cells produce the energy-carrying molecule, adenosine triphosphate (ATP), via the oxidative phosphorylation pathway. In 1924, however, Otto Warburg and coworkers claimed that even in the presence of adequate oxygen, cancer tissues synthesize ATP via glycolysis.24 This phenomenon is known as the Warburg effect.25 Other researchers have reported that cancer cells use glycolysis to synthesize a variety of critical precursor molecules, including nucleic acids, proteins, and lipids.26 Glycolysis is an extremely inefficient system with regard to energy production, but is a boon for cancer cells in one key respect: as the pathway consumes low levels of oxygen, neoplasms can form and proliferate, even in tissues with minimal vasculature.27 Increased activity in the major carbohydrate pathways, such as glycolysis, the pentose phosphate (PPP), and the hexosamine biosynthetic pathways (HBP), is one of the hallmarks of metabolic diseases such as cancer.28 HBP is a sugar metabolism pathway that incorporates metabolites from major metabolic processes in the cell, such as glutamine, Acetyl-coenzyme A, glucose, and uridine, to form an amino-sugar molecule end-product (uridine diphosphate N-Acetylglucosamine, UDP-GlcNAc).29 UDP-GlcNAc can be conjugated into target proteins in several ways yielding N-linked and O-linked glycosylated products.30-33 The PPP is critical for the maintenance of carbon homeostasis, the provision of precursors of nucleotide and amino acid biosynthesis, the provision of reducing molecules for anabolism, and the overcoming of oxidative stress.34 The PPP also facilitates the regeneration of the reducing agent nicotinamide adenine dinucleotide phosphate (NADPH), which, in turn, facilitates reactive oxygen species scavenging.35 By producing the 2 key intermediates (ribose and NADPH), the PPP pathway plays a pivotal role in meeting the anabolic demands of cancer cells.
The present study investigates the biochemical pathways implicated in bile acid-induced cancer onset and progression, using metabolomics and comprehensive genetic analyses of esophageal tissues and cell lines, including EAC and ESCC tissues sampled from reflux models, 2 ESCC lines (K14D and ESCC-DR) established from primary and metastatic tumors developed in reflux models, and ESCC-DRtca stimulated with TCA to enhance malignancy.
2 MATERIALS AND METHODS
2.1 Animal model
All procedures complied with the ethical guidelines for animal experimentation regarding the care and use of laboratory animals at Kanazawa University of Medical Science (AP-111868), Japan.
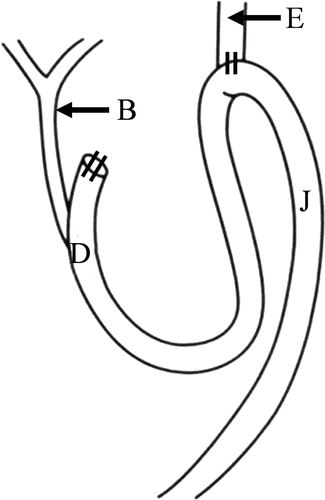
Male Wistar rats weighing approximately 250 g were used in the present study. After fasting for 24 h, a midline laparotomy incision was made under inhalation anesthesia. Reflux of duodenal contents was induced according to previously reported procedures8, 9 (Figure 1).
2.2 Histological findings in animal models
At postoperative wk 60, 17 reflux models were sacrificed under inhalation anesthesia. The entire length of the esophagus including the anastomosis site was excised. A specimen of the gross tumor was prepared by preserving a section of the tumor tissue at −80°C and, with it, a nonneoplastic esophageal tissue of the same specimen most proximal to the mouth as a control in the same manner. Tissues other than the cryopreserved tumor and the nonneoplastic tissues were fixed using 10% buffered formalin for use in preparing paraffin block specimens. A 2-μm specimen was prepared and histologically examined by hematoxylin and eosin (HE) staining.
2.3 Cell lines
We were unable to examine metastatic nodules developed in these animals in the present study. Therefore, we ran similar experiments on 2 existing cell lines: K14D, which has low malignant potential (cultivated from a nonmetastatic primary ESCC, non-transplantable in nude mice), and ESCC-DR, which is high grade (established from a metastatic thoracic lesion of ESCC, transplantable in nude mice).12 The cells were cultured and maintained in Dulbecco's modified Eagle's medium (DMEM; Nacalai Tesque) supplemented with 1% antibiotic-antimycotic solution (Gibco; Thermo Fisher Scientific K.K.) and 10% fetal bovine serum (FBS; PAA Laboratories) in a humidified incubator containing 5% CO2 at 37°C. The ESCC-DRtca2M cells, which we reported to be high malignancy potential cell lines induced by continuous TCA stimulation,19 were incubated in the growth medium containing 2 mmol/L TCA sodium salt hydrate (TCA, SIGMA) for ≥2 mo before analysis. ESCC-DR cells were also incubated in the growth medium containing 2 mmol/L TCA for only 24 h before analysis (ESCC-DRtca24h) to analyze the effect of short-term exposure to TCA.
2.4 Capillary electrophoresis time-of-flight mass spectrometry analysis for rat esophageal tissues and cell lines
2.4.1 Preparation for metabolome measurements of rat esophageal tissue
Approximately 50 mg of frozen tissue was plunged into 1500 μL of 50% acetonitrile/Milli-Q water containing internal standards (Solution ID: 304-1002, Human Metabolome Technologies (HMT), Inc.) at 0°C to inactivate enzymes. The tissue was homogenized 3 times at 400 g for 120 s using a tissue homogenizer (Micro Smash MS100R, Tomy Digital Biology Co., Ltd.).
2.4.2 Preparation for metabolome measurements of cell lines
We attempted to determine the volumes of metabolites in the 4 groups of ESCC cells: K14D (low-grade), ESCC-DR (high-grade), ESCC-DRtca2M (aggressive high-grade), ESCC-DRtca24h. The number of each group was 3. A dish of culture cells (106 cells/sample) was used. The culture medium was aspirated from the dish and cells washed twice with 5% mannitol solution. The cells were then treated with 800 μL methanol and left to rest for 30 s to inactivate the enzymes. Subsequently, the cell extract was treated with 550 μL of Milli-Q water containing internal standards (H3304-1002, HMT, Inc.) and left to rest for another 30 s.
2.4.3 Metabolome measurements
The homogenate of esophageal tissues and the extract of cancer cells were centrifuged at 2300 g and 4°C for 5 min. Subsequently, 800 μL of the upper aqueous layer was centrifugally filtered through a Millipore 5-kDa cutoff filter at 9100 g and 4°C for 120 min to remove proteins. The filtrate was centrifugally concentrated and re-suspended in 50 μL of Milli-Q water for capillary electrophoresis-mass spectrometry (CE-MS) analysis. Metabolome measurements were carried out through a facility service at HMT Inc.
Capillary electrophoresis time-of-flight mass spectrometry (CE-TOFMS) was carried out in an Agilent CE capillary electrophoresis system equipped with an Agilent 6210 time-of-flight mass spectrometer, an Agilent 1100 isocratic HPLC pump, an Agilent G1603A CE-MS adapter kit, and an Agilent G1607A CE-ESI-MS sprayer kit (Agilent Technologies). The systems were controlled using the Agilent G2201AA ChemStation version B.03.01 for capillary electrophoresis. The metabolites were analyzed using a fused silica capillary (50 μm id × 80 cm total length), with commercial electrophoresis buffer (Solution ID: H3301-1001 for cation analysis and H3302-1021 for anion analysis, HMT) as the electrolyte. The sample was injected at a pressure of 50 mBar for 10 s in cation analysis and 25 s in anion analysis. The spectrometer was scanned from m/z 50-1000. Other conditions were as described previously.36-38
2.4.4 Analyses of CE-TOFMS measurements
Peaks were extracted using automatic integration software MasterHands (Keio University, Tsuruoka, Japan) to obtain peak information including m/z, migration time for CE-TOFMS measurement (MT), and peak area.39 Signal peaks corresponding to isotopomers, adduct ions, and other product ions of known metabolites were excluded, and the remaining peaks were annotated with putative metabolites from the HMT metabolite database based on their MTs and m/z values determined by TOFMS. The tolerance range for the peak annotation was configured as ±.5 min for MT and ±10 ppm for m/z. Besides, peak areas were normalized against those of the internal standards, and then the resultant relative area values were further normalized by sample amounts. Hierarchical cluster analysis (HCA) and principal component analysis (PCA) were performed using our proprietary software, PeakStat and SampleStat, respectively. Detected metabolites were plotted on metabolic pathway maps using VANTED (Visualization and Analysis of Networks containing Experimental Data).40
2.4.5 Immunohistochemical staining
Immunochemical staining was carried out using a Discovery XT Automated IHC Stainer with a Ventana DABMap Detection Kit (No. 760–124; Ventana Medical System). Each step of the Ventana DABMap Detection Kit procedure was optimized for the Discovery XT instrument. The antigen was activated by heating. An anti-OGT(O-linked N-Acetylglucosamine transferase) rabbit monoclonal antibody (1:50, EPR12713; Abcam plc) was used.
2.5 Western blotting analysis
The samples were immersed in lysis buffer (50 mmol/L Tris-HCl, pH 7.4, 150 mmol/L sodium chloride, 0.5 mmol/L EDTA, .09 U/mL aprotinin, 1 mg/mL pepstatin, 10 mmol/L phenylmethylsulfonyl fluoride, and 1 mg/mL leupeptin), and incubated for 30 min on ice. The protein concentrations of protein lysates collected in the centrifuge tube were measured using the bicinchoninic acid assay. The protein lysates (5 μg per lane) were separated by 4%-12% SDS-PAGE (NuPAGE, Invitrogen) and transferred to a poly-5(vinylidene difluoride) film (Invitrogen). Before incubation with the primary antibodies, the film was blocked with TBS-T (20 mmol/L Tris-HCl, pH 7.5, 8 g/L sodium chloride, and .1% Tween 20) containing 4% dried skimmed milk. As primary antibodies, anti-β-actin mouse monoclonal antibody (1:1000, sc-47778, Santa Cruz Biotechnology), NF-κB2 (p65) rabbit monoclonal antibody (1:1000, D14E12, #8242, Cell Signaling Technology), NF-κB2 (p100/52), rabbit monoclonal antibody (1:1000, 18D10, #3107, Cell Signaling Technology), and O-GlcNAc mouse monoclonal antibody (1:1000, CTD110.6, #12938, Cell Signaling Technology) were employed.
2.6 Array comparative genomic hybridization (CGH) analysis
We performed a comprehensive genetic analysis of the K14D, ESCC-DR, and ESCC-DRtca2M cells with normal rat esophageal epithelium as the reference. To identify genetic abnormalities caused by cancer progression resulting from TCA stimulation, we performed comprehensive genetic analysis with ESCC-DR as the reference and ESCC-DRtca2M as the test sample. Array CGH analysis was performed using Rat Genome CGH Microarray, 4 × 180 K (Agilent). An analysis was performed according to the manufacturer's instructions (DNA Chip Research Inc.). Copy number gains and losses were defined as changes in the logarithm to the base 2 of the tumor to reference signal intensity ratio (T/R) more than .3219 and less than −.3219, respectively.
3 RESULTS
3.1 Histological findings in animal models
Malignant tumor components were observed in 12 of the 17 models that were sacrificed. ESCC components (Figure 2A) were observed in 7 out of the 17 models, adenosquamous carcinoma components (Figure 2B) were detected in 4 models, and mucinous adenocarcinoma (Figure 2C) components were observed in 5 models. In some cases, histologically varied types of tumor tissues were present in the same individual. The tumors were selected in descending order based on their sizes from the largest macroscopically and used for metabolomics analyses against autologous nonneoplastic tissues.

3.2 CE-TOFMS analysis for rat esophageal tissues
3.2.1 Two-way hierarchical clustering heatmap
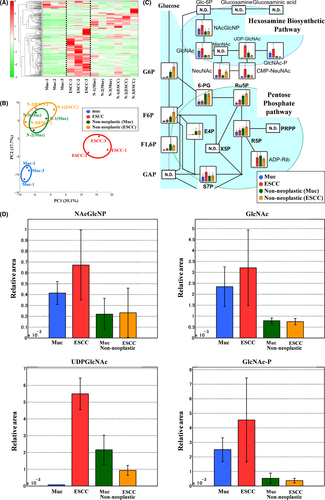
Hierarchical cluster analysis revealed characteristic patterns of expression of the metabolites of rat esophageal tissues (Figure 3A). Each column represents the metabolic patterns in rat esophageal tissues. The amounts of each metabolite in the individual samples are expressed as relative values obtained by the autoscaling method and are illustrated using a color scheme in which red and green indicate high and low concentrations of metabolites, respectively. The HCA identified 3 clusters corresponding to mucinous adenocarcinoma, ESCC, and nonneoplastic samples.
3.2.2 PCA score plot
Principal component analysis revealed characteristic patterns of expression for the metabolites from rat esophageal tissues. The PCA plot also identified 3 clusters corresponding to the mucinous adenocarcinoma, ESCC, and nonneoplastic samples (Figure 3B).
3.2.3 HBP activation in esophageal cancer tissue
Total metabolites were extracted from mucinous adenocarcinomas (blue), ESCCs (red), or nonneoplastic tissues of mucinous adenocarcinoma cases (green) or nonneoplastic tissues of ESCC cases (green). Representative metabolites, such as N-Acetylglucosamine 6-phosphate (NAcGlcNP), N-Acetylglucosamine (GlcNAc), UDP-GlcNAc, and N-Acetylglucosamine 1-phosphate (GlcNAc-P) are illustrated in Figure 3C,D. The HBP end-product, UDP-GlcNAc, is used in the enzymatic posttranslational modification of numerous cytosolic and nuclear proteins by O-linked-N-Acetylglucosamine (O-GlcNAc). The results of the comparative analysis of representative metabolites in rat tissue are summarized in Table 1. We observed increased HBP flux in esophageal cancer tissues (Figure 3C,D). We particularly detected a significant increase in UDP-GlcNAc in ESCCs (Figure 3C,D; Table 1).
| Compound name | Muc vs normal (Muc) | ESCC vs normal (ESCC) | ||
|---|---|---|---|---|
| Ratio | P-value | Ratio | P-value | |
| NAcGlcNP | 1.9 | 0.141 | 2.9 | 0.134 |
| GlcNAc | 3.0 | 0.095 | 4.3 | 0.131 |
| UDP-GlcNAc | 0.03 | NA | 5.9 | 0.009** |
| GlcNAc-1-P | 4.7 | 0.037* | 12 | 0.129 |
Note:
- Statistical analysis was performed using Welch's t test.(* < 0.05, ** < 0.01).
- NA, not available.
3.2.4 Immunohistochemical staining of OGT in rat tissues
We present the results of the immunohistochemical staining activity of OGT in rat tissues in Figure 4. OGT expression considerably increased in both the ESCC (Figure 4B) and the mucinous adenocarcinoma (Figure 4C) compared with the nonneoplastic squamous epithelium located in the oral side of the tumor (Figure 4A).

3.3 Microscopic findings in squamous cell carcinoma cell lines
We have illustrated the morphology of ESCC-DR, ESCC-DRtca, and K14D cells were lines in Figure 5. K14D cells were larger than ESCC-DR and ESCC-DRtca2M, while ESCC-DRtca2M cells had podia formation.

3.4 CE-TOFMS analysis for ESCC lines
3.4.1 Two-way hierarchical clustering heatmap
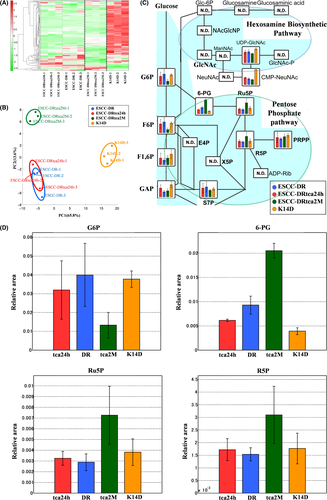
Hierarchical cluster analysis revealed characteristic patterns of expression of the metabolites (Figure 6A). The amounts of each metabolite in individual samples are expressed as relative values obtained using the autoscaling method and are illustrated using a color scheme in which red and green indicate high and low concentrations of metabolites, respectively. The HCA identified 3 clusters corresponding to the K14D, ESCC-DRtca2M, and ESCC-DR and ESCC-DRtca24h cell lines. The ESCCDRtca24h and ESCC-DR clusters were similar.
3.4.2 Score of principal component analysis
Principal component analysis revealed the characteristic patterns of expression of the metabolites (Figure 6B). The PCA plot revealed a clear difference in the metabolome profile, indicating that the PC1 axis mainly comprised the variance information of the K14D group against both the ESCC-DRtca and ESCC-DR groups. The PC2 axis contained the variance information of the ESCC-DRtca2M group against the ESCC-DR and K14D groups. The PCA revealed that a shift in the ESCC-DRtca24h cluster in the direction of that ESCC-DRtca2M cluster occurred following only a 24-h TCA stimulation of ESCC-DR.
3.4.3 Bile acid exposure upregulates the pentose phosphate pathway
Total metabolites were extracted from K14D (orange), ESCC-DR (blue), or ESCC-DRtca2M treated with TCA for 2 mo (red) or from ESCC-DRtca24h treated with TCA for 24 h (green). Representative metabolites, such as glucose 6-phosphate (G6P), fructose 6-bisphosphate (F6P), fructose 1,6-bisphosphate (F1,6P), 6-phosphogluconate (6-PG), ribulose 5-phosphate (Ru5P), and ribose 5-phosphate (R5P) are shown in Figure 6C,D. Results of a comparative analysis of representative metabolites in the ESCC lines are summarized in Table 2. Although the volumes of G6P and F6P associated with glycolysis were similar among the ESCC-DR, ESCC-DRtca24h, and K14D cells, they were the lowest in ESCC-DRtca2M cells. Conversely, Ru5P and R5P level in the ESCC-DRtca2M cells were much higher than in the ESCC-DR, ESCC-DRtca24h, and K14D cells. In addition, 6-PG level in the ESCC-DRtca2M cells was significantly higher than in the other cells (Figure 6C,D, Table 2). The findings above suggested that the PPP in ESCC-DRtca2M was activated more when compared with activation in the other cells.
| Compound name | tca24h vs DR | tca2M vs DR | K14D vs DR | tca2M vs tca24h | ||||
|---|---|---|---|---|---|---|---|---|
| Ratio | P-value | Ratio | P-value | Ratio | P-value | Ratio | P-value | |
| G6P | 0.8 | 0.575 | 0.3 | 0.095 | 0.9 | 0.839 | 0.4 | 0.160 |
| 6PG | 0.7 | 0.097 | 2.2 | 0.001** | 0.4 | 0.026* | 3.3 | 0.003** |
| Ru5P | 1.1 | 0.567 | 2.5 | 0.097 | 1.3 | 0.345 | 2.2 | 0.116 |
| R5P | 1.1 | 0.572 | 2.0 | 0.133 | 1.2 | 0.591 | 1.8 | 0.158 |
Note
- Statistical analysis was performed using Welch's t test.(* < .05, ** < .01).
Most metabolites in the ESCC cell lines in the HBP were not detected (Figure 6C), although HBP activation was observed in esophageal cancer tissues (Figure 3C,D). In addition, UDP-GlcNAc levels in ESCC-DRtca2M were lower than in K14D (Figure 6C). Therefore, increased HBP flux was not observed in the present analysis. Such findings suggested that flux via the HBP could be competitively reduced in favor of the PPP in cells with highly active G6PD.
3.5 Western blotting
The various data obtained from the western blotting analyses are illustrated in Figure 7. G6PD expression was significantly higher in ESCC-DRtca24h and ESCC-DRtca2M cell lines than in K14D and ESCC-DR cell lines. There were no differences in G6PD expression between the ESCC-DRtca24h and ESCC-DRtca2M lines, suggesting that G6PD expression was induced by TCA stimulation. The expression of NF-κB (p65) increased with increase in the malignancy of tumor cells, however there was no relationship between NFκB2 (p100/p52) expression and tumor-cell malignancy. In addition, the expression of O-GlcNAc increased with increase in tumor-cell malignancy.

3.6 CGH microarray analysis of ESCC lines
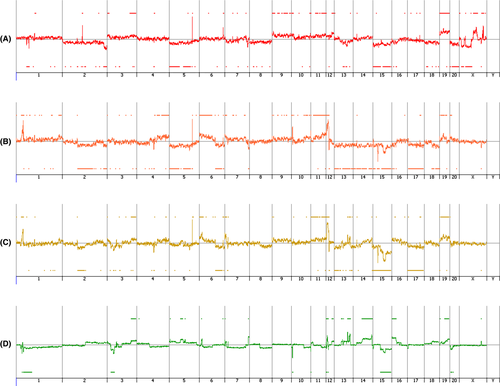
Numerous chromosome abnormalities were observed in all the 3 cell lines (K14D, ESCC-DR, ESCC-DRtca2M) (Figure 8A-C). To determine genetic abnormalities caused by cancer progression following stimulation by TCA, we performed a CGH analysis with ESCC-DR as the reference and ESCC-DRtca2M as the test sample. We also observed numerous additional chromosomal alterations in the analysis (Figure 8D). Comparison of ESCC-DR and ESCC-DRtca2M cell lines revealed that when cancer progression was due to TCA administration, numerous chromosomal abnormalities developed.
4 DISCUSSION
Enhanced glucose metabolism was observed in the cancer tissues and ESCC cell lines examined in the present study. Notably, cancer tissues that developed in the reflux model exhibited greater activation of the HBP than those in the nonneoplastic tissues. Our ESCC line-based experiments demonstrated that TCA administration induced G6PD overexpression and PPP activation. In addition, the experiments revealed that higher degrees of malignancy accompanied the increase in O-GlcNAc modifications and NF-κB (p65) overexpression.
Cancer cells exhibit increased uptake of glucose and glutamine, and upregulate metabolic flux through the HBP leading to hyper-O-GlcNAcylation.41 The HBP integrates glucose metabolism, amino acid metabolism (glutamine), fatty acid metabolism (Acetyl-coenzyme A), and nucleotide metabolism (uridine triphosphate, UTP) to synthesize UDP-GlcNAc, the donor substrate for the O-GlcNAcylation of proteins.42-44 O-GlcNAc levels are significantly elevated in various cancer types, including cancer of the breast, prostate, colon, lung, pancreas, and chronic lymphocytic leukemia.45-50 O-GlcNAcylation is a dynamic and reversible glycosylation of serine or threonine residues in a variety of nuclear and cytoplasmic proteins.51 The addition of O-GlcNAc to proteins is catalyzed by O-GlcNAc transferase (OGT).52, 53 In the present study, flux to HBP was elevated in rat esophageal cancer tissues and increased UDP-GlcNAc expression was particularly apparent in ESCCs. Furthermore, OGT expression levels increased in esophageal cancer tissues compared with in nonneoplastic squamous epithelium. These results suggest that O-GlcNAcylation was elevated to higher levels in esophageal cancer tissues than in nonneoplastic tissues. The western blotting analysis also confirmed that O-GlcNAc modification increased simultaneously with increase in tumor-cell malignancy in the cell line-based experiments.
NF-κB is a family of transcription factors including RelA/p65, RelB, c-Rel/Rel, p105/p50, and p100/p52. They are characterized by an N-terminal Rel-homology domain, which is responsible for DNA binding and dimerization.54 NF-κB controls numerous biological processes, including innate immunity, inflammation, cell survival and proliferation, and tumorigenesis.55, 56 Posttranslational modifications such as phosphorylation57-62 and acetylation63, 64 regulate the transcriptional activity of NF-κB. O-GlcNAcylation of NF-κB is necessary for nuclear translocation and the consequential transcriptional activation of the downstream signaling of NF-κB.65 NF-κB (p65) is O-GlcNAc-modified at Thr-305, Ser-319, Ser-337, Thr-352, and Ser-374 and phosphorylated at Thr-308.66 In the present cell line-based experiments, NF-κB (p65) expression increased based on cancer progression.
Reprogramming of glucose metabolism is one of the key characteristic features of cancer cells that coordinate glucose utilization with cell physiology. The rapid proliferation is the redirection of glucose toward the PPP, which may be beneficial to the biosynthesis.67, 26, 68 The first rate-limiting enzyme of the PPP is G6PD, whose activity and location are regulated by p53, BAG3, HGF, and AMP kinase.67-69 According to previous studies, G6PD is an oncogene that is upregulated in various tumors including bladder cancer,70 breast cancer,71, 72 and ESCC.73-75 The overexpression of G6PD is closely associated with the progression of gastric cancer and could be an independent predictor for the poor prognosis of gastric cancer.76 A recent study also reported that increased G6PD expression was associated with aggressive colon cancer cases.77 Based on the present results of the PCA, a shift of the ESCC-DRtca24h cluster in the direction of the high malignancy ESCC-DRtca2M cluster occurred following only a 24-h stimulation of ESCC-DR by TCA.
The HBP was activated in the esophageal cancer tissues that we tested. However, in our cell line-based experiments, it gave way to greater PPP activation with increasing malignancy. A minor branch of glucose metabolism, the HBP, begins with the metabolism of F6P, an intermediate glycolysis metabolite produced by the isomerization of G6P. In high-grade tumors, however, G6P is preferentially utilized in the PPP, and consumed by G6PD, and this minimizes its conversion into F6P. This implies that flux through the HBP may be competitively reduced in favor of the PPP in cells with highly active G6PD, even when the former pathway was activated during the early stages of tumor development. Recently, it was reported that the activation of G6PD O-GlcNAcylation upregulates glucose flux via the PPP.78 Increased HBP flux imply the involvement of O-GlcNAc modification. Indeed, our cell line-based experiments demonstrate that O-GlcNAc expression rises with an increase in malignancy, implying that O-GlcNAc modification is already elevated during the early stages of tumor development.
A comparison of ESCC-DR and ESCC-DRtca2M in studies using a CGH microarray revealed a large number of chromosomal changes to ESCC-DRtca2M compared with ESCC-DR. The mechanism by which the malignancy of the tumor increased following chronic TCA stimulation alone, which is thought to have no mutagenicity, could not be elucidated. Although it is possible that only cells that could resist TCA stimulation were selected and survived, which further elevates malignancy of the sub-cultured cells, the results of the western blotting test performed suggested that the overexpression of G6PD due to 24-h TCA stimulation indicated that the PPP was activated by TCA stimulation. It is unlikely that a genetic abnormality could appear within 24 h. In addition, we cannot eliminate the possibility that reprogramming of cancer-tissue metabolism occurred first and that numerous genetic defects were induced following chronic TCA stimulation.
In summary, we carried out a series of metabolomics analyses on neoplastic and nonneoplastic esophageal tissue from reflux model rats and performed cell line-based experiments including CGH microarrays analyzes. We observed that TCA stimulation resulted in high levels of additional chromosomal changes despite bile acids not being mutagenic. The result suggested that TCA-mediated G6PD activation accelerates cancer progression, including genetic changes, by upregulating the PPP and overexpressing NF-κB (p65). Our study demonstrated how glucose metabolism is upregulated in response to the isolated stimulus of TCA exposure in a series of steps, from carcinogenesis to cancer progression. All steps potentially occur based on O-GlcNAc modification.
ACKNOWLEDGMENTS
We thank Professor Masaru Yoshida (Division of Metabolomics Research, Gastroenterology, Center for Mass Spectrometry, in Kobe University Graduate School of Medicine/School of Medicine), who gave valuable advice on this study. This study was supported in part by Astra Zeneca under AZKK Research Grant Number 201500078 and by AMED under Grant Number 18ck0106264h0002.
DISCLOSURE
The authors have no conflict of interest.


