Spontaneous development of intratumoral heterogeneity in a transposon-induced mouse model of glioma
Abstract
Glioma is the most common form of malignant brain cancer in adults. The Sleeping Beauty (SB) transposon-based glioma mouse model allows for effective in vivo analysis of candidate genes. In the present study, we developed a transposon vector that encodes the triple combination of platelet-derived growth factor subunit A (PDGFA), and shRNAs against Nf1 and Trp53 (shNf1/shp53). Initiation and progression of glioma in the brain were monitored by expression of a fluorescent protein. Transduction of the vector into neural progenitor and stem cells (NPC) in the subventricular zone (SVZ) of the neonatal brain induced proliferation of oligodendrocyte precursor cells, and promoted formation of highly penetrant malignant gliomas within 2-4 months. Cells isolated from the tumors were capable of forming secondary tumors. Two transposon vectors, encoding either PDGFA or shNf1/shp53 were co-electroporated into NPC. Cells expressing PDGFA or shNf1/shp53 were labeled with unique fluorescent proteins allowing visualization of the spatial distribution of cells with different genetic alterations within the same tumor. Tumor cells located at the center of tumors expressed PDGFA at higher levels than those located at the periphery, indicating that intratumoral heterogeneity in PDGFA expression levels spontaneously developed within the same tumor. Tumor cells comprising the palisading necrosis strongly expressed PDGFA, suggesting that PDGFA signaling is involved in hypoxic responses in glioma. The transposon vectors developed are compatible with any genetically engineered mouse model, providing a useful tool for the functional analysis of candidate genes in glioma.
1 INTRODUCTION
Glioma is the most common form of malignant brain cancer in adults. Gliomas are classified into grades I-IV based on the World Health Organization (WHO) grading system.1 Grade IV gliomas, also known as glioblastomas are the most aggressive form of gliomas. Patients with glioblastoma generally receive a poor prognosis, with a mean survival of approximately 1 year.2 Comprehensive profiling of genomic alterations in gliomas has indicated recurrent molecular events that underlie this disease.3 Genetically engineered mouse models of glioma have been developed to investigate the molecular causality of these genetic alterations for tumor initiation, progression and metastasis.4
Significant efforts have been made to introduce multiple genetic alterations to specific cell types at specific developmental time points, indicating that the identity of the mutation-bearing cells is a determinant of the characteristics of resultant gliomas.5-7 The Cre/LoxP system affords the most powerful tool for this purpose, but requires complex and time-consuming breeding strategies when more than 2 genetic alterations are to be introduced. Somatic cell gene transfer provides an alternative strategy for this purpose. The Sleeping Beauty (SB) transposable element has been used to transfer multiple DNA sequences into neural progenitor and stem cells (NPC).8 Wiesner et al showed that the triple combination of NRAS-G12V, EGFRvIII, and shp53 induced gliomas with 100% efficiency and median survival was 83 days. The piggyBac transposon system has been used to induce glioma with HRAS and AKT mutations.9, 10 One limitation of the existing transposon-based glioma models is that RAS mutations are rare in human gliomas;3 thus, there is a need for a highly penetrant glioma mouse model that genetically mimics human gliomas.
Recent profiling of human gliomas by single-cell RNA-sequencing (RNA-seq) indicated previously unrecognized intratumoral heterogeneity in transcriptional programs.11, 12 The cause of such diversity remains unclear; it is possible that different mutations harbored in individual cells, epigenetic states in tumor cells, and the tumor microenvironment may be responsible for the diversity. Interclonal cooperation between tumor subclones maintains tumor heterogeneity in mammary cancer,13 but such cooperation has not been documented in glioma. To obtain a better understanding of the cause of intratumoral heterogeneity in glioma, mouse models that recapitulate the complex population dynamics of tumor subclones are needed. Chen et al10 co-electroporated multiple transposon vectors, encoding different fluorescent proteins, together with the vectors encoding oncogenes, and visualized clonal expansion and mixing in glioma. Although there was no direct comparison of the behaviors of tumor subclones harboring either HRAS or AKT mutations, this strategy can be used to analyze population dynamics within the same tumor.
In the present study, we developed a transposon vector encoding the triple combination of platelet-derived growth factor subunit A (PDGFA), and shRNAs against Nf1 and Trp53 (shp53/shNf1). PDGF signaling is a key regulator of oligodendrocyte development and for glioma.14, 15 The PDGF family consists of covalently linked hetero- or homodimers of A-, B-, C-, and D-chains (PDGF-AA, -AB, -BB, -CC, and -DD). These ligands bind to heterodimeric α and β tyrosine kinase receptors and activate downstream signaling. PDGFA is expressed in approximately 81% of malignant gliomas.16 PDGF-AA binds only to PDGF receptor alpha (PDGFR-α), which is encoded by PDGFRA. PDGFRA is amplified, mutated, or rearranged in a subset of human glioblastomas.16-19 The NF1 tumor suppressor gene is responsible for the genetically heritable disease neurofibromatosis type 1.20 NF1 mutations are present in ~10% of human glioblastomas.3 In gliomagenesis, a gain of several copies of Chr 7 occurs in the early stage and is concurrent with PDGFA overexpression, followed by NF1 loss at the late stage.21 The NF1 loss is associated with TP53 mutations.22 Ozawa et al21 modeled these mutations in mice using the RCAS/tv-a retroviral system, and showed that the triple combination of PDGFA, shNf1, and shp53 induced glioblastoma. The initiation and progression of glioma in this model remain undetermined because of the difficulty in visualizing the cells transduced with 3 RCAS retroviral vectors.
Herein, we showed that a single transposon vector containing the triple combination of PDGFA, shNf1 and shp53, efficiently induced glioma in mice. Expression of a fluorescent protein allowed us to monitor the initiation and progression of glioma. We then co-electroporated 2 transposon vectors, encoding either PDGFA or shp53/shNf1. By labeling cells harboring distinct genetic alterations with unique fluorescent proteins, we visualized the cells with distinct genetic alterations within the same tumor. We showed that intratumoral heterogeneity in PDGFA expression levels spontaneously developed within the same tumor. Our study shows that co-transduction of multiple transposon vectors is effective in producing intratumoral heterogeneity in vivo.
2 MATERIALS AND METHODS
2.1 Plasmid construction
To generate the transposon vectors, we first generated a pT2/shp53/shNf1/polyA vector. This vector was generated by inserting the H1 promoter-shRNA expression cassette excised from pSUPER.retro.puro vector, and BGH-polyA sequence PCR-amplified from pL453 vector into pT2/Onc2 vector23 digested with HindIII and StuI. To generate pT2/shp53/shNf1/SV40-GFP vector (NP vector), SV40-GFP cassette was PCR-amplified from pT2/shp53/GFP4 vector (Addgene, Cambridge, MA, USA), and inserted into pT2/shp53/shNf1/polyA vector. To generate pT2/shp53/shNf1/CMV-PDGFA-IRES-DsRed vector (PNP vector), we introduced EcoRV sites upstream of the CMV promoter in pIRES2-DsRed-Express vector (Clontech, Mountain View, CA, USA). PDGFA was PCR-cloned from the cDNA isolated from SW480 cell line, and inserted into pIRES2-DsRed-Express vector. The CMV-PDGFA-IRES-DsRed sequence was excised, and inserted into pT2/shp53/shNf1/polyA vector. SB1123 was inserted into pMXs-IRES-Puro vector (Cell Biolabs, San Diego, CA, USA). pT2/CMV-PDGFA-IRES-DsRed vector (P vector) was generated by inserting the CMV-PDGFA-IRES-DsRed sequence into pT2/polyA backbone. pT2/CAG-EGFP vector (GFP vector) was generated by inserting the CAG-EGFP-polyA sequence into pT2 backbone. We used the previously reported shRNA for Nf1 (5′-GGACACAATGAGATTAGAT-3′)24 and Trp53 (5′-GTACATGTGTAATAGCTCC-3′).7
2.2 Animal experiments
Electroporation was carried out as described previously.25 Briefly, ICR mouse pups (Japan SLC, Shizuoka, Japan) at postnatal day 0-1 were anesthetized by hypothermia. 2.0 μL of a plasmid DNA mix (~5.0 μg/μL) in PBS was injected into the left lateral ventricle. Platinum Tweezertrodes (7.5 mm) were placed on each side of a mouse head with 6 pulses of 100 V (50 ms; separated by 950 ms) using the Square Wave Electropolator CUY21SC (NEPA GENE). Animals were monitored twice a week until the mice showed neurological symptoms or weight loss. For sick mice, 5-ethynyl-2′-deoxyuridine (EdU) (50 mg/kg body weight) was injected ip, once per day for 4 days prior to necropsy. Intracranial injection (1 × 10⁵ cells) was done on nude mice (BALB/cSlc-nu/nu; Japan SLC). EdU was injected once 1 day prior to necropsy. All manipulations were carried out with institutional approval (The Institute of Medical Science, The University of Tokyo).
2.3 Cell line experiments
Experiments with NIH3T3 cells were carried out as described previously.26 Briefly, NIH3T3 cells were transfected with pMXs-IRES-Puro or pMXs-SB11-IRES-puro vectors with the NP vector using GeneJuice reagent (Millipore, Burlington, MA, USA). After puromycin selection (1 μg/mL), transfected cells were cultured until transient expression decreased. Percentage of GFP+ cells was analyzed with FACSCalibur (BD). To examine knockdown efficiency, NIH3T3 cells were transfected with pMXs-SB11-IRES-puro and the GFP or NP vectors. qPCR analysis was carried out on Light Cycler 1.5 (Roche, Basel, Switzerland) using the following primers. Nf1 F: 5′-AGCTCTACTCACAGTGTCTG, R: 5′-GAGGGAATCCTTTGGGTTTC. Trp53 F: 5′-ACGCTTCTCCGAAGACTGG, R: 5′-AGGGAGCTCGAGGCTGATA. Gapdh F: 5′-TGACCACAGTCCATGCCATC, R: 5′-CATACCAGGAAATGAGCTTGAC. Sdha F: 5′-GTGTGAAGTAGGGCAGGTCC, R: 5′-ACAAGGCACTGGCTCGATAC.
2.4 Primary culture of glioma cells
Tumors were dissociated and cultured in the serum-free medium as described previously.27
2.5 Histology and tumor analysis
Perfusion fixation was carried out prior to dissection, and the brain was fixed in 4% paraformaldehyde (PFA). Brains were embedded in FSC22 compound (Leica). Brain sections (10 μm) were prepared by using a microtome (Leica).
2.6 Immunohistochemistry
Tissue sections were incubated with the following primary antibodies: chicken anti-GFP (ab13970; Abcam, Cambridge, UK), mouse anti-GFAP (G3893; Sigma, St Louis, MO, USA), anti-Nestin (611658; BD), anti-RFP (M165-3; MBL), anti-PDGFA (sc-9974; Santa Cruz Biotechnology, Santa Cruz, CA, USA), anti-Synaptophysin (MAB5258; Millipore), anti-Vimentin (V6630; Sigma), anti-p53 (sc-126; Santa Cruz Biotechnology), rabbit anti-Olig2 (NBP1-28667SS; Novus Biologicals, Littleton, CO, USA), anti-RFP (PM005; MBL), anti-NeuN (ab177487; Abcam), anti-MMP2 (ab37150; Abcam), anti-Nf1 (sc-67; Santa Cruz Biotechnology), rat anti-Pdgfra (558774; BD). Alexa Flour 488, 594 or 647-conjugated appropriate secondary antibodies (Invitrogen, Carlsbad, CA, USA) were used. EdU staining was carried out using Click-iT Assay Kits (Invitrogen) according to the manufacturer's protocol. Images were obtained with AxioImager M1 microscope (Zeiss, Oberkochen, Germany).
3 RESULTS
3.1 Generation of a transposon vector with the triple combination of PDGFA, shp53, and shNf1
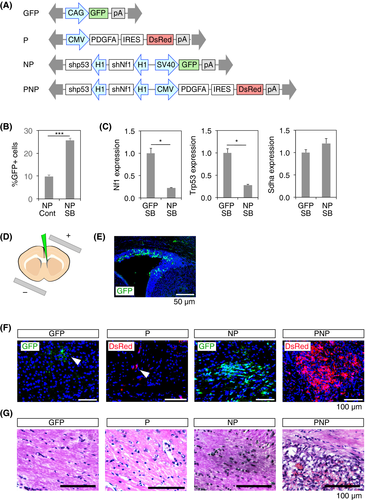
Four transposon vectors were constructed that allowed for constitutive expression of cDNAs and shRNAs after genomic integration (Figure 1A). GFP vector induces the expression of GFP. P vector expresses PDGFA and DsRed, the latter of which was bicistronically expressed by the internal ribosome entry site (IRES) element. NP vector induces the expression of shNf1 and shp53, in conjunction with GFP. PNP vector expresses PDGFA, DsRed, shNf1, and shp53. We used the DsRed-Express fluorescent protein, which has a short half-life (~12 hours),28 and is well suited to monitoring the expression levels of PDGFA. The previously reported shRNAs were used for shNf1 and shp53.7, 24, 27 The SB transposon system is composed of 2 elements: a transposon DNA substrate and the SB transposase enzyme.29 The transposon DNA substrate can be delivered as a plasmid DNA to achieve chromosomal integration and long-term expression. The SB transposase was investigated to determine whether it promoted genomic integration of transposon vectors. The NP vector was transfected into NIH3T3 cells with or without the SB expression vector. SB transposase promoted stable GFP expression on day 18 (Figure 1B). qPCR analysis confirmed that the expression levels of Nf1 and Trp53 were both decreased in the cells transfected with the NP vector (Figure 1C).
3.2 PNP vector efficiently induced gliomas in mice
Electroporation of the neonatal forebrain was used to deliver transgenes to NPC located in the walls of the lateral ventricle (LV) of the developing brain.9, 30 After electroporation, the non-integrated transposons were rapidly diluted and the integrated transgenes were stably expressed in successive progeny of the electroporated cells. Plasmid DNAs were injected into the left LV of neonatal mice at postnatal day 0-1 (P0-1), and electroporation was carried out (Figure 1D). Electroporation of the GFP vector resulted in expression of GFP in the subventricular zone (SVZ) cells on day 2 after electroporation (Figure 1E). Transposon vectors were then electroporated with the SB expression vector and the brain was analyzed at 8 weeks. GFP- and DsRed-expressing cells were observed in the brain parenchyma of the mice transduced with the GFP or P vectors, respectively (Figure 1F). Very few GFP- and DsRed-expressing cells were present in the brain sections, indicating that the GFP and P vectors did not induce the proliferation of transduced cells. Additionally, H&E staining showed no histological abnormalities (Figure 1G). The NP vector induced the accumulation of GFP+ cells in the brain parenchyma (Figure 1F). The regions with GFP+ cells displayed increased cellularity after H&E staining (Figure 1G). Transduction of the PNP vector induced clusters of DsRed-expressing cells, and H&E staining showed lesions characterized by high cellular density and local hemorrhage, consistent with a glioma lesion (Figure 1F,G).
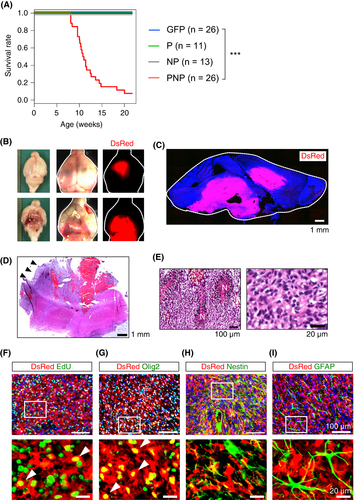
Analysis of the Kaplan-Meier survival curve indicated that the mice electroporated with the GFP, P, or NP vector survived up to 20 weeks without any behavioral changes. More than 90% of the mice electroporated with the PNP vector (PNP mice) showed symptoms associated with brain cancer such as gait abnormality, hunched posture, and weight loss by 20 weeks, and were euthanized (Figure 2A). Analysis of the whole brain showed local hemorrhages with strong DsRed fluorescence (Figure 2B). Analysis of brain sections indicated extensive growth of DsRed+ cells within the cortex and brainstem (Figure 2C). Histological analysis of the tumors showed morphological features of glioma with hemorrhage and palisading necrosis, indicating that the tumors had malignant features (Figure 2D,E). DsRed+ tumor cells had incorporated EdU, and expressed Olig2, but not Nestin and GFAP (Figure 2F-I). GFAP expression was observed only in reactive astrocytes (Figure 2I). These findings indicate that tumor cells have characteristics of oligodendrocyte precursor cells (OPC). PDGFA was strongly expressed in tumors of PNP mice, and expression levels of Nf1 and p53 were minimal, as expected (Figure S1A-C). Expression of Pdgfra, Ki67, and Sox2 were observed in tumors (Figure S1D-F). CD31 staining showed the presence of blood vessels in PNP tumors (Figure S1G).
We next examined the invasive front of the tumors in PNP mice. DsRed+ tumor cells diffusely migrated away from the main tumor mass (Figure S1H). Glioma cells invade the brain tissue either individually or as cohesive groups preferentially moving along blood vessels.31 In the brain of PNP mice, most tumor cells disseminated as single cells, and direct contact between DsRed+ tumor cells and CD31+ blood vessels was not observed (Figure S1H), suggesting that most tumor cells invaded individually into the brain parenchyma in PNP mice.
We then investigated whether tumor-initiating cells are involved in tumors of PNP mice. Cells obtained from the tumors formed DsRed-expressing spheres in vitro (Figure S2A). Transplantation of these cells into the brains of immunodeficient mice resulted in tumor formation at around 3-4 weeks post-injection (Figure S2B,C). Secondary tumors recapitulated the histological features of the original tumor (Figure S2D). Tumor cells expressed DsRed and Olig2, and incorporated EdU (Figure S2E). These data indicate the presence of tumor-initiating cells in tumors of PNP mice.
3.3 PNP vector induced expansion of Olig2+ cells and proliferation of tumor-associated OPC
Analysis of the brain of PNP mice at 2 weeks showed the presence of DsRed+ cell clusters in the brain parenchyma, ~500 μm from the lateral ventricle (Figure 3A), indicating migration of the transfected cells from the SVZ. DsRed+ cells expressed Olig2 and had incorporated EdU (Figure 3B), indicating that the PNP vector induced the proliferation of Olig2+ OPC. At 4-6 weeks, sizes of the DsRed+ clusters increased (Figure 3C), and immunohistochemical analysis indicated the presence of EdU-incorporated proliferative DsRed+ cells (Figure 3D,E). These DsRed+ tumor-initiating cells expressed Olig2 (Figure 3E, arrowheads). Additionally, EdU+ proliferating cells were observed outside of the cluster of DsRed+ tumor cells (Figure 3D,F). These EdU+ DsRed- non-tumor cells expressed Olig2, indicating the proliferation of normal OPC in the brain parenchyma. These findings indicate that the PNP vector transformed Olig2+ OPC into tumor-initiating cells, associated with the proliferation of tumor-associated OPC.32
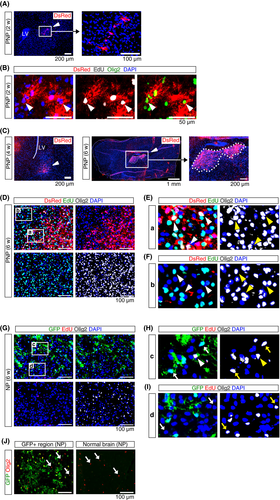
No mice transduced with the NP vector (NP mice) showed any phenotypes associated with brain cancer up to 20 weeks (Figure 2A). Previous studies indicated that conditional knockout of both Nf1 and Trp53 in NPC induced the expansion of OPC.33 To investigate whether the NP vector induced OPC expansion, a histological analysis of the brain of NP mice was conducted. GFP+ cells diffusely distributed in the brain of NP mice at 6 weeks (Figure 3G). GFP+ cells expressed Olig2 (Figure 3H, arrows), but the majority were EdU-negative, indicating that GFP+ cells were slowly cycling. Proliferative tumor-associated OPC were not observed (Figure 3I, arrows). The number of GFP-negative OPC in the brain parenchyma was comparable between regions with or without GFP+ cells (Figure 3J). These findings indicate that the NP vector induced slow growth of OPC, but these cells were not associated with proliferative tumor-associated OPC.
3.4 Intratumoral heterogeneity developed spontaneously in tumors in P+NP mice
To investigate the mechanism by which PDGFA cooperated with shNf1/shp53, we co-electroporated the P and NP vectors (P+NP mice). Genomic integration of the P or NP vector induces the expression of DsRed or GFP, respectively. Clusters of transduced cells are visualized as “red” or “green” (Figure 4A). Transfected cells that acquire genomic integrations of both P and NP vectors express both DsRed and GFP, visualized as “yellow” cells present within the cluster (Figure 4A). The expression levels of GFP and DsRed are variable; therefore, “red” and “green” cells may also be present within the cluster.
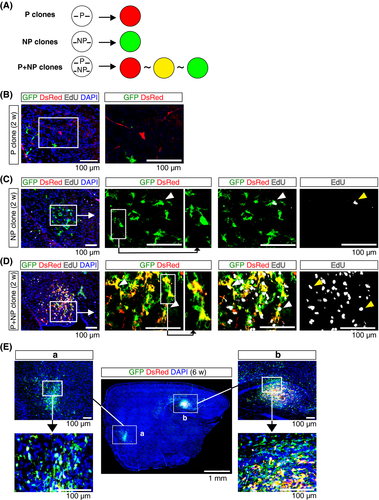
Histological analysis of the brain was carried out at 2 weeks post-electroporation, when transient gene expression was no longer present in dividing cells. The majority of “red” cells remained as a single cell (P clone) (Figure 4B); clusters of “green” cells, which incorporated the NP vector (NP clone), were observed (Figure 4C). “Green” cells occasionally incorporated EdU. Clusters containing “yellow” cells were observed, indicating that the cluster was derived from cells that incorporated both the P and NP vectors (P+NP clone) (Figure 4D). An abundance of EdU+ cells was observed in “yellow” cells, indicating active proliferation. At 6 weeks post-electroporation, clusters of tumor cells were detectable at low magnification (Figure 4E). A cluster consisting mainly of “green” cells showed an infiltrative phenotype (Figure 4E-a), whereas a cluster that included “yellow” cells contained cells that were densely packed at the center of the cluster (Figure 4E-b). “Yellow” cells were observed at the center of the clusters, with “green” cells at the peripheral region of the clusters.
P+NP mice showed neurological phenotypes after 8 weeks. Analysis of the Kaplan-Meier survival curve showed that survival rates were comparable between P+NP and PNP mice (S3A, log-rank test: P = .39). H&E staining showed that tumors in P+NP mice had morphological features similar to those observed in PNP mice (S3B). Analysis of PDGFA expression indicated that PDGFA was strongly expressed in “yellow” cells compared to “green” cells in tumors of P+NP mice (S3C), whereas PDGFA was uniformly expressed in tumors of PNP mice (Figure S1A). Expression patterns of Pdgfra, Nf1, and p53 were comparable between tumors in P+NP and PNP mice (Figures S1B-D,S3D-F).
Histological analysis of the brain of a P+NP mouse showed a large tumor mass at 10 weeks (Figure 5A). The center of the tumor consisted of “yellow” and “red” cells (Figure 5A-c,d). The peripheral region mainly consisted of “green” cells (Figure 5A-a,b,e). “Yellow” or “red” cells were densely packed, whereas “green” cells showed diffuse invasion. A tumor cell cluster consisting only of “green” cells, cells transduced with the NP vector (NP cells), was also identified (Figure 5A-f). NP cells showed a diffuse infiltrative distribution with a smaller cell body than “green” cells in the main tumor mass (Figure 5A-f). Analysis of the brain of 2 additional sick mice showed the presence of tumors with “yellow” cells (Figure 5B). “Yellow” and “red” cells were found near the center of the tumors, whereas the periphery of the tumors consisted of invasive “green” cells (Figure 5B). Pseudopalisading necrosis was identified in tumors in P+NP mice (Figure 5C). Strong DsRed signals were observed in pseudopalisading tumor cells; GFP signals were homogenously expressed in tumor cells (Figure 5C). These findings indicate that tumor cells located at the center of tumors expressed PDGFA at higher levels than those at the periphery, and this pattern consistently developed in tumors in P+NP mice.

To investigate whether phenotypic differences exist among tumor subclones in P+NP mice, we examined expression levels of neuronal markers (NeuN and Synaptophysin) and mesenchymal markers (MMP2 and Vimentin) in tumors of P+NP mice. Expression of neuronal markers was not observed Figure S4A,B). In contrast, MMP2 and Vimentin were strongly expressed in “green” cells located at the periphery of the tumors, whereas their expression levels were minimal in “yellow” or “red” cells (Figure S4C,D), indicating the presence of phenotypic heterogeneity in tumor cell populations in P+NP mice.
4 DISCUSSION
In the present study, we generated a new mouse model of glioma by using the SB transposon system. The advantages of this model are: (i) transposon vectors encode fluorescent proteins, which allowed for the detection of genetically modified cells in the brain; (ii) a single transposon vector (PNP) was sufficient to induce glioma, and the vector is compatible with any existing genetically engineered mouse model; and (iii) co-transduction of two transposon vectors (P+NP) spontaneously generated intratumoral heterogeneity.
To mimic human glioma, genetic alterations frequently observed in human glioma were used: PDGFA, NF1, and TP53. The NRAS/shp53 system developed by Wiesner et al8 has been used to analyze the role of candidate genes, such as Ifnar1 and Atrx, for glioma formation;34, 35 however, RAS mutations are not common in human gliomas.3 Unlike the NRAS/shp53 system, the PNP vector contains all cDNAs and shRNAs necessary for tumor formation within the same vector, allowing for the detection of genetically modified cells using a fluorescence signal. Monitoring GFP or DsRed fluorescence enabled analysis of the initiation and progression of proliferative lesions in P, NP, and PNP mice. P vector alone did not induce proliferative lesions. The NP vector promoted the proliferation of Olig2+ OPC, as reported previously;33 however, their growth was slow and the mice remained healthy for a minimum of 20 weeks. In sharp contrast, the PNP vector induced proliferation of Olig2+ OPC and tumor formation. Several differences between the cells transduced with the NP vector (NP cells) or the PNP vector (PNP cells) were observed. NP cells were sparsely distributed, were small and extended long and fine processes, and did not induce tumor-associated OPC. In contrast, PNP cells were densely packed, showed amoeboid morphology with thick and short processes, and accompanied tumor-associated OPC. These findings indicate that PDGFA accelerates malignant transformation through cell autonomous and non-cell autonomous mechanisms. Cell autonomous effects were likely mediated by the autocrine activation of PDGFR signaling in PNP cells. Non-cell autonomous effects were likely induced by paracrine activation of the PDGFR-α in normal OPC in the brain parenchyma,36 resulting in the proliferation of tumor-associated OPC. Tumor-associated OPC support glioma growth by promoting endothelial sprouting.32
Intratumoral heterogeneity in GFP and DsRed expression spontaneously developed within P+NP tumors. DsRed-Express protein has a short half-life and DsRed fluorescence reflects PDGFA mRNA expression levels. “Yellow” or “red” cells expressed PDGFA at higher levels than “green” cells. Tumor cells at the invasion front were predominantly “green” cells, whereas “yellow” or “red” cells were always located at the center of the tumors. Malignant gliomas have extensive areas of hypoxia and necrosis as a result of tumor outgrowth and changes in oxygen availability.37 Hypoxic regions often accompany pseudopalisading necrosis, which is caused by the presence of a hypoxic center and migrating tumor cells.38 Strong DsRed signals were observed in pseudopalisading tumor cells, indicating that PDGFA conferred a growth advantage to glioma cells in hypoxic regions. PDGFR-α signaling activates Akt and mammalian target of rapamycin (mTOR) in glioma cells, and causes metabolic changes in glioma.39 Hypoxic stress induces glioma cells to migrate away from hypoxic areas by promoting a mesenchymal shift.40 As Nf1 loss converts glioma cells to the mesenchymal subtype,21 glioma cells at the invasion front showed the Nf1 knockdown phenotype (“green” cells) rather than PDGFA upregulation (“yellow” or “red” cells). Intratumoral heterogeneity of PDGFA expression has not previously been reported in human gliomas,16 possibly because tumor specimens represent only a portion of the original tumors. Detailed analysis of the expression patterns of PDGFA in human gliomas in a 3D microenvironment is needed.
These results indicate that the triple combination of PDGFA, shNf1, and shp53 efficiently induced gliomas in mice. This model requires a single transposon vector and provides a useful tool for functional analyses of candidate genes in glioma formation. Co-electroporation of multiple transposon vectors allowed visualization of the spatial distributions of cells with distinct genetic alterations within the same tumor, and will facilitate the analysis of interclonal cooperation between tumor subclones.
ACKNOWLEDGMENTS
The authors thank Shuga Ando for supporting electroporation experiments and histological analyses. This work was supported by the Japan Society for the Promotion of Science (JSPS) for Grant-in-Aid for Scientific Research on Innovative Areas (15H01482), and Grant-in-Aid for Young Scientists (A) (17H04988). The authors declare no competing financial interests.
CONFLICTS OF INTEREST
Authors declare no conflicts of interest for this article.


