DCC in the cerebral cortex is required for cognitive functions in mouse
Abstract
Schizophrenia (SZ) is a highly heritable mental disorder, and genome-wide association studies have identified the association between deleted in colorectal cancer (DCC) and SZ. Previous study has shown a lowered expression of DCC in the cerebral cortex of SZ patient. In this study, we identified novel single nucleotide polymorphisms (SNPs) of DCC statistically correlated with SZ. Based on these, we generated DCC conditional knockout (CKO) mice and explored behavioral phenotypes in these mice. We observed that deletion of DCC in cortical layer VI but not layer V led to deficits in fear and spatial memory, as well as defective sensorimotor gating revealed by the prepulse inhibition test (PPI). Critically, the defective sensorimotor gating could be restored by olanzapine, an antipsychotic drug. Furthermore, we found that the levels of p-AKT and p-GSK3α/β were decreased, which was responsible for impaired PPI in the DCC-deficient mice. Finally, the DCC-deficient mice also displayed reduced spine density of pyramidal neurons and disturbed delta-oscillations. Our data, for the first time, identified and explored downstream substrates and signaling pathway of DCC which supports the hypothesis that DCC is a SZ-related risky gene and when defective, may promote SZ-like pathogenesis and behavioral phenotypes in mice.
1 INTRODUCTION
Schizophrenia (SZ) is a devastating psychiatric disorder characterized by heterogeneous symptom constellations [1]. Family and twin studies have suggested that the heritability of SZ is estimated at 60%–80% [2]. Genome-wide association studies (GWAS) have identified hundreds of genetic loci associated with SZ, but recognizing the way from association to function is still challenging [3]. Until now, only a few risk genes have obtained mechanistic insights on their contributions to SZ [4].
Recent GWAS data have linked deleted in colorectal cancer (DCC) with SZ based on the data from several independent cohort studies [5, 6]. DCC has been also reported to feature the most pleiotropic association across eight psychiatric disorders including SZ [7]. Cross-disorder GWAS SNPs in the DCC locate in the 18q21.2 region surrounding SNP rs8084351, which colocalized with brain eQTLs for DCC. Using a range of bioinformatic and functional genomic analyses, the study finds that loci with pleiotropic effects are distinguished by their involvement in early neurodevelopment pathways including neurogenesis, regulation of nervous system development, and neuronal differentiation. Extensive evidences point out that neurodevelopment effects underline the cross-disorder genetics of mental illness including SZ [8]. Another large-scale imaging-genetic analysis in SZ revealed that imaging impairments in gray matter and fractional amplitude of low-frequency fluctuations are associated with several genetic factors, in which DCC is one of highlighting genes [9].
The biological roles of DCC in the development of the central nervous system have been well explored. DCC is required for axon guidance to Netrin-1 and functional deficiency of it lead to severe impairment of the formation of the commissural system (e.g., corpus callosum and hippocampal commissure) in both animals and human [10, 11]. Gene expression data indicate that DCC expression peaks during early prenatal development and is crucial to early organization of neuronal circuits and the maturation of white matter connections to the prefrontal cortex during adolescence [12]. Conventional DCC or Netrin-1 knockout mice die shortly after birth, which hinder exploring its role in the adult brain. Our previous study has revealed that DCC expression in cortical neurons is involved in radial migration [13], and several other reports have revealed its role in the organization of dopaminergic mesocorticolimbic pathway [14, 15]. In addition, DCC expression by neurons can regulate synaptic plasticity in mature neurons [16].
In the present study, we integrated the largest and latest GWAS data from Psychiatric Genomics Consortium (PGC) [3] and the gene expression data of human prefrontal cortex (PFC) from PsychENCODE to analyze the statistical link between DCC and the risk of SZ. Mechanistically, we revealed that deletion of DCC in layer VI but not layer V neurons led to impairment of multiple memories and sensorimotor gating function, reduction of dendritic spine density of cortical neurons, and alteration of delta oscillation. Notably, we found an elevation of AKT-GSK3 pathway, and administration of GSK3 inhibitor was able to restore sensorimotor gating ability in DCC CKO mice with selective inactivation of DCC in layer VI.
2 MATERIALS AND METHODS
2.1 SZ GWAS data
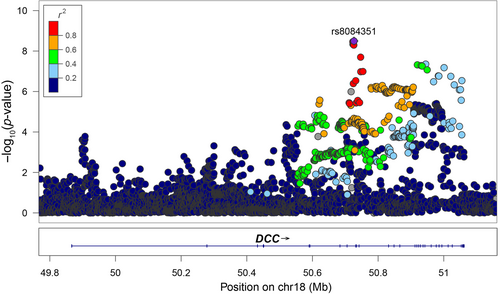
We extracted SNPs across the DCC gene region ±50 kb from SZ GWAS, which was published by Psychiatric Genomics Consortium (PGC) in 2022. The schizophrenia working group of PGC meta-analyzed a total of 74,776 SZ or schizoaffective disorder cases and 101,023 controls, and identified 263 distinct genomic loci significantly associated with the illness. We downloaded the primary summary statistics data from PGC website (http://pgc.unc.edu/for-researchers/download-results/). Detailed information about the sample characteristics and genotyping methods can be found in the original publication [3]. The regional association results of DCC SNPs were plotted using LocusZoom (http://csg.sph.umich.edu/locuszoom/) [17]. p-value <5.00 × 10⁻⁸ was set as the genome-wide significance.
2.2 Differential expression analyses of DCC between SZ cases and controls
Using RNA-seq data in the PsychENCODE dataset, we examined the mRNA expression of DCC in the postmortem frontal and temporal cortex tissues of 559 SZ patients and 936 controls. As described previously [18], genes with transcripts per million reads (TPM) >0.1 in at least 25% of samples were included in the differential expression analyses, during which linear regressions were performed through covarying known biological, technical, and four surrogate variables as fixed effects and subject-level technical replicates as random effects. p-value <0.05 is considered to be nominally significant. Detailed information on tissue collection, RNA-seq, gene expression quantification, and differential expression analyses were shown in the original study [18].
2.3 Animals
The DCC-targeted embryonic stem cells with exon 4 floxed were used to generate DCC-floxed mice in the National Research Center for Mutant Mice of China (Nanjing, China). To selectively delete DCC in layer VI excitatory neurons, we mated Ntsr1-Cre mice (MMRRC, 030648-UCD) [19] with DCCflox/flox mice to obtain DCCNtsr1 CKO mice (Ntsr1-Cre; DCCflox/flox). Mice with other genotypes from the same nest (i.e., DCCflox/flox, DCCflox/+, and Ntsr1-Cre) showing no detectable changes (see below) were used as control mice. Similarly, RBP4-Cre mice (MMRRC, 030648-UCD) [20] were crossed with DCCflox/flox mice to generate DCCRBP4 CKO (RBP4-Cre; DCCflox/flox) for inactivation of DCC in layer V excitatory neurons. Male mice were included in behavioral observation, while sex was not controlled in the other sets of experiments. Mice were housed in specific pathogen free facility with a 12 h light/dark cycle and free access to food and water. All the protocols in this study were reviewed and approved by the Animal Experimental Ethics Committee of Shanghai Medical School, Fudan University, China.
2.4 Genotyping
Genomic DNA was extracted from mouse tail tips for genotyping. The DNA was amplified by an initial denaturation at 95°C for 5 min, followed by 30 cycles of denaturation at 94°C for 30 s, primer binding at 60°C for 30 s and elongation at 72°C for 45 s, and then incubation at 72°C for 5 min. The primer sequences used for genotyping were: DCC-F (5′-TATTTCACTAATGGCGAAG-3′), DCC-R (5′-TTAAAGGGTTGTATTAGTCA-3′). Depending on the gene sequence, the band size of homozygous mutant and wild type was 425 and 305 bp, respectively.
2.5 Western blot
Western blot was performed as described previously [21]. Briefly, cortical tissues were homogenized in RIPA lysis buffer containing a protease inhibitor cocktail (Thermo Scientific). Equal amounts of boiled proteins were separated by SDS-PAGE, transferred to nitrocellulose membranes, and blotted with primary antibodies. The following primary antibodies were used: rabbit anti-GAPDH (1:2000, Epizyme), rabbit anti-AKT (1:1000, CST), rabbit anti-p-AKT (1:1000, CST), rabbit anti-GSK3α (1:1000, CST), rabbit anti-p-GSK3α (1:1000, CST), rabbit anti-GSK3β (1:1000, CST), rabbit anti-p-GSK3β (1:1000, CST), and goat anti-DCC (1:200, Santa Cruz).
2.6 Behavioral tests
All behavioral tests were recorded with cameras and analyzed by the person who was blind to the information of tested mice.
2.6.1 Open filed test
Mice were placed in the center of the open field (Med Associates, New York, USA), which was a black square arena (45 × 45 × 30 cm) with a camera above it. They were allowed to explore freely for 5 min. Total distance traveled in the field was recorded to indicate locomotor activity.
2.6.2 Rotarod test
In the training phase, mice were first habituated to the rod (Kuoyun, Shanghai, China) for 2 min while the rod rotated slowly (10 rpm-rotations per min). Then they were trained to move on the rod with speed progressively increasing from 4 to 40 rpm within 5 min for two sessions. There was a 1-h interval between sessions. During this phase, they were taken back on the rod if they fell off. Next day, in the test phase, 3 sessions were carried out to evaluate the average performance of total time on the rod. During this phase, mice were placed on the rod and left there for 5 min or until they fell off.
2.6.3 Novel object recognition test
In the training phase, mice were first habituated to the empty field (25 × 25 × 25 cm) (Omnitech, Columbus Ohio, USA) for 3 consecutive days (5 min per day). On day 4, two identical objects were placed on the diagonal of the area, and the mice were allowed to explore freely for 10 min. One hour later, one of the objects was randomly replaced with a new and different object, and record the duration when mice explored the new and familiar objects, respectively, during the 10-min test phase. It was considered as exploring the object when a mouse touched an object with its front paw or nose tip. Discrimination index was calculated using the following formula: discrimination index = (duration exploring the new object − duration exploring the familiar object)/(duration exploring the new object + duration exploring the familiar object).
2.6.4 Elevated plus maze test
The elevated plus maze was a cross-shaped device, consisting of two open arms (30 × 5 cm) and two closed arms (30 × 5 × 16 cm), with a height of 40 cm from the ground. Mice were placed in the center of the maze, facing the open arm, and allowed to explore freely for 5 min. The percentage of duration and frequency in closed arms were calculated using the following formula: the percentage of duration in the closed arms % = (duration entering closed arms/total duration entering closed and open arms) × 100; the percentage of frequency in closed arms % = (frequency entering closed arms/total frequency entering closed and open arms) × 100.
2.6.5 Dark–light transition test
The dark–light transition test was widely used to detect the anxiety-like behavior of mice. The device was a plexiglass box (45 × 20 × 20 cm). It was divided into a relatively small dark box area with a cover (accounting for 1/3 of the area) and a large light box area without a cover (accounting for 2/3 of the area), with an open square door (5 cm) in the middle connected. A camera was installed above the light box area for tracking and recording. Mice were put back against the door into the light area and allowed to explore freely for 5 min. The duration in the light box was counted and compared for each mouse.
2.6.6 Morris water maze
The water maze (Kuoyun, Shanghai, China) was composed of a cylindrical pool with a diameter of 120 cm and a height of 40 cm. During the training stage, mice were allowed to explore the hidden platform freely for 1 min with 4 rounds per day. Four quadrants were randomly arranged in different order for each round over 7 consecutive days. If mice failed to find the platform within 1 min, they were picked up and placed on the platform for 20 s. The average time taken for each mouse to find the platform was calculated. On day 8, the hidden platform was removed and each mouse was allowed to swimming freely for 1 min to search for the location of the platform in the maze, with the starting point farthest from its previous position. The movement of mice was recorded and analyzed by Noldus software (EthoVision XT 8.0, Noldus Technology).
2.6.7 Contextual fear conditioning test
The device (Actimetrics, Illinois, USA) was composed of a shock box with an iron fence at the bottom. The camera and software (Freeze Frame, Coulbourn Instruments) provided by the system could record the immobility time of the mouse. Mice were put in the shock box and received five foot-shocks (1.0 mA, 2 s) with intervals of 2 min. Freezing behaviors were measured as the percentage of immobility time every 2 min during the process. Then the contextual fear behaviors were retrieved on day 1, 3 and 7 by placing the mice in the original shock box for 11 min without any shock. The percentage of immobility time of mice in this process was counted and compared.
2.6.8 Three-chamber social test
The test was conducted as previously described [22]. In the first trial, only two empty wire mesh cylinders were given. In the second sociability trial, one mouse (S1) and one object (O, ping-pang ball) were placed into two wire cylinders in side chambers. In the third social novelty trial, the familiar mouse (S1) and another untouched mouse (S2) were provided in the two wire cylinders in side chambers. A camera was installed above the social device for tracking and recording. The mouse touching the wire mesh cylinder was considered to explore it. The duration of exploring object and mouse was counted and compared.
2.6.9 PPI test
Mice were put in the chamber to adapt to the device for 5 min. Then they were given 12 times of startle pulse tone stimulation (100 dB, 20 ms) followed by 48 tests in which the startle tone was presented alone or after 3 different prepulse stimuli (65, 72 and 83 dB, 20 ms) with a delay of 100 ms in a randomized order. The average interval between each test unit was 30 s (20–40 s randomly set). The formula for calculating the inhibition percentage of prepulse stimulation with different intensities is: PPI = (1 − prepulse stimulation response/startle pulse stimulation response) × 100. In addition, the PPI test after drug intervention was carried out half an hour after intraperitoneal administration.
2.7 Nissl staining, AuCl3 staining, and immunofluorescence staining
Nissl staining, AuCl3 staining and immunofluorescence staining were performed as described previously [23, 24]. Mice were euthanized via isoflurane and perfused with 0.01 M phosphate buffered saline (PBS) and 4% paraformaldehyde (PFA). Then brain tissues were extracted and submersed in PFA overnight, followed by 2-day immersion with 30% sucrose in 0.01 M PBS. Processed brains were sectioned on a cryostat. For Nissl staining, slices were stained with 0.1% crystal violet. In the AuCl3 staining, 0.2% gold chloride in phosphate buffer was used. For Immunofluorescence staining, primary antibodies used were: rabbit anti-Satb2 (Abcam, 1:100), rabbit anti-CDP (Santa Cruz, 1:300), Rat anti-Ctip2 (Abcam, 1:300) and mouse anti-TLE4 (Santa cruz, 1:300).
2.8 Golgi staining and dendritic spine counting
Golgi staining to detect dendritic spine was performed using a commercial kit (FD Rapid Golgi Stain Kit), according to the manufacturer's instructions. Spine counts were determined on 150 μm coronal brain slices taken by a microscope (Precipoint M8) and merged by Adobe Photoshop (Adobe System Incorporated). At least 12 neurons in layer VI from each mouse were selected to count the density of the secondary or tertiary branches of them. The length of the branches was not less than 100 μm.
2.9 Drug treatment
Olanzapine (MedChem Express) was diluted to 0.1 mg/mL with sterile saline and mice were intraperitoneally injected with diluted olanzapine at a dosage of 0.001 mg/g body weight [25]. SB216763 (Tocris) was dissolved in DMSO and mice were intraperitoneally injected with diluted SB216763 at a dosage of 10 mg/kg body weight. PPI tests were performed 30 min after the drug administrations.
2.10 Electrophysiological recording
Mice were anaesthetized and fixed in the stereotaxic apparatus with isoflurane (RWD). Eight-channel electrodes were implanted at the PFC of mice (coordinates: 1.7 mm anterior from bregma, 1.5 mm lateral from midline, 1.9 mm below pia). On the 8th day, local field potential (LFP) from the PFC in freely-moved mice were recorded (APPOLO II, Yige Biological Company). Data was analyzed with MatLab (Mathworks, MA). The pWelch formula was used to estimate the power spectral density (PSD) of the 200-s artifact free fragments of each sample. The segment length of Hamming-window was 5000 data points, and the overlap was 2500 data points. The power spectrum was integrated in the following frequency bands to analyze: δ1 (0.5–2 Hz), δ2 (2–4 Hz), θ (4–8 Hz), α (8–13 Hz), β (13–30 Hz), and γ (30–100 Hz).
2.11 Statistical analysis
Data were shown as mean ± standard error of the mean (SEM). Statistical analysis was performed using IBM SPSS Statistical 20.0 and GraphPad Prism 9.0. Values with 2 standard deviations away from the mean were identified to be outliers and were removed from our dataset [26]. The number of samples represented biological replicates and was indicated in the figure legends.
3 RESULTS
3.1 DCC is a risk factor of SZ based on GWAS and differential expression database
We examined the associations of SNPs covering the DCC gene region ±50 kb with risk of SZ in the PGC3 GWAS (74,776 cases and 101,023 controls). A total of 4403 SNPs were included, and a noncoding SNP rs8084351 in the intron of DCC exhibited the strongest association (p = 3.18 × 10⁻⁹, Figure 1). The other 10 SNPs in moderate to high linkage disequilibrium also showed genome-wide significant associations with SZ.
In addition to obtaining genetic evidence, we also attempted to explore the alterations of DCC mRNA expression in SZ cases compared to healthy controls. A recent RNA-seq based transcriptomic study [18] conducted by PsychENCODE Consortium has analyzed the differentially expressed genes in the postmortem frontal and temporal cortices from 559 SZ patients and 936 controls. Notably, mRNA expression of DCC was lower in the SZ cases compared with controls. The differential expressed mRNA was defined by a log2-transformed fold change (log2FC) = −0.04 and a p value <0.05. FC (fold change) represented the ratio of the expression levels between normal samples and SZ samples. And the logarithm to the base 2 is log2FC. The result supported the idea that decreased expression of DCC in the cortex might serve as a risk factor of SZ.
3.2 Generation of DCC CKO mice
The exon 4 of the DCC gene was flanked by two LoxP sites with knockout-first strategy to generate DCC CKO mice (Figure 1A). Two amplification PCR bands (305 bp and 425 bp in size) were detected in DCCflox/+ mice. In contrast, only the 305-bp band was amplified in wild-type mice, and only the 425-bp band was amplified in DCCflox/flox mice (Figure 1B). The deletion of DCC was also confirmed at protein level from cortical tissue of DCCNtsr1 CKO mice (Figure 1C) and DCCRBP4 CKO mice (see below). Our ongoing project showed that the deletion of the exon 4 led to a loss of function of DCC on the basis of data from Nestin-Cre-mediated DCC deletion in the brain, such as agenesis of the corpus callosum and defective dorsal hippocampal commissure.
3.3 DCCNtsr1 CKO mice show defective fear and spatial memories, and impaired sensorimotor gating
Corical layers V and VI have dense connections with subcortical regions including the thalamus and striatum, and participates in multiple cognitive functions. To explore if DCC in these regions is involved in brain functions, we first carried out a battery of behavioral tests in DCCNtsr1 CKO mice with selective deletion of DCC in layer VI. We evaluated the body weight and found no significant difference between DCCNtsr1 CKO mice and control at adult stage (Figure 2A). The open field test showed that DCCNtsr1 CKO mice exhibited comparable traveled distance with control mice (Figure 2B), showing spontaneous locomotion is not affected in the absence of DCC in layer VI. In addition, no significant differences were found in the rotarod test (Figure 2C), novel object recognition (Figure 2D), dark–light transition test (Figure 2E), elevated plus test (Figure 2F,G) or three-chamber social test (Figure 2H,I). Collectively, there were no obvious alterations in body weight, locomotor activity, basal anxiety, or social performance in DCCNtsr1 CKO mice.
We then assessed Morris water maze (MWM) and contextual fear conditioning test (CFC) to examine the ability of learning and memory in DCCNtsr1 CKO mice. In the learning phase of MWM, DCCNtsr1 CKO mice displayed a comparable latency in finding the platform relative to control (Figure 2A). However, during the retrieval phase, DCCNtsr1 CKO mice showed lower frequencies in crossing the platform and the target zone with no difference in traveled distance and velocity compared with control mice (Figure 2B–F), indicating the retrieval of spatial memory is impaired in CKO mice. During the fear conditioning test, DCCNtsr1 CKO mice exhibited no difference compared with control in the freezing time (Figure 2G). However, the freezing behaviors were significantly decreased in DCCNtsr1 CKO mice on day 1 with no difference on day 3 and day 7 after the conditioning compared with controls (Figure 2H). Taken together, our data suggested that contextual fear and spatial memories are impaired in the absence of DCC in layer VI.
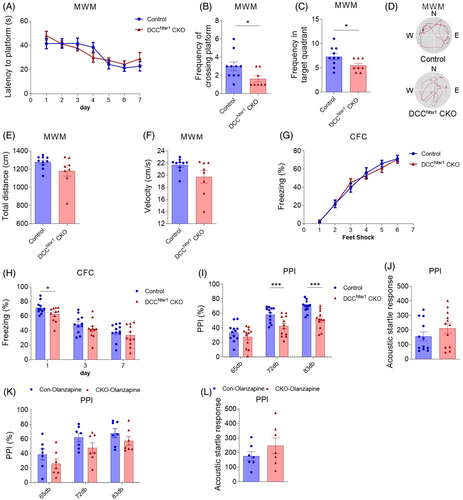
Impaired PPI ability in the startle reflex is widely present in SZ patients as well as in animal models [27, 28]. We thus explored whether the performance of PPI is disturbed in DCCNtsr1 CKO mice. There were significant reductions in PPI scores at the 72 and 83 dB prepulse levels in DCCNtsr1 CKO mice compared with control mice (Figure 2I). Noteworthy, these changes were not because of hearing deficits as the acoustic startle response was comparable between the two groups (Figure 2J). We further performed antipsychotic administration to verify this impaired PPI as an SZ-like behavior. DCCNtsr1 CKO mice indeed showed a significant improvement of PPI at 72 and 83 dB to comparable levels with control mice after olanzapine treatment (Figure 2K,L). Thus, these data indicated that deletion of DCC in layer VI can lead to SZ-like behaviors in mice which can be attenuated with olanzapine treatment.
3.4 DCCNtsr1 CKO mice remain normal cellular architecture but have decreased spine density of layer VI neurons
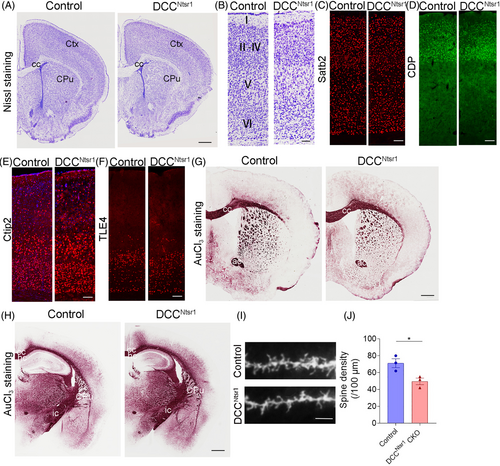
Conventional DCC knockout mice exhibit developmental defects in the commissural system including the corpus callosum, hippocampal commissure and spinal cord commissure [29]. Based on this, we explored whether the axonal fibers and the cortical lamination were altered in DCCNtsr1 CKO mice by Nissl staining and layer-specific molecular markers, Satb2 for layers II–VI, CDP for layers II–IV, Ctip2 mainly for layer V, and TLE4 for layer VI [21]. Nissl staining showed that DCCNtsr1 CKO mice had normal cellular architecture in the cortex compared with control mice (Figure 3A,B), and there were no obvious difference in the expressions of the layer-specific makers between the two genotypes (Figure 3C–F). Similarly, the axonal tracts including the corpus callosum, hippocampal commissure and anterior commissure were maintained intact relative to control mice (Figure 3G,H). Considering the role of DCC in the establishment of synaptic connectivity and the alterations in dendritic spine in SZ [30], Golgi staining was conducted to evaluate the spine density of cortical neurons in layer VI. Indeed, we observed a reduced spine density in DCCNtsr1 CKO mice (Figure 3I,J). Taken together, normal cortical architecture but reduced spine density of pyramidal neurons was observed in DCCNtsr1 CKO mice, consistent with the characteristics of pathological changes in the cortex of SZ patients.
3.5 Elevated GSK-3 activity is responsible for impaired PPI of DCCNtsr1 CKO mice
The disturbed PPI in DCCNtsr1 CKO mice promoted us to explore the molecular mechanisms underlying the behavioral alterations. It has been reported that aberrant AKT-GSK3 pathway is implicated in the pathogenesis of SZ [31], and we performed western blot to examine whether it is changed in the cortex of DCCNtsr1 CKO mice. There were no significant differences in the total levels of AKT, GSK3α or GSK3β between DCCNtsr1 CKO and control mice, whereas the levels of p-AKT (Ser473), p-GSK3α (Ser9), and p-GSK3β (Ser21) were significantly reduced in the cortex of CKO mice (Figure 4A,B), indicating an elevated activity of AKT-GSK3 pathway in DCCNtsr1 CKO mice.
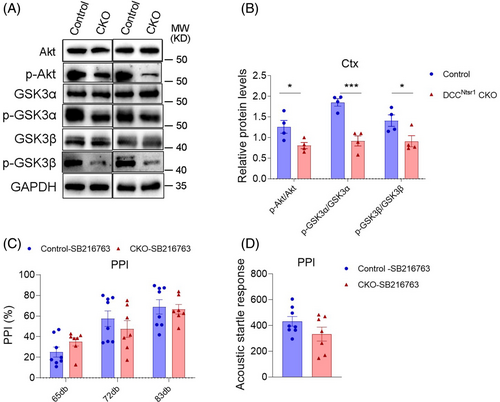
To examine whether the upregulation of AKT-GSK3 pathway is involved in defective sensorimotor gating, SB216763 (a selective inhibitor of GSK3) was administered in control and DCCNtsr1 CKO mice. The PPI responses were observed 30 min after drug treatment, and the result showed that SB216763 restored the reaction at the 72 and 83 dB of DCCNtsr1 CKO mice to the levels of control mice (Figure 4C). Notably, the acoustic startle response itself were not altered in both control and CKO mice treated with SB216763 (Figure 4D). These data suggested the elevated GSK3 activity might be responsible for the aberrant sensorimotor gating in DCCNtsr1 CKO mice.
3.6 DCCNtsr1 CKO mice show disturbed delta activity in PFC
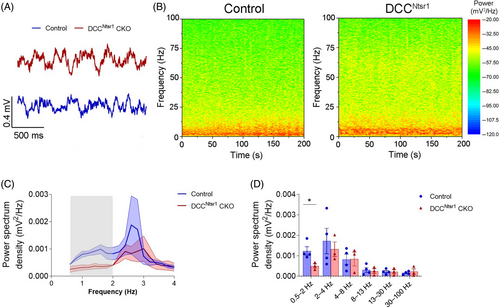
To capture the characteristic of electrical activity in the deficiency of DCC in layer VI, we recorded the local field potential (LFP) in the PFC of freely-moving control and DCCNtsr1 CKO mice. In control mice, the LFP was characterized by a predominant delta-band oscillation within 0.5–4 Hz range (Figure 5A,B). To quantify signal power distribution within the delta band, power densities were separately calculated at low (0.5–2 Hz) and high (2–4 Hz) delta bands. The peak frequency of delta oscillation control mice showed was about 2.5 Hz frequency, while DCCNtsr1 CKO shifted their power peak to about 3 Hz frequency (Figure 5C). Noted that DCCNtsr1 CKO mice decreased the total power density at low-frequency delta spectrum (0.5–2 Hz) (Figure 5D). The disturbed delta activity in the PFC may contribute to abnormal behaviors observed in DCCNtsr1 CKO.
3.7 Intact cortical architecture and unchanged behaviors in DCCRBP4 CKO mice
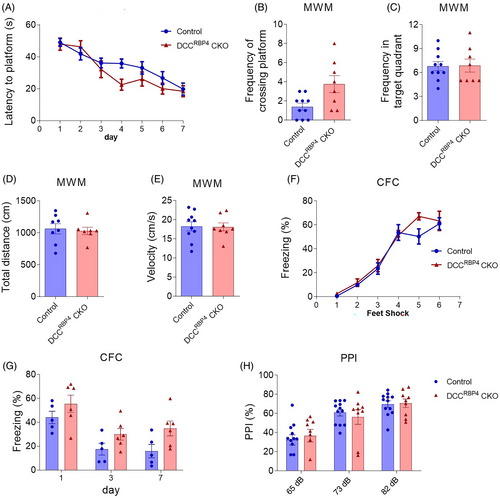
Having found abnormal behaviors in DCCNtsr1 CKO mice with selective deletion of DCC in layer VI pyramidal neurons, we next sought to explore what happens when DCC is inactivated in layer V neurons. DCCRBP4 CKO mice were generated (Figure 3A), and morphological examination of the cerebral cortex by Nissl staining and expression of the layer-specific genes showed that layered architecture is not changed in DCCRBP4 CKO mice (Figure 3B–G). Like DCCNtsr1 CKO mice, there was no difference in the body weight, locomotor activity revealed by the open field test and rotarod test, anxiety-like behaviors revealed by the light–dark transition and elevated plus maze test, short memory revealed by novel object recognition test, and social performance shown by three chamber social test between control and DCCRBP4 CKO mice (Figure 4A–I). However, with contrast to the observations in DCCNtsr1 CKO mice, DCCRBP4 CKO and control mice displayed similar performance in the Morris water maze, contextual fear memory test and PPI test (Figure 6A–H). Taken together, DCC deletion in layer V neurons did not cause disturbed behaviors as it did in layer VI.
4 DISCUSSION
Previous study predicts SNPs of DCC associated with eight psychiatric disorders including SZ with high confidence but did not elucidate how the expression of DCC changes in those disorders [7]. Here, we focused on the association between DCC and SZ by integrating GWAS with expression data and revealed notable association between decreased DCC level in cortex and increased risk of SZ, strongly suggesting that DCC is a genetic risky factor of SZ. Furthermore, to investigate the underlying molecular and neural basis of DCC in the pathogenesis of SZ, we selectively deleted DCC in the cerebral cortex, a key region for SZ, and the CKO mice survived postnatally with no apparent abnormality in the morphology of corpus callosum. We showed that DCC deficiency in layer VI but not layer V leads to the impairments of spatial and fear memory, and deficiency of sensorimotor gating. In addition, the elevation of GSK3 signaling activity is observed, and deficient PPI responses are restored by the administration of the GSK3 inhibitor in DCCNtsr1 CKO mice with selective deletion of DCC in layer VI. Finally, the reduction of dendritic spines of layer VI neurons and alterations of delta-oscillation are also observed in DCCNtsr1 CKO mice. Thus, in addition to point out the change of DCC expression in the cortex of SZ patients, our results provide biological evidence for understanding the in vivo function of DCC in the cortex, and when defective, can cause deleterious effects to the brain and precipitate SZ-like behaviors in mice.
Converging evidence suggests that the AKT-GSK3 signaling plays an important role in the development of SZ [32]. It is accepted that the elevated AKT-GSK3 signaling leads to the structural organization of dendritic spines and functional alteration of neural circuits [33, 34]. Moreover, chronic or acute administration of antipsychotics activates AKT activity and concomitantly inhibits GSK3β activity via increased phosphorylation [35, 36]. In addition, it has also been reported that dysregulation of AKT-GSK3 signaling is associated with cognitive impairments in SZ [37], and hyperactivity of GSK3 enhances the sensitivity to the overactive effect of amphetamine [38]. In line with these studies, we observed elevated GSK3 signaling (reduced protein levels of p-AKT and p-GSK3α/β) and reduced number of dendritic spines in DCCNtsr1 CKO mice. Remarkedly, deficient PPI ability is restored by the administration of GSK3 inhibitor SB216763. DCC interacts with multiple intracellular proteins such as Disabled 1, Myosin X and Src family kinases [13, 39, 40], some of which may be involved in the regulation of AKT-GSK3 signaling activity as well as spine dynamics. It is also likely that DCC may regulate AKT-GSK3 pathway directly. Further studies are needed to explore the molecular mechanism underlying the involvement of DCC in regulating activity of AKT-GSK3 pathway and formation and/or remodeling of dendritic spines.
Unlike DCCNtsr1 CKO mice with DCC deletion in layer VI, the inactivation of DCC in layer V pyramidal neurons does not affect the behavioral performance of DCCRBP4 mice. It might be because of the fact that pyramidal neurons in layers V and VI belong to distinct projections and are therefore involved in different neural circuits and brain functions [41]. For example, the layer V pyramidal neurons are implicated in voluntary motor control via sending axons to the brain stem and spinal cord, and in intracortical communication via sending axons within the ipsilateral cortex [42]. However, layer VI pyramidal neurons are one of the major inputs to the thalamus being the key component of reciprocal connections between the thalamus and cortex [43]. Considering the role of Netrin-1/DCC in axonal pathfinding in brain development and synaptic transmission in mature neurons [16, 44], it is likely that functions of neural circuits from the cortex to the thalamus are affected in the absence of DCC, which might contribute to the abnormal behaviors in DCCNtsr1 CKO mice.
In summary, our data showed that inactivation of DCC in layer VI but not layer V leads to impairment of spatial and fear memory, and deficient PPI ability. The elevated activity of AKT-GSK3 signaling and reduced spine density of pyramidal neurons may underlie the abnormal behaviors. Thus, our data support the idea that DCC is an essential risky gene in the pathogenesis of SZ.
AUTHOR CONTRIBUTIONS
Y-QD and LH designed the research. J-YC and Y-QH generated the mice. Y-QH, W-TL, Z-BH, and Y-CT carried out the experiment and analyzed the data. Y-QD, Z-BH, and Y-QH wrote parts of the manuscript. YW, QZ, and ML contributed to data interpretation and provided feedback on the manuscript. All authors approved the manuscript prior to submission. The authors report no biomedical financial disclosures or potential conflicts of interest.
FUNDING INFORMATION
This work was supported by the National Natural Science Foundation of China (32271072), STI2030-Major Projects (2022ZD0204900), Shanghai Municipal Science and Technology Program (19490714300), Shanghai Sailing Program of the Shanghai Municipal Science and Technology Program (23YF1407500), Collaborative Innovation Program of Shanghai Municipal Health Commission (2020CXJQ01), Shanghai Municipal Science and Technology Major Project (2018SHZDZX01).
CONFLICT OF INTEREST STATEMENT
The authors declare no conflicts of interest.
Open Research
DATA AVAILABILITY STATEMENT
The data used to support the findings of this study are available from the corresponding author upon request.


