RNA-sequencing of paired tape-strips and skin biopsies in atopic dermatitis reveals key differences
Abstract
Background
Skin tape-strips and biopsies are widely used methods for investigating the skin in atopic dermatitis (AD). Biopsies are more commonly used but can cause scarring and pain, whereas tape-strips are noninvasive but sample less tissue. The study evaluated the performance of skin tape-strips and biopsies for studying AD.
Methods
Whole-transcriptome RNA-sequencing was performed on paired tape-strips and biopsies collected from lesional and non-lesional skin from AD patients (n = 7) and non-AD controls (n = 5). RNA yield, mapping efficiency, and differentially expressed genes (DEGs) for the two methods (tape-strip/biopsy) and presence of AD (AD/non-AD) were compared.
Results
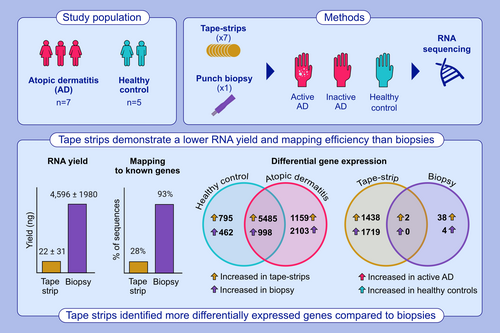
Tape-strips demonstrated a lower RNA yield (22 vs. 4596 ng) and mapping efficiency to known genes (28% vs. 93%) than biopsies. Gene-expression profiles of paired tape-strips and biopsies demonstrated a medium correlation (R2 = 0.431). Tape-strips and biopsies demonstrated systematic differences in measured expression levels of 6483 genes across both AD and non-AD samples. Tape-strips preferentially detected many itch (CCL3/CCL4/OSM) and immune-response (CXCL8/IL4/IL5/IL22) genes as well as markers of epidermal dendritic cells (CD1a/CD207), while certain cytokines (IL18/IL37), skin-barrier genes (KRT2/FLG2), and dermal fibroblasts markers (COL1A/COL3A) were preferentially detected by biopsies. Tape-strips identified more DEGs between AD and non-AD (3157 DEGs) then biopsies (44 DEGs). Tape-strips also detected higher levels of bacterial mRNA than biopsies.
Conclusions
This study concludes that tape-strips and biopsies each demonstrate respective advantages for measuring gene-expression changes in AD. Thus, the specific skin layers and genes of interest should be considered before selecting either method.
Graphical Abstract
Tape strips yielded a lower yield of RNA and fewer sequences mapping to known genes than biopsies. Paired sampling from the same skin (AD or no AD) identified differential detection of thousands of genes between tape strips and biopsies. Tape strips performed better than biopsies for identifying differentially expressed genes in AD.
1 INTRODUCTION
Atopic dermatitis (AD) is a common, inflammatory skin disease characterized by recurring, itchy, erythematous skin lesions. AD often develops during infancy, but is also common in 2%–5% of adults.1, 2 The specific mechanism of AD is unknown, but likely involves a combination of skin-barrier dysfunction,3 immune dysregulation,4 as well as dysbiosis of the skin microbiome.5 Molecular studies utilizing RNA-sequencing (RNA-seq) have yielded useful insights into the pathomechanism of AD6-15 and contributed to the development of novel therapeutics, such as Janus kinase and IL4Ra inhibitors.16, 17 Studies utilizing RNA-seq to study AD typically rely on single skin biopsies from adult patients, likely due to the invasiveness of the procedure. For similar reasons, few studies investigate biopsies collected from children.12, 13
Tape-strips offer a simple, noninvasive method for skin sampling in infants, adults, and children.11, 18-47 The tape-strip method involves applying an adhesive strip to the skin surface, which is then removed to capture cells from the superficial layers of the skin and associated proteins, lipids, microbes, and other molecules. Multiple tape-strips can be used to capture deeper skin layers, but tape-strips generally do not reach deeper than the stratum corneum.48, 49 Studies have performed targeted measurements of mRNA expression18-20, 24, 26, 27, 30, 50 and protein levels27, 33, 34, 41, 43, 44, 51 from tape-strips. More recently, RNA-seq studies demonstrated that tape-strips can detect transcriptomic changes associated with AD.22, 29, 45, 46, 52 Few studies perform direct, quantitative comparisons between tape-strips and skin biopsies to evaluate biases or advantages between the respective methods.45, 46, 52
Here, we performed whole-transcriptome RNA-seq on paired tape-strips and skin biopsies from patients with and without AD to assess the abilities of each method for detecting differentially expressed genes associated with AD. We tested whether RNA-seq data from tape-strips resembles data from biopsies, as well as examined potential systematic biases. Finally, we assessed whether differential gene expression between AD and non-AD samples identified similar genes when performed with each method independently. We report that, despite lower data quality, tape-strips demonstrate utility in RNA-seq studies of AD.
2 METHODS
2.1 Study approval
The study was conducted in accordance with the Declaration of Helsinki and approved by the Scientific Ethical Committee of the Danish Capital region (H-18008874) and the local data protection agency (ID-no:VD-2018-325, I-suite-nr:6573).
2.2 Study participants and inclusion
This study included 12 adult participants (7 with dermatologist-diagnosed AD and 5 control subjects with no history of AD). All AD patients were part of a larger study involving filaggrin (FLG) gene mutations. All AD patients and one non-AD control had a FLG mutation. Study participants were enrolled and examined between March and May 2019. AD patients were recruited from the Department of Dermatology and Allergy, Gentofte Hospital, Denmark. AD patients were eligible if they were 18–69 years old, diagnosed with AD according to the Hanifin–Rajka criteria,53 had AD for at least 3 years, carried a FLG mutation (R501X, 2282del4, or R2447X), had no history of other inflammatory diseases, and had not received systemic immunotherapy within 4 weeks prior to examination. Non-AD controls were recruited from an online webpage for study participants,54 and were eligible if they were 18–69 years old, had no history of very dry skin, no history of AD/eczema/atopic diseases, no family history of atopy, no inflammatory diseases, and no treatment with systemic immunotherapy within 4 weeks prior to examination. Informed consent was obtained from all participants.
2.3 Study visit and sample collection
All participants attended one hospital visit, which included an interview, skin examination by a dermatologist, and sample collection. Overall AD severity was assessed using the Eczema Area and Severity Index (EASI).55 Site-specific AD severity was assessed using the target lesion severity score (TLSS).56
Eight tape-strips (diameter = 22 mm; Cuderm, USA) and one skin biopsy (diameter = 3 mm) were collected from the dorsal aspect of the hand, directly adjacent to the tape-stripped location. Each tape-strip was applied on the skin and standardized pressure (225 g/cm2) was applied for 10 s using a D-Squame pressure application pen before removal of the tape-strip and application of a new tape-strip on the exact same location. The tapes were placed in a sterile, nuclease-free tubes and stored at −80°C. The sixth tape-strip was sent for protein measurement and not included in the RNA-seq analysis. For the skin biopsy, the sample area was cleaned with an antiseptic solution and local anesthesia (lidocaine-10 mg and epinephrine-5 μg) was injected. The skin biopsy was placed in a nuclease-free tube and stored at −20°C. A blood sample was collected to test for FLG gene mutation.
2.4 RNA extraction, library preparation, and sequencing
RNA was purified from tape-strips and biopsies by phenol/chloroform extraction with Trizol® reagent followed by isopropanol precipitation. Detailed methods can be found in Data S1. Briefly, for biopsies, RNA was extracted by placing the biopsy in a bead beading tube containing Trizol® and homogenizing the sample with a MagNA lyzer instrument (Roche, Germany). For tapes, each tape-strip was vortexed in a tube containing Trizol®. The Trizol® was then removed and placed into a new tube containing the next consecutive tape-strip for a total of seven tapes. Chloroform was then added and the samples were shaken by hand and centrifuged to create a phase separation. The aqueous phase was collected and total RNA was precipitated using isopropanol, cleaned with ethanol, and eluted in nuclease-free water. Concentration and purity were assessed with a NanoDrop spectrophotometer (Thermo Fisher Scientific, USA). Ribosomal RNA depletion was then performed with the riboPOOLs rRNA depletion kit (siTOOLS Biotech, Germany) using a 100:1 combination of the Human_riboPOOL-RP3 to Pan-Pro_riboPOOL-RP3. Depleted RNA was collected and treated with RQ1 RNAse-free DNAse (Promega, USA) and purified with a Clean & Concentrate-5 RNA kit (Zymo Research, USA). Library preparation was performed with the NEB Ultra II RNA directional library prep kit. Quality and molarity of the final libraries were assessed with an Agilent 2100 Bioanalyzer using a High-Sensitivity DNA chip (Agilent Technologies, USA) and a Qubit fluorometer (Invitrogen, USA). Samples were pooled in equimolar concentrations and sequenced on an Illumina NovaSeq6000 instrument (S4 flow-cell, 150PE).
2.5 Processing of raw sequencing data, bioinformatic analysis, and statistics
Raw sequencing data was demultiplexed with bcl2fastq v2.0 (Illumina, USA). Processing of raw sequencing data was performed with an in-house pipeline.57 Briefly, samples sequenced across multiple sequencing lanes of the same flow cell were concatenated. Reads were then trimmed with cutadapt v3.4 to remove sequencing adapters.58 Reads less than 30 nucleotides in length were filtered. The trimmed and filtered reads were then aligned to the human reference genome (GRCh38 primary assembly, Ensembl release 107) using bwa-mem v0.7.17 with default settings.59 Read pairs mapping to known gene features were counted with featureCounts from the subRead v2.0.3 package with–fracOverlap 0.2.60 Kraken2 v2.1.2 was also applied to the concatenated sequencing files to quantify bacterial reads using the full, standard RefSeq index.61 Reads classified as Homo sapiens were counted as host reads, while reads mapping to the kingdom Bacteria at any taxonomic level were counted as bacterial reads.
Genes not present with at least 10 counts in 5 samples were excluded. The difference in number of genes with detectable expression above a given expression threshold was calculated for each tape-strip and biopsy in a pair and tested with a paired Wilcoxon. This was repeated for incremental increases in the threshold cutoff from 10 to 200. The remaining analysis was performed on vst-normalized (DEseq2) count matrix unless otherwise specified.62 Between-sample similarities were calculated with euclidean distance. Variance partitioning was performed with the variancePartition package in R. Differential gene-expression was performed with DESeq2 on the filtered, un-normalized count matrix. Differentially expressed genes (DEGs) were identified as those with an absolute log2FoldChange >1 and an adjusted p < .05. p-values were adjusted for multiple testing when appropriate.
3 RESULTS
This study included seven AD patients (mean age: 46 ± 19; 86% female) and five non-AD controls (mean age: 31 ± 8; 60% female) (Table 1, Table S1). Five of seven AD patients had active AD at the sampling location with a mean TLSS score of 8 ± 4. Five AD patients and one non-AD control were heterozygous carriers of a FLG gene mutation. Two AD patients were homozygous for a FLG mutation. RNA seq libraries were successfully generated from all samples.
| Atopic Dermatitis | ||
|---|---|---|
| Characteristic | No, N = 5a | Yes, N = 7a |
| Age (years) | 31 (± 8) | 46 (± 19) |
| Sex | ||
| Female | 3 (60%) | 6 (86%) |
| Male | 2 (40%) | 1 (14%) |
| BMI | 21.6 (± 5.0) | 26.8 (± 5.4) |
| Fillagrin Gene Mutation | ||
| No | 4 (80%) | 0 (0%) |
| Homozygous | 0 (0%) | 2 (29%) |
| Heterozygous | 1 (20%) | 5 (71%) |
| Eczema (Dorsal Hand) | ||
| No | 5 (100%) | 2 (29%) |
| Yes | 0 (0%) | 5 (71%) |
| Eczema Area and Severity Index (EASI) | NA | 9 (± 7) |
| Total Lesion Severity Score (TLSS) (Dorsal Hand) | NA | 8 (± 4) |
- a Mean (± SD) for Age, BMI, EASI, TLSS; n(%) for Fillagrin Gene Mutation, Eczema on dorsal hand.
3.1 Tape-strips had lower RNA yields and fewer sequences mapping to known genes
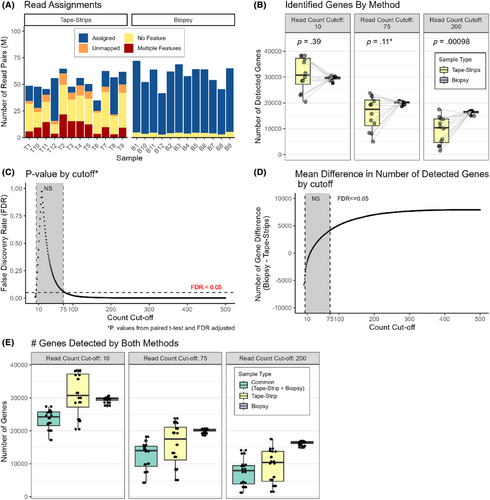
Tape-strips demonstrated a lower yield of RNA and lower mapping efficiency than biopsies for all samples. RNA extraction isolated a mean of 4596 ± 1980 ng and 22 ± 31 ng total RNA from skin biopsies and tape-strips, respectively. RNA-seq generated a mean of 51.18 M ± 8.03 and 50.99 M ± 8.57 paired-end reads for the biopsies and tape-strips, respectively. Tape-strips demonstrated fewer reads (~28%) assigned to gene-level features than biopsies (~93%), despite achieving similar sequencing depths (Figure 1A). Tape-strips also showed more reads mapping to unannotated gene features. Descriptive statistics for the sequencing data are displayed in Table 2 and Table S2.
| Sample Type | n | Total Sequences (M) | Total Sequences SD | Mapped-Known Genes (M) | Mapped-Unknown/Unannotated Regions (M) | Percent Assigned (%) |
|---|---|---|---|---|---|---|
| Biopsy | 12 | 51.18 | 8.03 | 55.13 | 3.93 | 92.97 |
| Tape-strips | 12 | 50.99 | 8.57 | 14.59 | 22.25 | 27.64 |
3.2 Tape-strips and skin biopsies detect similar genes
To compare the ability of the tape-strips and biopsies to describe the transcriptome, we first compared the total number of genes detected and their expression level between each matched tape-strip and skin biopsy pair (Tables S1 and S3). There was no significant difference in the number of genes observed between the methods in each pair. However, biopsies detected significantly more moderately (>75 observed sequences) and highly (>200 observed sequences) expressed genes (Figure 1B,C). The mean difference (± SD) in the number of genes between methods was −1580 ± 6547 genes, 4176 ± 6645 genes, and 7025 ± 5636 genes for cutoffs of 10, 75, and 200 observed sequences, respectively (Figure 1D). Here, a positive value represents more genes found with skin biopsies. An average of 23,419 ± 3005 genes were detected by both methods in each pair (Figure 1E).
3.3 Tape-strips show higher inter-sample variability and medium correlation to skin biopsies
To examine whether tape-strips and skin biopsies describe similar gene expression profiles, we compared profiles for each pair of tape-strip and skin biopsies, across all AD and non-AD samples. We observed a medium correlation between gene-expression profiles from tape-strips and skin biopsies (median R2 = 0.431 ± 0.20, Pearson correlation). Hierarchical clustering identified that gene-expression profiles clustered by sample method rather than subject or AD status (Figure 2A).
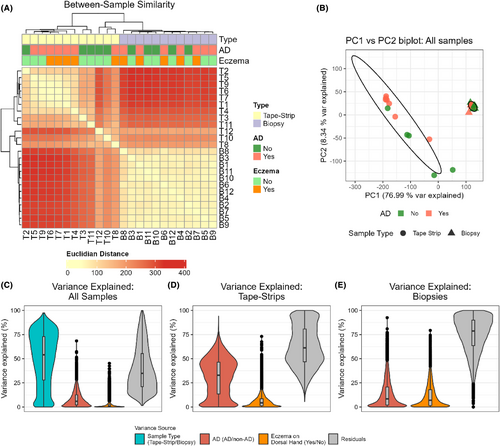
Principal component analysis (PCA) also demonstrated a clear separation between expression profiles from tapes and biopsies across the main principal component (PC1), which described 75% of the observed variability (Figure 2B, S1). Interestingly, three tape-strip samples (T8, T10, T12) showed markedly higher correlations with biopsies and clustered closer to biopsies by PCA and hierarchical clustering. Sampling method described the majority of the gene-level variability (Figure 2C). Though tape-strips showed a higher between-sample variability than biopsies (Figure 2B), they explained more gene-level variability associated with AD (Figure 2D,E).
3.4 Tape-strips and biopsies uniquely detect certain, AD-specific genes
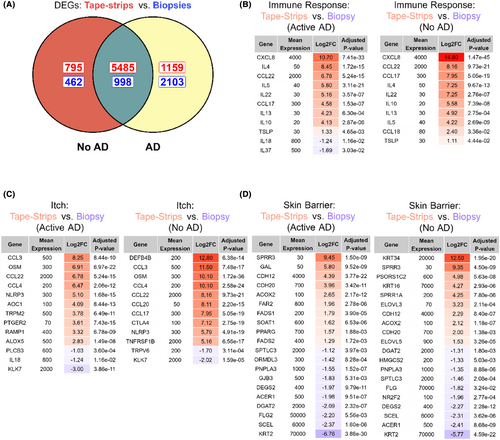
To identify potential “global” biases between methods, we performed differential gene expression between tape-strips and skin biopsies. We identified a total of 9745 DEGs in AD samples and 7740 DEGs in non-AD samples, whose expression level depended on sampling method (Tables S4 and S5). The majority of these DEGs (n = 6483) were identified in both AD and non-AD samples (Figure 3A). We then examined whether these DEGs were associated with itch, immune response, or skin barrier, based on gene lists from a previous study.52 The majority of genes associated with immune response or itch showed higher expression in tape-strips (Figure 3B,C). This included DEGs associated with a type-2 inflammatory response, including several interleukins (IL4/IL5/IL10/IL13) and T-cell differentiation factors (CD28/CTLA4/IRF4). Several other chemokines (CCL3/CCL4/CCL17/CCL18/CCL20/CCL28/CXCL8) also demonstrated increased expression in tape-strips. Contrarily, a few itch and immune genes (IL18/IL37/KLK7/CCL27) showed higher expression in biopsies. Skin barrier genes were generally detected by either tape-strips or biopsies and depended on the condition (active AD or non-AD) (Figure 3D). The most highly-expressed genes from tape-strips taken from AD patients with active AD were associated to fatty acid catabolism or metabolism (ACOX2/FASD1/FASD2/FADS1/FADS2/FAR2/PPARG/SOAT1) (Table S4). Cadherins (CD12/CD20) showed higher expression in tapes for both conditions. Interestingly, certain keratins were differentially identified-KRT34 and KRT16 were highly expressed in tape-strips, while KRT2 was highly expressed in biopsies. Filaggrin (FLG2) showed increased expression in biopsies from AD patients with active AD, but was not differentially detected in control subjects. Furthermore, the methods showed preferential detection of immune cell types (Table S6). Tapes captured gene markers from epidermal cell types, such as epidermal dendritic cells (CD1a/CD207), while biopsies captured signals from dermal fibroblasts (COL1A/COL3A).
3.5 Tape-strips identify more differentially expressed genes between AD and control skin than biopsies
To compare the utility of tape-strips with biopsies for studying AD skin, we used each method to perform differential gene-expression analysis between active AD and non-AD skin. Tape-strips identified 3157 DEGs, where 1438 showed increased expression in active AD and 1719 showed increased expression in non-AD (Table S7). Comparatively, skin biopsies identified 44 DEGs, where 40 showed increased expression in active AD (Figure 4A) and 4 showed increased expression in non-AD (Table S8). Tape-strips identified increased expression of IL5, HDC, TAC1, and AOC1 in active AD, which have roles in immune response and itch. However, the majority of the significant DEGs in active AD were not of clear relevance and were expressed at low levels. The most significant DEGs identified by tape-strips in non-AD controls included keratins (KRT33AB/34/85/31) and S100As (S100A3). Contrarily, biopsies identified several S100As (S100A7/S100A8/S100A9) and defensins (DEFB4A/DEFB4B), with increased expression in active AD (Figure 4B).
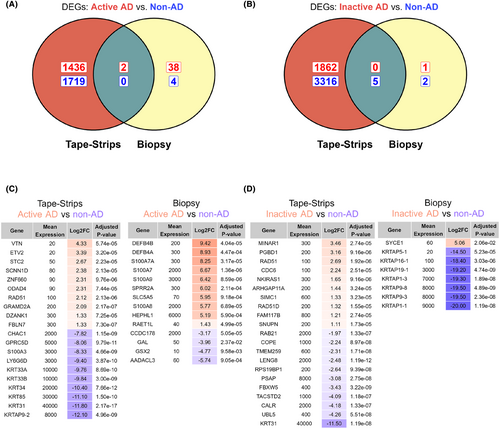
This analysis was repeated to compare inactive AD skin with non-AD controls. Interestingly, tape-strips identified more DEGs in this comparison than between active AD and non-AD controls (Figure 4C). Between inactive AD and control skin, tape-strips identified 5183 DEGs, where 1862 showed increased expression in active AD and 3321 showed increased expression in non-AD controls (Table S9). Comparatively, biopsies identified only 8 DEGs (Table S10). Biopsies identified several keratin-associated genes with increased enrichment in control skin (Figure 4D). The most significant DEG identified by tape-strips was KRT31, with high expression in non-AD skin. Other cytokines (IL5/IL33/CCL3/CXCL8), S100As (S100A6), and keratins (KRT2/KRT6A/KRT34/KRT16) were also differentially expressed in tapes between inactive AD and non-AD controls. In both cases (active AD vs control and inactive AD vs control), 2420 genes were detected as differentially expressed with tape-strips in both comparisons.
3.6 Analysis of bacterial reads in biopsy and tape-strips
Further, we compared the ability of tape-strips and biopsies to detect bacterial mRNA. Tape-strips identified an average of 4.15 ± 8.8% more bacterial reads than biopsies (p = .13097, paired t-test) (Figure 5).
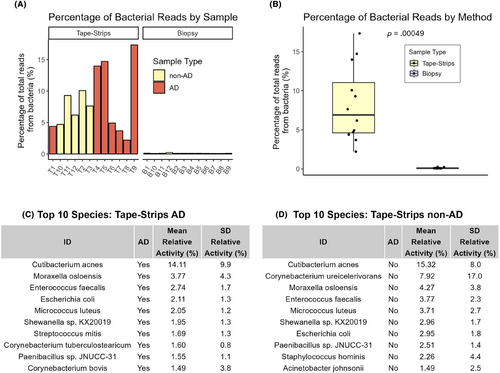
Both methods identified clinically relevant AD bacterial species, but biopsies showed a high level of Bacillus cereus contamination across all samples. We did not identify any bacterial species that were significantly differentially abundant between AD and non-AD samples with either tapes or biopsies. We observe that tape-strips demonstrated an increased number of reads aligning to S. aureus and several tape-strips from AD samples showed elevated, but not significant (p < .05, Wilcoxon rank-sum test), levels of S. aureus compared to non-AD samples (Figure S2).
4 DISCUSSION
Here, we present an in-depth comparison of skin tape-strips and biopsies for examining transcriptomic changes associated with AD. We identify systematic effects of sampling method (skin tape-strips or biopsies) on gene-expression levels measured by RNA-seq. We also demonstrate that tape-strips detected more differentially expressed AD genes than skin biopsies. This study overcomes limitations of previous studies by implementing a non-targeted RNA-seq approach, including a detailed assessment of data quality, assessing systematic biases, and including paired analyses of active AD, inactive AD, and non-AD controls.
We identified over 6000 DEGs due to method across both AD and non-AD samples—a similar magnitude as observed by Sølberg et al.46 Tape-strips better captured genes associated with immune response and itch, including several signals of type-2 inflammation (CCL2/IL4/IL5), genes associated with pathogen response (CCL17/CXCL8/DEFB4B), and itch (OSM/CCL3/CCL22). This highlights a multi-faceted activation of both the innate and immune response detected by tape strips, which agrees with Del Duca et al.52 We note these findings were not exclusive to AD skin and we also found increased signals of these genes in samples with no AD. Interestingly, tape-strips and biopsies each identify certain subset of skin-barrier genes and cell types. For example, both this study and Del Duca et al. detect signals from dermal fibroblasts with biopsies (COL1A/COL3A), while markers of epidermal dendritic cells (CD1a/CD207) are increased in tape-strips.52, 63, 64 These effects, as suggested by previous studies, are likely due to the different skin layers collected by each method. Tape-strips only collect cells from the upper epidermal skin layers,40, 49 while skin biopsies collect both epidermal and dermal layers. As hypothesized previously,52 the increased detection of immune, itch, and skin-barrier genes likely is due to a “dilution” of these signals in the biopsies, which contain a more diverse range of cell types.
An important application of tape-strip sampling is noninvasive sampling from different skin conditions, such as to compare AD with non-AD. Our study identifies that tape-strips find more DEGs associated with AD than biopsies. Del Duca et al. and Solberg et al. who observe similar difference in the number of DEGs between the methods.22, 52 Dyjack et al.,45 in comparison, identified fewer DEGs between non-lesional AD and non-AD controls. A few DEGs associated with itch and immune response were identified by tape-strips (IL5/HDC/TAC1), but the majority of the top DEGs showed low expression in tape-strips and were not of clear relevance to AD. Genes identified with low expression levels may be more highly influenced by normalization, thus genes with high fold-changes but low expression values should be interpreted with caution. Biopsies gave a much stronger AD signal, with defensins (DEFB4A/B) and S100A7/9 being the top DEGs, highlighting an activation of inflammatory and antibacterial pathways. The observation that tape-strips identify many more DEGs than skin biopsies between AD and non-AD by our study as well as and Del Duca et al.52 is novel, but should be considered carefully. In our data, tape-strips demonstrated a large between-sample variability and the top DEGs (VTN, ETV2, STC2, etc.) were not clearly relevant for AD. This is highlighted in Figure 2B, where a subset of tape-strip samples from non-AD controls clustered closer to skin biopsies. It is unclear whether this effect is biological or technical and characterization is required to elucidate these effects.
Assessment of data quality is an essential step when interpreting data from RNA-seq, but not consistently reported. RNA-yields from tape-strips in this study were significantly lower than skin biopsies, consistent with previous reports.23, 29, 47, 63 We also identify that RNA-seq data generated from tape-strips yielded a high proportion (~50%) of sequences aligning to genomic regions with no annotated genes. A similar effect was also identified by Sølberg et al., who identified a high proportion of intronic sequences16 in tape-strip data and attribute this effect to biological factors, such as intron retention. However, we observe a high level of sequences mapping to unannotated regions at the gene level (i.e., not intronic). We hypothesize that this effect is due to DNA contamination, as small fragments of DNA may still exist after DNAse treatment.65 Nonetheless, this result highlights that tape-strips need to be sequenced more deeply than skin biopsies to obtain similar depths, which may be a financial limitation for some studies. Standardized and effective methodologies for RNA extraction should be developed to alleviate these burdens.
There are several limitations in this study. First, participants were not age-matched and the mean age of the AD group was higher than the non-AD group. This likely increased variance and reduced statistical power in comparisons between AD and non-AD. The AD group was also heterogeneous and two participants did not have a lesion in the sampled area. Non-lesional control samples were also not available from subjects with active AD, thus the effect could not be investigated. There was also a high variability in RNA yield and quality of sequencing data obtained from tape-strips and non-AD samples had more RNA extracted and better quality sequencing data than AD. Thus, it is difficult to determine whether DEGs identified in tape-strips between AD and non-AD are due to physiological changes or methodological biases. Regarding detection of bacteria, the sampling area for biopsies was disinfected prior to sampling, which may affect the detection of bacterial transcription. Lastly, we hypothesized that DNA contamination plays a role in background signal for tape-strips, but DNA concentration measurements were not available.
5 CONCLUSIONS
This study provides evidence supporting tape-stripping as an adequate method for performing RNA-seq analysis of AD and non-AD skin. Tape-strips clearly identified more differentially expressed genes between AD and non-AD skin than paired skin biopsies. However, extraction of RNA was more difficult and the quality of obtained RNA-seq data was lower for tape-strips than skin biopsies. Tape-strips and skin biopsies also demonstrate systematic differences in their gene expression profiles, likely due to the skin layers sampled. Thus, researchers should carefully consider the skin layer of interest as well as feasibility when implementing tape-strips for RNA-seq analysis of AD.
AUTHOR CONTRIBUTIONS
BF, TB, and JT conceived the study. AH, MC, AR, CO, MK, CZ, SH contributed to clinical collection of patient samples and data. BF processed the samples and generated RNA-seq data. BF and IC performed all statistical and bioinformatic analyses. BF, AH, IC, AR, CZ, SH, JT, TB contributed to design of the analysis and interpreting results. BF drafted the initial manuscript. All coauthors contributed to drafting and reviewing later versions of the manuscript.
ACKNOWLEDGEMENTS
Funding for this work was provided by the Novo Nordisk Foundation (Grant: 0054390) and the Aage Bangs Foundation.
CONFLICT OF INTEREST STATEMENT
JT was an advisor for AbbVie, Almirall, Arena Pharmaceuticals, Coloplast, OM Pharma, Aslan Phar-maceuticals, Union Therapeutics, Eli Lilly & Co, LEO Pharma, Pfizer, Regeneron, and Sanofi-Genzyme, a speaker for AbbVie, Almirall, Eli Lilly & Co, LEO Pharma, Pfizer, Regeneron, and Sanofi-Genzyme, and received research grants from Pfizer, Regeneron, and Sanofi-Genzyme. He is currently an employee of LEO Pharma. All other authors have no conflicts of interest to disclose.
Open Research
DATA AVAILABILITY STATEMENT
All data to reproduce the findings in this study is openly available as a Zenodo repository (DOI: 10.5281/zenodo.10792700) or on Github (https://github.com/bgfritz1/RNAseq_TapeStripsVsBiopsy). Additional data is also provided in the Supplementary Materials or upon reasonable request.


