Immunoglobulin free light chains in severe asthma patient: Could they be a new biomarker?
S. Colantuono and S. Del Giacco are the senior authors.
Abstract
Background
Increasing evidence is available about the presence of increased serum concentration of immunoglobulin (Ig) free light chains (FLCs) in both atopic and non-atopic inflammatory diseases, including severe asthma, providing a possible new biomarker of disease.
Methods
We analyzed clinical and laboratory data, including FLCs, obtained from a cohort of 79 asthmatic subjects, clinically classified into different GINA steps. A control group of 40 age-matched healthy donors (HD) was considered. Particularly, HD have been selected according to the absence of monoclonal components (in order to exclude paraproteinemias), were tested for total IgE (that were in the normal ranges) and were negative for aeroallergens specific IgE. Moreover, no abnormality of common inflammatory markers (i.e., erythrocyte sedimentation rate and C-reactive protein) was detectable.
Results
FLC-k levels were significantly increased in the asthmatic population, compared to the control group. Despite the absence of statistically significant differences in FLC-λ levels, the FLC-k/FLC-λ ratio displayed remarkable differences between the two groups. A positive correlation between FLC-κ and FLC-λ levels was found. FLC- λ level displayed a significant negative correlation with the FEV1 value. Moreover, the FLC-κ /FLC- λ ratio was negatively correlated with the SNOT-22 score and a positive correlation was observed between FLCs and Staphylococcus Aureus IgE enterotoxins sensitization.
Conclusions
Our findings confirmed the role of FLCs in asthma as a potential biomarker in an inflammatory disease characterized by different endotypes and phenotypes. In particular, FLC-κ and FLC-k/FLC-λ ratio could be a qualitative indicator for asthma, while FLC-λ levels could be a quantitative indicator for clinical severity parameters.
Graphical Abstract
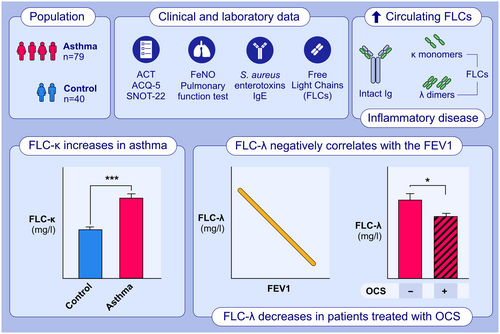
This study aimed to describe clinical and laboratory.characteristics of a population of patients with asthma and to investigate the potential role of FLCs as quantitative and objective serum biomarkers.FLC-κ levels were significantly increased in the asthmatic population, compared to the control group.FLC-λ levels displayed a significant negative correlation with the FEV1 value and were significantly decreased in patients treated with OCS.Abbreviations: ACT, Asthma Control Test; ACQ-5, Asthma Control Questionnaire 5; FeNo, Fractional Exhaled Nitric Oxide; FEV1; forced expiratory volume in the first second; FLC, free light chain; Ig, immunoglobulin; OCS, oral corticosteroids; SNOT-22, Sino-nasal Outcome Test 22.
Abbreviations
-
- ACT
-
- Asthma Control Test
-
- ACQ-5
-
- Asthma Control Questionnaire 5
-
- FeNo
-
- Fractional Exhaled Nitric Oxide
-
- FEV1
-
- forced expiratory volume in the first second
-
- FLC
-
- free light chain
-
- Ig
-
- immunoglobulin
-
- OCS
-
- oral corticosteroids
-
- SNOT-22
-
- Sino-nasal Outcome Test 22
1 BACKGROUND
Inflammation is an important component of cancers and chronic diseases and many inflammatory mediators have shown to have potential prognostic roles. Healthy individuals produce five classes of immunoglobulins, which consist of two identical heavy chains and two identical light chains. Different conditions are characterized by the overproduction of monoclonal immunoglobulins. In some patients, only light chains are produced. More studies have investigated the role of immunoglobulin free light chains (FLCs), that can trigger mast cell activation in an antigen-specific manner. Increased expression of FLCs has been observed within the stroma of many human cancers including breast, colon, lung, pancreas, kidney and skin. Increased serum concentration of polyclonal FLCs in inflammatory diseases has been correlated with the degree of inflammation.1
The ability of free light chains to activate mast cells and then to become an active part of the pathogenetic mechanisms of chronic inflammatory diseases led to an increase of interest in their clinical use, both as an attractive therapeutic target and as a biochemical marker of disease evolution or remission.2 It has been hypothesized that differences in serum immunoglobulins, FLCs and secretory IgA (sIgA) could exist between subjects with asthma of varying severity and non-asthmatic subjects; moreover, the circulating FLCs levels could correlate with lung function, symptoms and airway inflammation.3
FLCs mediate antigen-specific hypersensitivity responses in the presence of a not yet identified FLCs receptor on mast cells, independently of complement activation. γ-chain associated receptors, such as FcεRI and FcγRIII, are not involved in FLC-triggered mast-cell activation. Redegeld et al. have isolated a mast-cell membrane associated protein that interacts with FLCs.4
Mast cells and neutrophils are fundamental cells in the sensitization and effector phases of chronic inflammatory immune responses in the lung, therefore a possible link between mast cells and FLCs suggest their potential role in the pathophysiology of asthma and might be a novel biomarker involved in the humoral immune response to antigens.4-6
FLCs extend neutrophil lifespan suggesting an effective contribution to chronic neutrophilia associated with chronic obstructive pulmonary disease (COPD). Increased levels of FLCs in serum and lung tissues have been associated with increased blood neutrophil count in COPD patients. FLCs binding to neutrophils induces CXCL8 inflammatory chemotactic mediator, increasing neutrophils recruitment into the airways with enhanced blood neutrophilia in COPD.7, 8
In the mammalian immune system, two isotypes, k and λ, of FLCs are produced. The k/λ ratio significantly varies among species. Serum FLCs levels are elevated in autoimmune diseases as systemic lupus erythematosus, rheumatoid arthritis and Sjögren syndrome and changes in their levels are associated with disease activity.9
Therefore, the presence and the characterization of FLCs in atopic patients could be of interest as they may provide an alternative approach to the treatment.
Recently, Napodano et al.10 compared salivary levels of immunoglobulin A subclasses (IgA1 and IgA2) FLCs in a cohort of 29 SARS-CoV-2 patients and 21 healthy subjects, describing the role of λFLC as an ideal indicator of patient conditions, that effectively could monitor patients’ fluctuation in real-time.
Aim of this study was to describe clinical and laboratory characteristics of a population of asthmatics patients and evaluate the presence and isotypes distribution of FLCs in asthmatic and healthy subjects, aiming to investigate their potential role as quantitative and objective serum biomarkers of this condition. Additionally, the study seeks to evaluate any clinical correlations with different clinical parameters.
2 METHODS
We evaluated clinical and laboratory data, including FLCs, from 79 asthmatic patients of the severe asthma registry-SANI (Severe Asthma Network Italy) belonging to 4–5 GINA steps,11 independently of comorbidities. The FLCs levels were then compared with those of age-matched healthy individuals from the hospital database.
Clinical evaluation, based on patient reported outcomes asthma control questionnaire 5 (ACQ-5) and asthma control test (ACT), was performed. Pulmonary function tests and FeNO have been used to assess airway function and inflammation, respectively. Sino-nasal Outcome Test 22 (SNOT-22) has been used to score upper airway involvement. Sensitization to Staphylococcus aureus enterotoxins was detected by ImmunoCAP (ThermoFisher Scientific/Phadia, Uppsala, Sweden).
2.1 FLCs laboratory testing
The collected samples were centrifuged at 2500 g for 10 min and serum divided in aliquots before being frozen at −80°C and stored until analysis. Samples were thawed only once, keeping them at room temperature and immediately analyzed. The analysis was performed by an operator without knowledge of the clinical history of the patient.
Each sample was tested on the OPTILITE (The Binding Site, Birmingham, UK) analyzers, according to the manufacturer's instructions.
Freelite reference ranges for κ FLCs are 3.3–19.4 mg/L and 5.7–26.3 mg/L for λ FLCs respectively.12
A ratio of κ/λ <0.26 or >1.65 is considered abnormal, according to the manufacturer's recommendations.
2.2 Statistical analysis
Statistical analyses were conducted using the R software package (version 4.1.3 release).13 Data were assessed for normality through visual inspection of the QQ-Plot and further confirmed using the Shapiro–Wilk test (data not shown). As significant deviations from normality were detected for some biomarkers, continuous variables were reported as medians with interquartile ranges (IQR).
Tabular data were generated using the gtsummary R package.14 A heatmap of log-scaled Z-scores was created for all measured serum biomarkers using the R package heatmap,15 following the approach described in.16 Group differences were analyzed using the Wilcoxon rank-sum test, and the results were depicted as superimposed on the boxplot analysis of the data.
Categorical variables were expressed as percentages and/or counts, and group differences were analyzed using chi-squared or Fisher's exact tests.
Data visualization was performed using the ggplot2 package within the R software.
Correlations between variables were assessed using Spearman's correlation coefficients, and the correlations were visually represented using correlation heatmaps generated with the corrplot package implemented in the R software.17 Only significant correlations (α = 0.05) were displayed on the computed correlation maps. All missing values in the paper, either in the clinical or serological parameters can be considered missing at random. No imputation techniques were performed for these values.
3 RESULTS
The aim of the study was to compare demographic and laboratory characteristics, including serum levels of FLCs, in 79 severe asthmatic patients and 40 age-matched controls (Table 1).
| Variable | Asthma, N = 79a | Control, N = 40a | p-valueb |
|---|---|---|---|
| age | 56 (49, 63) | 63 (34, 71) | .4 |
| k | 17 (13, 21) | 10 (8, 13) | <.001 |
| λ | 14.5 (12.4, 16.4) | 15.6 (9.1, 20.4) | >.9 |
| k/λ | 1.21 (1.06, 1.40) | 0.70 (0.61, 0.82) | <.001 |
| k + λ | 31 (26, 37) | 26 (17, 33) | .006 |
| FeNO | 40 (24, 82) | 8 (6, 13) | <.001 |
- a Median (IQR).
- b Wilcoxon rank sum test.
In Figure 1A, a heat-map analysis of FLCs and Fractional Exhaled Nitric Oxide (FeNO) values in the two cohorts of subjects is shown. The heat-map clearly indicates the presence of elevated levels of several parameters in severe asthmatic subjects compared to healthy controls. The data are reported as Z-scores, with each column representing a different patient.
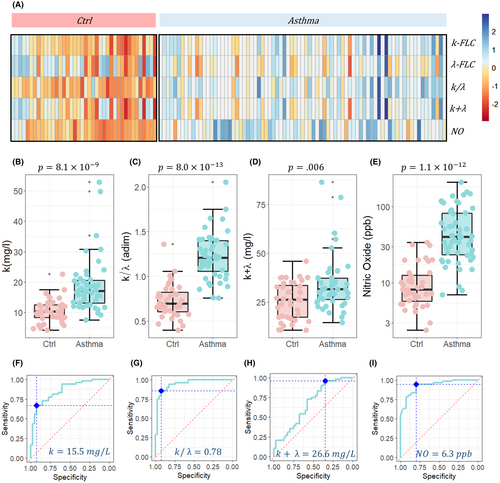
Specifically, significant differences were observed in the FLC-k levels, which were higher in severe asthmatic patients compared to the controls (Figure 1B, p = 8.1e−4). Although there were no statistically significant differences in FLC-λ levels (Figure 1A, p > .9), the FLC-k/FLC-λ ratio displayed remarkable differences between the two groups (Figure 1C, p = 8.0e−13), showing higher significance than FLC-k levels alone and the other investigated markers, namely FLC-k + FLC-λ (Figure 1D, p = .006) and FeNO (Figure 1E, FLC-k/FLC-λ p = 1.1e−12).
Additionally, in Figure 1F–I, the corresponding receiver operating characteristic (ROC) curve analysis of the four significant serum biomarkers is reported: k levels (AUC = 0.86 [0.78–0.94]), FLC-k/FLC-λ (AUC = 0.89 [0.94–0.99]), FLC-k + FLC-λ (AUC = 0.68 [0.56–67]), and FeNO (AUC = 0.92 [0.88–0.98]). For each serum marker, the threshold value at Youden's point was also computed, detecting 15.5 mg/L for k, 0.78 for FLC-k/FLC-λ, 26.6 mg/L for FLC-k + FLC-λ, and 6.3 ppb for FeNO.
To further investigate the behavior of FLC-k/FLC-λ, a linear regression analysis was conducted to explore the relationship between FLC-k and FLC-λ levels.
Figure 2 shows the relationship between FLC-k levels and FLC-λ levels in severe asthmatic patients (represented by cyan dots) and healthy controls (represented by red dots). The data were fitted to a linear trend, and the best regression lines are shown along with their 95% confidence bands. In both cases, the linear regression analysis confirmed a positive correlation between FLC-k and FLC-λ levels.
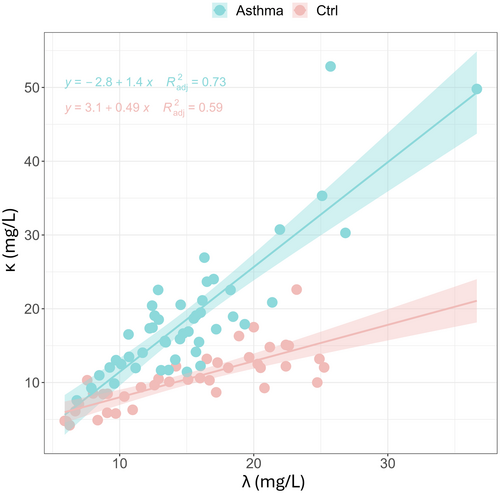
For healthy controls, the increase in FLC-k levels is slower with increasing FLC-λ levels (slope = 0.49 ± 0.065, p = 3.81e−9), compared to severe asthmatic patients where the slope is steeper (slope = 1.42 ± 0.13, p = 6.8e−15). This suggests that the relationship between FLC-k and FLC-λ levels differs between the two groups, with a stronger positive correlation observed in severe asthmatic patients compared to healthy controls.
In summary, the findings from Figures 1 and 2 indicate that FLC-k levels were significantly elevated in the severe asthmatic population, while FLC-λ levels remained relatively consistent between the two groups. The FLC-k/FLC-λ ratio emerged as an effective continuous parameter for distinguishing the two groups, outperforming other investigated markers. This suggests that the FLC-k/FLC-λ ratio may serve as a valuable biomarker in distinguishing severe asthmatic patients from healthy controls.
Aside from distinguishing between the two groups of subjects, our aim is to investigate whether FLCs could serve as a potential biomarker for quantitatively assessing disease severity. Although no severity associations can be made in the absence of an appropriate comparator group of mild asthma patients, correlations with asthma clinical parameters, comprising severity parameters, have been attempted.
The clinical and baseline parameters of the patients are summarized in Table 2. Interestingly, no gender-based differences were observed in the studied parameters (Table S1 and S2).
| Variable | N = 79a |
|---|---|
| Gender | |
| F | 46 (58%) |
| M | 33 (42%) |
| Age (years) | 56 (49, 63) |
| Disease Duration (Years) | 16 (10, 27) |
| Chronic Rhinosinusitis | |
| Without nasal polyps | 7 (8.9%) |
| With nasal polyps | 52 (66%) |
| Absent | 20 (25%) |
| Atopy | 46 (58%) |
| FEV1 (%) | 73 (59, 89) |
| GINA-STEP | |
| 3 | 2 (2.5%) |
| 4 | 9 (11%) |
| 5 | 68 (86%) |
| OCS | 42 (53%) |
| SNOT-22 | 66 (51, 88) |
| Blood Eosinophils | 510 (400, 900) |
| Exacerbations (in 12 months) | |
| 0 | 7 (8.9%) |
| 1 | 8 (10%) |
| 2 | 29 (37%) |
| 3 | 17 (22%) |
| 4 | 9 (11%) |
| 5 | 3 (3.8%) |
| >6 | 6 (6.3%) |
| Hospitalization | 12 (25%) |
| Smoking habits | 30 (38%) |
| m80 | 0.05 (0.01, 0.15) |
| m81 | 0.05 (0.02, 0.38) |
| m223 | 0.12 (0.02, 0.36) |
| m226 | 0.20 (0.06, 0.52) |
- a n (%); Median (IQR).
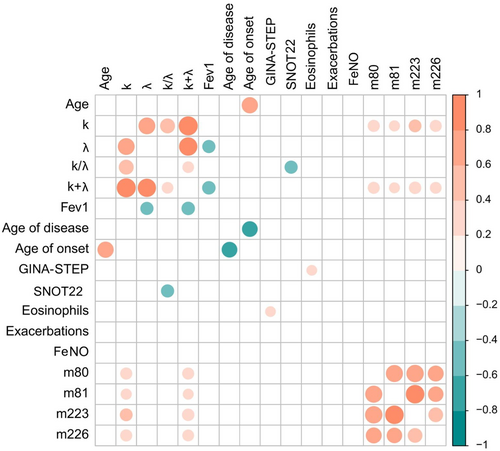
In Figure 3, a correlation matrix of Spearman's correlation coefficients is shown. As expected, FLC-k and FLC-λ were strongly and positively correlated. Consequently, also their linear combinations show positive correlations. Very interestingly, FLC- λ levels, and not FLC-k levels, display a significant and negative correlation with the FEV1 parameter, which provides information on the functional impairment. A moderate positive correlation is observed for FLC-k and FLC-k + FLC-λ and Staphylococcus Aureus enterotoxins IgE TSST-1 (Toxic shock syndrome toxin 1, m223), A (m80), B (m81), and C (m226). In particular, there was a positive correlation with TSST-1 and enterotoxin C. This data confirms the observation recently described in a recent paper by our group, underlying that S. aureus itself could represent a trigger for inflammatory immune response.18 Ultimately, the FLC-k/FLC-λ ratio negatively correlates with the SNOT-22 score. Chronic rhinosinusitis and nasal polyposis represent the most frequent comorbidities in severe asthma patients with a well-known negative impact on outcome, so, this final data is in accordance with the other correlations.
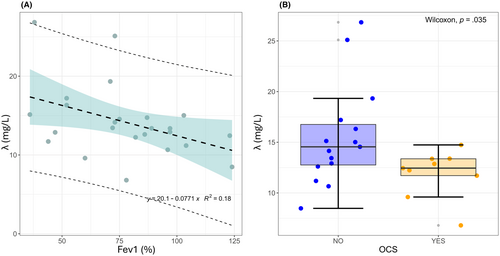
A linear regression analysis of FLC-λ (Figure 4A) as a function of FEV1 was performed, obtaining a significant slope of 1.42 ± 0.13 (p = .027) and an intercept of 28.5 ± 4.8 (p = 1.35e−6), confirming that FLC-λ levels could provide a quantitative indicator of obstruction severity. This hypothesis is further strengthened by the results of Figure 4B, which show a significant decrease in FLC-λ levels in patients treated with systemic corticosteroids.
Generally, FLCs monoclonal polymorphism arises from the proliferation of different plasma cell clones. λ FLCs are released as dimers and κ FLCs as either monomers or dimers in the bloodstream with a half-life of 2–6 h, more precisely of 2–4 h for κ FLCs and 3–6 h for λ FLCs, following a rapid renal clearance.
The different biochemical composition of FLCs could explain the different interactions of k and λ light chains in inflammation as expression of the plasma cell response.19
FLCs induce the activation of mast cells in response to antigenic exposure, and are co-responsible for the clinical symptoms, confirming the hypothesis that polyclonal FLCs could promote the inflammatory phenomenon extension.20
In addition, a close association between polyclonal FLCs (pFLCs) levels and granulocyte mediators was found, further confirming the involvement of FLCs in the allergic inflammatory cascade in different steps. Serum polyclonal FLCs are elevated in patients with severe asthma and could be an interesting surrogate inflammatory marker.
The rearrangement of κ light chains gene precedes the rearrangement of λ light chains. Perhaps in contrast to λ genes, the rearrangement of κ genes takes place normally in almost all peripheral B cells.20 Potential ability to activate FLCs rearrangement in absence/presence of a signal generated by homeostasis alteration of adaptive immune system could increase extents of κ and/or λ locus rearrangements in subjects with severe asthma, contributing to disease severity.
The k-FLCs could be an indication of the inflammatory state because they are synthesized earlier, while the λ-FLCs represent a delayed synthesis that could represent a specific response in more clinically compromised patients.
An alternative explanation for the immune type responses of different FLCs could come from the observation that increased levels of these proteins are detectable in inflammatory conditions. FLCs were significantly increased in nasal secretions of subjects with allergy and non-allergic rhinitis with eosinophilia syndrome (NARES), and in serum of patients with NARES. Non-atopic patients showed significantly increased nasal mast cell tryptase and eosinophil cationic protein. FLC-positive cells were significantly increased in allergic and non-atopic mucosa, and were shown to be mast cells and plasma cells, suggesting a role in nasal hypersensitivity.21, 22
As known, poorly controlled severe asthmatic patients have a significant healthcare burden. Several monoclonal antibodies, targeting type 2 inflammatory pathways have been licensed as add-on therapy so far. During these years, in a precision medicine scenario, various parameters have been studied to evaluate their own usefulness as biomarkers to assess disease severity and eventually predict response to one or other treatment. A cross-sectional study included adults with severe asthma enrolled in ISAR, showed that increased serum immunoglobulin E (IgE), peripheral blood eosinophils and FeNO have been used as biomarkers to suggest corresponding activation of the respective inflammatory pathways and to predict responsiveness to monoclonal biologics.23 FeNO levels increase diagnostic accuracy in asthma and can be used to predict response to ICS as well.
In this scenario, these data suggest that FLCs determination could be helpful, together with the cited biomarkers, to better define patient phenotype among severe asthma patients.
4 CONCLUSIONS
Our goals were to evaluate the role of FLCs in the pathophysiology of severe asthma and to investigate if serum FLCs concentration could reflect systemic inflammation in severe asthma patients. Although FLCs do not have antigen-binding specificity comparable to complete antibodies, they show to play a relevant role in the immune adaptive system and could provide an effective and real-time indicator of patient fluctuations.
Moreover, the presence of polyclonal FLCs could provide an alternative therapeutic approach, suggesting that these bioactive molecules can play important roles in the pathophysiology of asthma, with k chains acting as an inflammatory marker and λ chains subsequently indicating pulmonary function decline and OCS dependance.
The diagnostic performance of the assays used in clinical practice is an important aspect of quality of care and assessing the laboratory tests performs a difficult task introducing new biomarkers having an attractive target in precision medicine to monitor inflammation degree and disease activity.
Given the impact that these results could have in clinical practice, obviously further research will be necessary to confirm them. Interestingly, the usefulness of these biomarkers in contributing to predict the clinical response to therapy have to be addressed.
AUTHOR CONTRIBUTIONS
CC, IB, SC, DF, DB, RI, MC, MS, CC conceptualized the idea and collected clinical data about patients, contributed to write and revise the paper. VB and MM performed laboratory assessments, GC e RDS performed statistical analysis of data. AG, GP, GWC, EH, and SDG critically revised the manuscript. All authors read and approved the final manuscript.
ACKNOWLEDGEMENTS
Thank you to Dr. Umberto Basile and Dr. Cecilia Napodano for the scientific support in performing laboratory assessments. The Data Analysis and visualization unit (Sibioc Lazio) is gratefully acknowledged.
CONFLICT OF INTEREST STATEMENT
The authors declare no conflict of interest for this manuscript.
Open Research
DATA AVAILABILITY STATEMENT
The data that support the findings of this study are available from the corresponding author upon reasonable request.


