A strategy for high-dimensional multivariable analysis classifies childhood asthma phenotypes from genetic, immunological, and environmental factors
Abstract
Background
Associations between childhood asthma phenotypes and genetic, immunological, and environmental factors have been previously established. Yet, strategies to integrate high-dimensional risk factors from multiple distinct data sets, and thereby increase the statistical power of analyses, have been hampered by a preponderance of missing data and lack of methods to accommodate them.
Methods
We assembled questionnaire, diagnostic, genotype, microarray, RT-qPCR, flow cytometry, and cytokine data (referred to as data modalities) to use as input factors for a classifier that could distinguish healthy children, mild-to-moderate allergic asthmatics, and nonallergic asthmatics. Based on data from 260 German children aged 4-14 from our university outpatient clinic, we built a novel multilevel prediction approach for asthma outcome which could deal with a present complex missing data structure.
Results
The optimal learning method was boosting based on all data sets, achieving an area underneath the receiver operating characteristic curve (AUC) for three classes of phenotypes of 0.81 (95%-confidence interval (CI): 0.65-0.94) using leave-one-out cross-validation. Besides improving the AUC, our integrative multilevel learning approach led to tighter CIs than using smaller complete predictor data sets (AUC = 0.82 [0.66-0.94] for boosting). The most important variables for classifying childhood asthma phenotypes comprised novel identified genes, namely PKN2 (protein kinase N2), PTK2 (protein tyrosine kinase 2), and ALPP (alkaline phosphatase, placental).
Conclusion
Our combination of several data modalities using a novel strategy improved classification of childhood asthma phenotypes but requires validation in external populations. The generic approach is applicable to other multilevel data-based risk prediction settings, which typically suffer from incomplete data.
Graphical Abstract
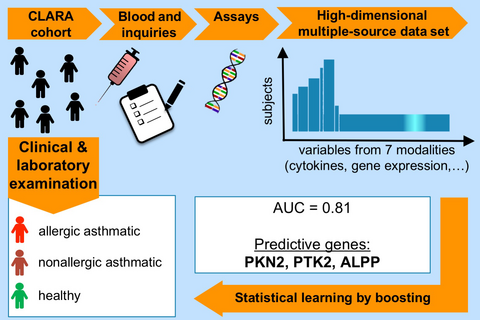
Statistical learning on immunological, genetic, and environmental data classifies asthma well. Risk estimation is most precise when incorporating all given data with the novel multi-modality strategy (area under the receiver operating characteristics curve = 0.81). Best predictors are three target genes of microarray data, comprising novel identified genes protein kinase N2, protein tyrosine kinase 2, and alkaline phosphatase, placental. These show the highest importance for childhood asthma classification. ALPP-alkaline phosphatase, placental; AUC-area under the receiver-operator-characteristics curve; CLARA-clinical asthma research association; PKN2-protein kinase N2; PTK2-protein tyrosine kinase 2; SNP-single nucleotide polymorphism.
1 INTRODUCTION
Asthma, a complex chronic pulmonary disorder, is the most common airway inflammatory disease in children worldwide, with increasing prevalence. It is characterized by bronchial hyperresponsiveness and reversible airway obstruction, causing recurrent episodes of wheezing, cough, shortness of breath, and chest tightness.1, 2 Several subphenotypes of childhood asthma were suggested in various epidemiological studies.3, 4 However, clinical practice and also molecular studies still divide children into two main phenotypes, namely allergic and nonallergic asthma.5, 6 Attempts were made to disentangle distinct underlying pathophysiological mechanisms, but were hampered by the complex nature of the disease.6-9 While singular targets were identified, one could not consistently pinpoint a reliable pattern of relevant pathways critical for asthma phenotype differentiation and in the long-term potentially patient-tailored treatment of the disease. However, this is important as to date, several children with asthma are not well controlled, potentially due to uniform, non-patient-specific therapies with mainly steroids.
Omics data, such as genomics and transcriptomics, have become increasingly available in human cohorts and thus more critical for understanding the pathogenesis of childhood asthma.10 Inherent high dimensionality, incomplete data, and multiple platforms make the analysis of prediction models complex. Reliable analysis strategies for multi-omics data from multiple platforms in large cross-sectional studies are urgently needed to predict the risk of this multifaceted disease. Tools for integration of multiple omics data sets exist in literature11 but are often restricted to analyzing correlation structures rather than building multivariable prediction models. Methods have been proposed to do so, that is, using several modalities for prediction.12 Acharjee et al13 use the machine learning method random forest and preselect significant variables. Zhao et al14 analyze each modality separately and merge the single components. Boulesteix et al15 incorporate each modality via penalized regression estimating weights for each modality. However, successful solutions are not yet available for cases where different modalities are assessed for different individuals. Strategies to build and validate multivariable prediction models incorporating all individuals and all variables simultaneously are needed for classifying asthma in children.
In this study, we propose a novel approach to optimize prediction of childhood asthma phenotypes when different modalities are used as input factors. Prediction in the context of this paper refers to describing and distinguishing childhood asthma phenotypes in terms of classifying them into the corresponding clinical phenotype category rather than predicting the development of asthma. Our data include questionnaire, clinical diagnostic, genotype, expression microarray, quantitative real-time RT-PCR (RT-qPCR), flow cytometry, and cytokine secretion data. Combining multilevel data types by a reliable analysis strategy for large human cohorts will contribute to detailed understanding of childhood asthma, potentially relevant for novel therapeutic strategies. The strategy can also be translated into numerous other complex diseases.
2 METHODS
2.1 Study population
Children between 4 and 15 years from southern Germany were recruited in the University Children′s Hospital Munich from the CLARA/CLAUS (Clinical Asthma Research Association) study6 in three clinical groups, namely healthy children (HC), mild-to-moderate allergic asthmatics (AA), and nonallergic asthmatics (NA). Parents completed a detailed questionnaire assessing health data on allergy, asthma, and socioeconomic factors. Asthmatic patients were diagnosed according to GINA guidelines.16 Inclusion criteria for asthmatics were classical asthma symptoms, including at least three episodes of wheeze and/or a doctor's diagnosis and/or history of asthma medication in the past and lung function indicating significant reversible airflow obstruction according to American Thoracic Society (ATS)/European Respiratory Society (ERS) guidelines.17 Allergy was defined based on a positive specific IgE level in accordance with clinical symptoms. Blood specimen was collected during the children's recruitment and processed identically.
2.2 PBMC isolation, RNA and DNA extraction
Peripheral blood mononuclear cells (PBMCs) were isolated within 24 hours after blood withdrawal, cultured in X-Vivo (48 hours) unstimulated (U), stimulated with plate-bound anti-CD3 (3 μg/mL) plus soluble anti-CD28 (1 μg/mL), lipid A (LpA, 0.1 μg/mL), or peptidoglycan (PGN, 1 mg/mL, OR) at 37°C. Cell pellets were used for RNA isolation utilizing the RNeasy Mini Kit (Qiagen, Hilden, Germany), and supernatants were frozen at −80°C. Genomic DNA was extracted from whole blood (Flexigene DNA-Kit, Qiagen).
2.3 Modalities
We investigated seven data modalities: questionnaire, diagnostic, genotype, microarray, RT-qPCR, flow cytometry, and cytokine data. Diagnostics included weight, height, blood count, immunoglobulins, CrP and IL-6 as well as FeNo.
2.4 Genotyping
Extracted DNA was genotyped for 101 loci using matrix-assisted laser desorption/ionization time-of-flight-mass spectrometry (Sequenom, Inc., San Diego, CA). Deviations from Hardy-Weinberg equilibrium were assessed for quality control of genotyping procedures. Loci were selected based on known biological relevance and genome-wide association study results.18
2.5 Microarrays
RNA of PBMC from a subgroup (14AA/8NA/14HC), comparable to the whole population, was analyzed by Affymetrix-GeneChip®Human-Gene 1.0 ST-arrays. Quality of scanned arrays was checked by MvA, density, RNA degradation plots, using R and Bioconductor.19, 20 Robust multichip averages were used for background correction, normalization, and control of technical variation.
2.6 RT-qPCR, flow cytometry, and cytokines
Isolated RNA was processed (1 μg) with reverse transcriptase (Qiagen). Gene-specific PCR products were measured by CFX96 TouchTM Real-Time PCR Detection System (Bio-Rad, Munich, Germany) for 40 cycles. Subpopulations of 2.5 × 10⁶ PBMC were counted on a FACSCanto II flow cytometer (Becton Dickinson). Cytokine levels were determined in supernatants of cultured PBMCs with Human Cytokine Multiplex Assay Kit (Bio-Rad) using LUMINEX.
2.7 Computational and statistical analysis
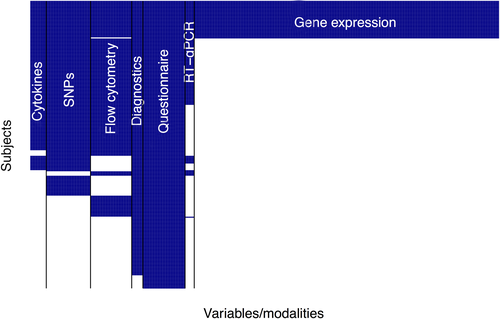
The statistical analyses were performed with R software.19 Details of this section are provided in the article's Supplement. The complex sparse data structure required strategies for handling missing values. Variables containing more than 25% missing values within one modality data set were removed. Remaining missing values were handled via multiple imputation21 (without using any information on the outcome variable) since we assumed missingness at random. This yielded a basic structure of the full data set (Figure 1). We could rule out the possibility that this remaining complex missing data suffered from sample selection bias.6 The intersection data set containing complete observations from all modalities embraced 33 children.
For classification of the three categorical outcome variable with categories AA, NA, and HC, we utilized four state-of-the-art classification algorithms suitable for high-dimensional predictors: the least absolute shrinkage and selection operator (LASSO) and elastic net,22 both representing penalized regression methods (in our case multi-class logistic regression); and random forest23 and (stochastic gradient) boosting,22 both machine learning ensemble methods based on decision trees.
The area under the receiver operating characteristics curve (AUC) was used as metric for comparing prediction accuracy.24 As we compared three outcome categories instead of the standard number two, we obtained an overall AUC by calculating a weighted average over the three one-category-vs-all-categories combinations.24, 25 Prediction models were validated via leave-one-out cross-validation (Figure S1).
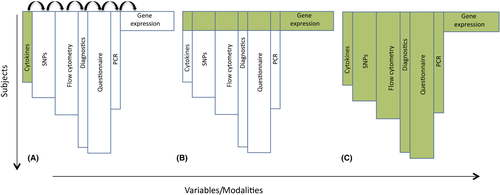
For the complex data structure, we utilized two standard modeling strategies and combined them to a novel one. We compared the resulting three approaches to the four mentioned statistical learning approaches (in short: LASSO, elastic net, random forest, boosting). In Strategy A, each modality was analyzed independently, so that all observations were used but training and validation were possible only modality-wise. Strategy B is a complete case model, that is, we used only complete observations where all seven modalities were measured. Here, all modalities were analyzed at once, but only the completely measured cases were left for analysis. The newly developed Strategy C combined the former two: Classifiers were trained on each modality separately in a first step on a training data set. Applying an inner validation, each modality obtained an optimized weight. The weighted classifiers were combined to a single prediction model, which was evaluated on the complete observations. The three strategies are illustrated in Figure 2.
3 RESULTS
Two hundred and sixty individuals of the CLARA/CLAUS population with well-defined phenotypes (AA/NA/HC) in total were available for the present analyses. AA cases (47%), NA cases (11%), and HC (43%) in the data differed with respect to variables from seven data modalities (Table S4). Full information on all variables was available for 33 children. The most complete modality was the questionnaire with all 260 individuals being measured. The smallest modality data set regarding the number of measured individuals was the microarray data set with 36 observations. The remaining modality data sets, cytokines, flow cytometry, diagnostics, questionnaire, and RT-qPCR contained 148, 172, 162, 248, and 107 observations, respectively (Table S4).
3.1 Prediction modeling
For preventing from severe overoptimistic bias regarding performance of a best model, we report results for all models26, 27:
Strategy A performed prediction on single modalities separately (Figure 2A). On a stand-alone basis, there was no discriminatory power shown for any classifier on flow cytometry (AUC for best classifier boosting 0.54 [0.45-0.64]) and RT-qPCR (AUC for LASSO 0.47 [0.36-0.59], Figure 3A). Here, all CIs crossed the AUC = 0.5 line, indicating that the prediction models did not do better than random guessing. There were moderate performances (mean AUC less than 0.7) for cytokines (boosting 0.60 [0.51-0.70]), SNPs (random forest 0.66 [0.57-0.75]), and diagnostics (LASSO 0.69 [0.61-0.75]). Mean AUCs higher than 0.7 were yielded by modalities environment with an AUC for boosting of 0.75 [0.69-0.82] and microarray with an AUC of 0.74 and a comparatively large confidence interval [0.54-0.90] (Figure 3A).
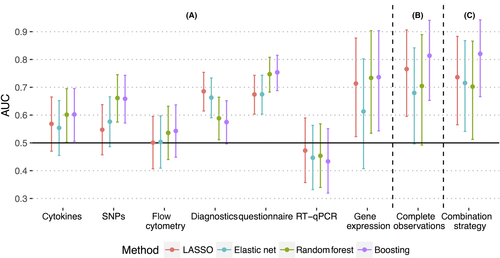
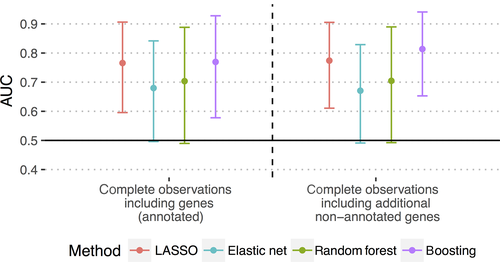
Strategy B considered only observations with values of all modalities given (Figure 2B) and achieved a higher AUC than Strategy A for LASSO (0.77 [0.60-91]) and boosting (0.81 [0.65-0.94], Figure 3B), again with large confidence intervals.
Strategy C combined A and B. Here, as in B, boosting outperformed the other classifiers clearly with an AUC of 0.82 [0.66-0.94] (Figure 3C). Performance did not significantly increase from Strategy B to C. However, the classifiers’ variance for C decreased slightly as shown by the narrower confidence intervals (Table S1).
3.2 Variable importance
Strategy B presents a reasonable trade-off between convenient interpretability and good prediction performance. Hence, we investigated its best prediction model with respect to its most important predictor variables. For meaningful interpretation, we considered annotated genes only for the microarray modality set here.
Figure 4 shows the performance of the refitted modified model, that is, Strategy B with annotated genes only. Boosting, which originally performed best (AUC = 0.81 [0.65-0.94]), predicted slightly worse in the modified version (AUC = 0.77 [0.58-0.93]). Here, LASSO performed similarly to boosting (AUC = 0.77 [0.60-0.91]). Therefore, we analyzed the most important variables of both classifiers. As we based our investigations on variable importance on the two prediction models, we looked in detail at the sensitivities and specificities in terms of ROC curves for these two models (Figure 5); even though the overall AUC was equal in both prediction models, their values differed regarding their one-vs-all comparisons. Generally, the predictive quality was higher for discriminating healthy controls from both kind of asthmatics (Figure 5A) and for discriminating allergic asthmatics from healthy controls and nonallergic asthmatics (Figure 5B) than for discriminating nonallergic asthmatics from healthy controls and allergic asthmatics (Figure 5C) (for boosting: AUC = 0.79 for HC vs all, AUC = 0.78 for AA vs all, AUC = 0.72 for NA vs all).

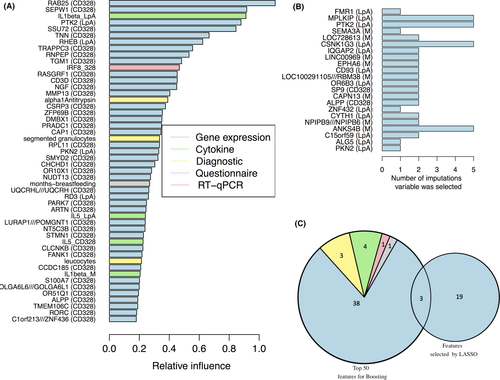
Over all imputations, LASSO selected 22 non-highly correlated variables, which were exclusively genes from the microarray modality (Table S2, Figure 6B). In contrast, boosting used all variables by preferring and ranking them according to their importance without excluding correlated variables. Here, we took those 50 variables into consideration which were ranked highest (Figure S2). The selection contained variables from modalities microarray, cytokines, diagnostics, environment, and RT-qPCR (Table S3, Figure 6A). The two lists overlapped in three variables, illustrated by Figure 6C and Tables S2 and S3, all of them were genes from the microarray modality: PKN2, PTK2, and ALPP. Thus, we considered these as model-independent most important variables for prediction of childhood asthma.
A wider overlap could be determined with more relaxed assumptions (s. details in Table S5 and Figure S3), that is, when variables in the two sets were considered as corresponding to each other when their correlation coefficient exceeded a predefined threshold (Figure S2). Besides breastfeeding, other characteristics considered as potential confounders in a standard analysis (such as age and sex) did not show high variable importance.
4 DISCUSSION
This study contains a novel proposal for prediction analyses of childhood asthma using cytokine, genotype, flow cytometry, diagnostic, questionnaire, RT-PCR, and microarray data simultaneously. Many studies on childhood asthma currently analyze phenotypes based on assessment of singular measurements only.28
Combining several data types has optimized prediction of childhood asthma phenotypes in the CLARA study. The most important variables for prediction of childhood asthma phenotypes comprised novel identified genes, namely PKN2 (protein kinase N2), PTK2 (protein tyrosine kinase 2), and ALPP (alkaline phosphatase placental).
The need for a new strategy arose from the complex data design with seven groups of variables (modalities) of various dimensions on the one hand, and the comparably rare number of complete cases, where observations were given for all modalities, on the other side. The novel strategy incorporated all individuals and all variables simultaneously. The employed classifiers (LASSO, elastic net, random forest, boosting) were capable of handling biomedical data difficulties such as highly correlated and large numbers of variables, possibly exceeding the number of observations, and of filtering important variables from big amounts of noisy variables, which is especially important for the huge amount of predictor variables and the additional heterogeneity in the variables.
4.1 Prediction by seven modalities—best prediction obtained by boosting
The single-modality approach (Strategy A) showed differences in prediction quality for the various modalities and four classifiers. Prediction was unambiguously successful for environment and microarray, partly successful for cytokines, genetics, and diagnostics, and unsuccessful for flow cytometry and RT-qPCR. This is crucial as several studies are analyzed based on singular modalities.
The complete case approach (Strategy B) proved that combining all variables of all modalities to one model is more predictive than using only single modalities.
Both strategies were trade-offs between using all observations per modality and using all modalities simultaneously. Combining both aspects led to the novel combined approach (Strategy C), using the complete data for the training process (Figure 2C) by training a classifier and optimizing a weight via internal model validation for each modality separately in a first step and aggregating all established components in a second step (Figure S1). This strategy tended to decrease the variability of asthma prediction on independent data (Table S1). Thus, including not only all data modalities but also all observations per modality, as Strategy C does, may offer the chance to improve precision in risk estimates for asthma rather than it is possible by using, for example, only clinical or only diagnostic measures, or otherwise using all possible modalities but taking only those observations into account where all values for all these modalities are measured. Even though the decrease in the variability in terms of smaller confidence intervals was small in our data, in further applications, the strategy will generally guarantee at least as good precision as Strategy B, as more information in the data is used. The strategy is especially advantageous when the number of complete cases is substantially smaller than the number of overall individuals in the study. It may even be the only solution when this number is too small for Strategy B.
Boosting showed best performance for both Strategies B and C (Figure 3B/C). This method is convenient for clinical data sets where a multitude of immune-related measurements are available, but missing or small numbers of subjects pose a problem for common analysis strategies.
4.2 Contributional influences—gene expression is most predictive
Prediction on complete cases using annotated genes only was comparable to the original model using also nonannotated genes and yielded high interpretability regarding the most important variables for prediction. We thus repeated prediction by Strategy B on the adjusted selection of genes. Evaluation by two conceptually different methods, the variable selection via LASSO and the relative influence determined by decision trees in the framework of boosting, yielded three model-independent most important variables for prediction: the genes PTK2, PKN2, and ALPP.
PTK2, a member of focal adhesion kinase (FAK), encodes a cytoplasmic protein tyrosine kinase that localizes to focal adhesions and contributes to integrin-mediated cell processes related to cell survival. The activation of this gene regulates a wide variety of cellular responses and is assumed to be important in the early step of cell growth and intracellular signal transduction pathways.29 Although tyrosine kinases play an important role in several pulmonary mechanisms like in airway hyperresponsiveness and airway remodeling, no correlation between PTK2 gene and asthma has been described so far.30 PKN2, also called protein kinase C-related kinase 2 (PRK2), is a Rho target protein which regulates the apical junction formation in human bronchial epithelium. It has been shown critical for human cancer and would represent a novel gene pathway potentially relevant for childhood asthma.31 ALPP is a gene which encodes the placental alkaline phosphatase that catalyzes the hydrolysis of phosphoric acid monoesters and was previously identified to be potentially involved in recurrent spontaneous abortion.32 We acknowledge that the identification of the novel genes PKN2, PTK2, and ALPP is based on a limited number of children and requires confirmation in future cohorts. Although these three genes have not been associated with childhood asthma yet, the findings in this study could be a first hint for future investigations.
Further model-specific variables contributing to prediction were obtained (Tables S2, S3). Contrary to the LASSO model which only labeled genes as most important, boosting found variables also from other modalities. One of them is the number of months of breastfeeding. This may have an influence on asthma, however can be a case of translucent correlation since mothers with family history may be biased in their decisions for breastfeeding. Besides this, selected cytokines such as IL-1β and IL-5, diagnostics variables, and RT-qPCR variables such as IRF8 have been identified as important by boosting (Figure 6A).
In our results, no genotype variables (SNPs) turned out to be important for prediction. This is not surprising as in our and in previous analyses SNPs on a stand-alone basis did not exceed AUC values of around 0.60.18 The low predictive effects of SNPs may be covered by effects from other modalities in our analysis.
4.3 Prediction techniques—using well-established algorithms and all data information
We have used four of the most powerful instruments for prediction in terms of classification from regularization regression methodology to machine learning. In practice, classical approaches as (multivariable) nonpenalized logistic regression can bias parameter estimates and make models instable when variables are highly correlated. Furthermore, there is no maximum-likelihood estimator when the number of variables exceeds the number of observations. Particularly the microarray data set represents both difficulties. Penalized regression, such as LASSO and elastic net, solves these problems: Variable selection generally ensures stability and prevents from overfitting.
Conceptually different but equally sufficient prediction methods are ensembles of decision trees, commonly random forest and boosting, as used here. Both belong to the most popular methods in machine learning and are now used in immune-related analysis. They can handle highly correlated variables and high-dimensional data as well and incorporate interactions between contributing variables. The ensembling principle combines many decision trees at once and thus makes the two methods highly robust.
Applying efficient classification algorithms in combination with running and comparing three modeling strategies complements the methodology of predicting childhood asthma: Multi-omics approaches for childhood asthma have been proposed33 but rather for finding associations than for building multivariable prediction models. Predicting on each modality separately revealed first answers on the predictive power of each modality. However, this ignored the multivariate structure between the modalities and could hence cause an information loss. The obvious solution to only use complete observations with respect to all modalities, again, came at the cost of a lack of information due to a smaller number of observations. Prediction seemed complete and fully efficient only if all variables and all observations were included in the analysis. Our novel approach, combining weighted prediction scores obtained from the full information of each modality, fulfilled this requirement.
The rigorous use of cross-validation performance to select optimal models brings some limitations, though. Single variables found to be relevant for prediction have no P-values attached. Although there are concepts to derive them empirically, their validity is doubtful in the context of statistical modeling with intense variable selection. The different prevalence of phenotypes affected the ability of the model to discriminate between HC, AA, and NA. The smallest group, NA, could not be identified satisfactorily in the presented three-class prediction model, and further efforts are needed to improve this behavior. As another consequence of small sample sizes, we focused on the assessment of main clinical phentoypes and suggest in-depth analysis of additional subgroups such as distinct wheeze and asthma phenotypes in larger studies.
For predicting asthma from seven modalities from genetics, immunology, and environment, we applied robust classification algorithms in concordance with strategies for fully exploiting all information of the data. Penalized regression methods complemented with machine learning approaches have not been used in this context so far and should be considered as efficient prediction methods for this kind of application and beyond. Prediction analysis on incomplete data with respect to different modalities is feasible with certain strategies. We developed a novel strategy combining all information from the data leading to smaller prediction variability. However, the sufficient performance of the complete case prediction model suggests focusing future data collection on enriching complete observations rather than enlarging the number of (at least partially) investigated individuals in total. This is important and requires a strict and thorough recruiting protocol, which is particularly difficult in children and if multicenter studies are envisioned.
Microarray data in terms of three target genes responsible for integrin-mediated cell processes, regulation of apical junction formation in human bronchial epithelium, and placental alkaline phosphatase are predictive for asthma independently of the model approach, even though model-specific results show contributions from other modalities, such as breastfeeding months, IL1-beta and IL-5 cytokine and IRF-8 gene expression.
For the future, we suggest to implement our novel analysis strategy to more comprehensively understand and analyze complex human immune regulation with respect to childhood asthma phenotypes. The method is also applicable for other cohort studies aiming to assess multi-omics data sets in medium or large cohort studies. Further, when more data like in the given study can be made available, there is high potential for building and improving current risk tools for childhood asthma which can be optimized by distinguishing for pairs of outcome categories as in Ref. 34.
In conclusion, with our approach of combining seven data modalities (cytokines secretion, candidate SNPs, flow cytometry, clinical diagnostics, questionnaires, RT–qPCR gene expression, and microarray gene expression) using a novel strategy, it was possible to improve the classification of childhood asthma phenotypes in contrast to using only single aspects of the data. A rigorous cross-validation scheme was implemented to assess the performance. Of note, a validation in external populations is important. This generic approach is applicable to other risk prediction or classification settings with incomplete data sets, typically arising in circumstances where collection of specimen depends on clinical feasibility and availability of advanced laboratory techniques. The outlined strategy of this manuscript offers the chance to overcome these challenges and provides a quantitative method making use of the entire information at hand.
ACKNOWLEDGMENTS
Our research was supported by the German Research Foundation within SFB 1243, Subproject A17 (CF, FJT), and the SFB TR22 (BS) and Grant Number SCHA-997/8-1; by the Else-Kröner-Fresenius Foundation (BS, AB); by the DZL (German Lung Center, BS, KL) and by the Federal Ministry of Education and Research, Grant Number 01DH17024 (CF).
CONFLICTS OF INTEREST
The authors declare that they have no conflicts of interest.
AUTHOR CONTRIBUTIONS
BS, AB, and KL designed and implemented the CLARA study. NK and NF performed the statistical analyses.CF supervised the statistical analyses. AB, ML, FJT, and DA advised with respect to statistical questions. NK, AB, CF, and BS drafted the manuscript for important intellectual content.


