Impact of tumor size and location on lung dose difference between stereotactic body radiation therapy techniques for non-small cell lung cancer
Abstract
Background
To evaluate the lung dose differences between three-dimensional conformal radiotherapy (3D-CRT) and intensity-modulated radiation therapy (IMRT) techniques for lung stereotactic body radiation therapy (SBRT) and the correlations with tumor characteristics, such as size and location.
Methods
Dosimetric comparisons between the two SBRT techniques in high- and low- to intermediate-dose regions were retrospectively performed using four planning indices and lung-dose parameters in 31 lung tumors. The magnitude of differences in these parameters was analyzed with relation to the planning target volume (PTV) and location-related parameters.
Results
The absolute differences between the two techniques in lung-dose parameters were small in both ipsilateral and bilateral lungs. The dosimetric differences were mainly correlated with the PTV rather than location-related parameters, with positive and negative correlations with the high-dose and intermediate-dose parameters, respectively. The distances from the ipsilateral lung centroid to the PTV center were not correlated with the differences in any of the lung-dose parameters. Additionally, the negative correlations with the MLD and V20 differences disappeared after applying a more rapid dose fall-off in the IMRT plans for tumors with small PTVs of ≤15 cc.
Conclusions
Lung dose differences between the 3D-CRT and IMRT techniques for lung SBRT were mainly correlated with the PTV rather than location-related parameters. Together with the dosimetric benefit in high-dose lung regions of IMRT for larger tumors, the relative increases in the MLD and V20 for small-sized tumors could be reduced by applying a more rapid dose fall-off outside the PTV.
INTRODUCTION
Stereotactic body radiation therapy (SBRT) has been widely used as a safe and effective treatment for medically inoperable early-stage non-small cell lung cancer (NSCLC) or pulmonary oligometastases.1, 2 This approach involves the delivery of an ablative dose to the tumor using oligofractionated (usually less than five fractions) radiation over a short time course. These high doses can be safely delivered with modern techniques, which are capable of high conformal target coverage and rapid dose fall-off in surrounding normal tissues. Lung SBRT has traditionally been delivered with a three-dimensional conformal radiotherapy (3D-CRT) technique using a large number of coplanar and noncoplanar beams. Recently, the use of modulated beams, such as in intensity-modulated radiation therapy (IMRT) and volumetric modulated arc therapy (VMAT), has been studied in lung cancer patients treated with SBRT, and dosimetric benefits of these techniques relative to the conventional 3D-CRT technique have been reported, together with a major advantage of VMAT in terms of the faster delivery time.3-6 Furthermore, some studies have recently compared the differences in radiological changes after lung SBRT using two different techniques with differences in dose distributions.7, 8
Regarding toxic effects of lung SBRT, radiation pneumonitis (RP) is one of the most commonly studied toxic effects, with reported symptomatic RP rates ranging from 9% to 28%.9 Together with clinical risk factors for RP, dosimetric factors, such as the mean lung dose (MLD) and the percentage of total lung volume receiving a specific dose, have been used to guide the dose limit in RT planning for lung cancer to prevent RP. Recent studies have reported differences in dose limits in SBRT using multiple conformal beams and ablative radiation for small target volumes with respect to the risk of symptomatic RP compared with those in conventional RT for larger target volumes.10-13 Additionally, in a recent hypofractionated treatment effects in the clinic (HyTEC) report and a large study by Liu et al., MLDs less than 6–8 Gy and 20 Gy for the total lung and ipsilateral lung, respectively, and a percent of the total lung volume receiving >20 Gy (V20) less than 10%–15% were suggested as appropriate dosimetric guidance to limit the rate of symptomatic RP to 10%–15% after lung SBRT.14, 15
The selection of a proper technique in SBRT for lung cancer needs to be considered for improved dosimetry in both target and adjacent normal tissues, including lung tissue. In addition, this dosimetric improvement for normal lung tissue can lead to a reduction in the RP risk after lung SBRT. The determination of an optimal SBRT technique based on tumor characteristics might facilitate better dose distributions in target and normal lung tissue. However, to date, dosimetric differences between SBRT techniques have not been specifically studied in relation to tumor characteristics in lung cancer. Therefore, the present study was undertaken to evaluate the lung dose differences between the 3D-CRT and IMRT techniques for lung SBRT and the correlations with tumor characteristics, such as size and location. Dosimetric comparisons between the two SBRT techniques in high- and low- to intermediate-dose regions were performed using four planning indices from Radiation Therapy Oncology Group (RTOG) protocols16, 17 for lung SBRT and lung-dose parameters for ipsilateral, contralateral, and bilateral lungs.
METHODS
Patient and tumor characteristics
After obtaining approval from our institutional review board, 31 tumors in 30 patients previously treated with SBRT using 3D-CRT (for 30 tumors) or static IMRT (for 1 tumor) for early-stage NSCLC at our institution were included in this retrospective study. The median patient age was 74 years (range, 57–86 years). The tumor did not exceed 5 cm in any dimension and were located >2 cm away from the proximal bronchial tree and >1 cm from the chest wall. The lobar location of 22 right (Rt) and nine left (Lt) lung tumors was the upper lobe for 22 tumors, the middle lobe for three tumors, and the lower lobe for six tumors (Table 1).
| Tumor parameters | Median | Range |
|---|---|---|
| Size | ||
| PTV (cc) | 17.0 | 2.3–57.4 |
| Location | ||
| X-axis distance from ipsilateral lung centroid on planning image of PTV center to PTV center (cm) | 1.22 | 0.09−2.69 |
| Y-axis distance from ipsilateral lung centroid on planning image of PTV center to PTV center (cm) | 2.93 | 0.02–7.23 |
| 3D distance from ipsilateral whole lung centroid to PTV center (cm) | 4.79 | 1.09–10.06 |
| Rt lung (n = 22) versus Lt lung (n = 9) | ||
| Upper lobe (n = 22) versus middle/lower lobe (n = 9) |
- Abbreviations: Lt, left; PTV, planning target volume; Rt, right.
Target volume delineation and SBRT planning
A four-dimensional CT (4D CT) technique using a multislice CT scanner (SOMATOM Sensation 64; Siemens Medical Solutions) was performed for SBRT planning in all patients. The patients were advised to breathe freely and regularly, and abdominal compression to reduce breathing motion was not applied in any of the patients. A single helical 4D CT scan that included the entire lung was acquired with fixed acquisition parameters using a commercially available motion-monitoring system (AZ-733 V; Anzai Medical). The projections were retrospectively sorted based on the corresponding breathing phases (exhalation and inhalation) and the relative amplitudes at 25% intervals from 0% to 100%, and the images were reconstructed into eight respiratory phase bins, which were equally distributed throughout the breathing cycle with a slice thickness of 3.0 mm. All of the CT datasets were transferred to a commercial treatment planning system (Pinnacle3 version 8.0 m; Philips Medical Systems, Fitchburg, WI, USA). After the internal target volumes (ITVs) were created by combining the gross tumor volumes (GTVs) from all eight phases of the 4D CT scan, the planning target volumes (PTVs) were generated by adding a uniform 3-mm margin to the ITVs without the clinical target volume (CTV) margins. Regarding the tumor characteristics, the PTV, which is the ultimate target volume for dose prescription, was recorded as the tumor size parameter. The tumor location was measured as the distance (on the x- and y-axes) from the ipsilateral lung centroid on the planning image of the PTV center to the PTV center and the 3D distance from the ipsilateral whole lung centroid to the PTV center, with a focus on the lung volume exposed to the beam pathway up to the PTV.
Together with the clinically used plans, 3D-CRT or IMRT plans for dosimetric comparisons were additionally generated for each tumor in the Pinnacle3 treatment planning system with heterogeneity corrections applied using the collapsed cone convolution superposition algorithm. For 3D-CRT planning, 10–15 (median, 12) coplanar and/or noncoplanar fields with 6- or 15-MV photon beams were employed. A leaf margin of 3 mm was used between the PTV contour and the multileaf collimator. The beam arrangement was customized for each tumor based on the tumor location and nearby organs at risk (OARs). For the static IMRT plans delivered with a step-and-shoot technique, the same beam configurations in terms of the angle, energy, and number of beams as in the 3D-CRT technique were used to ensure a meaningful comparison. The number of segments was limited to a total of 60 per plan, and all objectives for the PTV and OARs were optimized using the direct machine parameter optimization (DMPO) algorithm. A rapid dose fall-off outside the PTV in the IMRT plans was produced with the help of a constraint on the maximal dose of 50% of the prescription dose (24 Gy) to the tissue >1.5 cm (for all 31 tumors in the initial comparison) or >1 cm (for 13 tumors with a small PTV of ≤15 cc in the additional study) away from the PTV. Dose constraints utilized for OARs, such as the spinal cord, esophagus, heart, and rib, in both 3D-CRT and IMRT plans were in accordance with those used in the RTOG 0915 protocol for 48 Gy in a 4-fraction regimen.16 Normal lung tissue as an OAR was never used as a planning objective in the optimization. A total dose of 48 Gy given in four fractions of 12 Gy was prescribed to the PTV. For comparison, the prescribed isodose line for PTV coverage in both plans was adjusted to ensure that at least 95% of the PTV received the prescription dose, and 99% of the PTV was covered by at least 90% of the prescription dose.
Dosimetric analysis
Dose-volume histograms (DVHs) were generated in the 3D-CRT and IMRT plans for each tumor, and the maximum (PTVmax) and mean (PTVmean) PTV doses are reported. For dosimetric comparisons between the two techniques in high- and intermediate-dose regions, four planning indices from the RTOG protocols16, 17 for lung SBRT were used. High-dose spillage was evaluated using the target conformity index (CI, defined as the ratio of the volume receiving the total prescription dose to the PTV volume) and the high-dose location (HDloc) index. The HDloc index corresponds to the volume of tissue outside of the PTV receiving a dose >105% of the prescription dose, and this value is expressed as % of the PTV volume. The R50% index, defined as the ratio of the volume receiving 50% of the prescription dose to the PTV volume, and the D2cm index, defined as the maximum dose (in % of dose prescribed) to any point 2 cm or greater away from the PTV, were used for intermediate-dose spillage evaluation. A structure for the D2cm recording was created by removing a 2-cm isotropic expansion of the PTV from the body.
The dosimetric effects on a normal lung of the two SBRT plans using the 3D-CRT and IMRT techniques were analyzed via lung-dose parameters, such as the MLD and the percent volume of ipsilateral and bilateral lungs minus the PTV or contralateral lung receiving specific doses of 5, 10, 20, 30, 48, and 50 Gy (V5, V10, V20, V30, V48, and V50) according to DVH estimations.
Statistical analysis
To compare dosimetric differences between each pair of all parameters obtained from the 3D-CRT and IMRT plans, we used paired t-tests for each tumor. The correlations between the magnitude of dosimetric differences in all parameters between the two techniques and the size- and location-related tumor parameters for each tumor were evaluated using Pearson's correlation analyses. Additionally, the dosimetric differences between the tumor parameter groups were assessed using the Mann–Whitney test. All statistical analyses were performed using the SPSS software package (version 15.0; SPSS, Inc.). p-values < 0.05 were considered statistically significant.
RESULTS
Tumor characteristics
The characteristics of the 31 tumors, including the size and location, are outlined in Table 1. The median PTV in all tumors was 17.0 cc (range, 2.3–57.4 cc). Regarding the tumor location, the median distance on the x- and y-axes from the ipsilateral lung centroid on the planning image of the PTV center to the PTV center was 1.22 and 2.93 cm, respectively. The median 3D distance, which was calculated as (X2 + Y2 + Z2)1/2, from the ipsilateral whole-lung centroid to the PTV center was 4.79 cm.
Dosimetric differences between the 3D-CRT and IMRT plans
Overall, the IMRT plans exhibited better indices in the target and high-dose regions than the 3D-CRT plans. The PTVmean, related to dose homogeneity inside the PTV, was improved by IMRT, with a significant difference of 18.4% relative to the prescription dose. The CI improved in 19 cases with IMRT, but the difference between the 3D-CRT (1.60) and IMRT (1.50) plans was not significant (p = 0.085). The HDloc index, another index for high-dose spillage, was reduced in the IMRT plans, with a large difference of 25.6%, and exhibited improved values in 30 cases, accounting for all but one case. Regarding intermediate-dose spillage, the R50% was decreased in the 3D-CRT plans (8.20) compared to the IMRT plans (11.80), while the D2cm index was better in the IMRT plans, with a mean difference of 5.3%. The D2cm improved in 21 cases with IMRT, whereas the R50% improved by IMRT in only four cases (Table 2, Figure 1).
| Parameters | 3D-CRT (mean ± SD) | IMRT (mean ± SD) | Paired differences (3D-CRT—IMRT) | |
|---|---|---|---|---|
| Mean (range) | p | |||
| PTVmax (%) | 148.09 ± 7.05 | 112.27 ± 5.21 | 35.83 (23.59–54.03) | 0.000 |
| PTVmean (%) | 123.84 ± 4.37 | 105.48 ± 2.31 | 18.35 (11.89–28.84) | 0.000 |
| CI | 1.60 ± 0.15 | 1.50 ± 0.31 | 0.11 (−0.85–0.60) | 0.085 |
| HDloc (%) | 38.42 ± 12.78 | 12.87 ± 14.69 | 25.55 (−0.34–54.75) | 0.000 |
| R50% | 8.20 ± 1.82 | 11.80 ± 6.48 | −3.59 (−21.18–1.38) | 0.000 |
| D2cm (%) | 72.69 ± 8.89 | 67.44 ± 6.63 | 5.25 (−12.80–24.41) | 0.004 |
| MUs/fraction of 12 Gy | 2370.0 ± 412.3 | 3327.4 ± 692.6 | −957.4 (−2575.0–912.0) | 0.000 |
- Abbreviations: CI, conformity index; HDloc, high-dose location; MUs, monitor units; PTVmax, maximum PTV dose relative to prescription dose; PTVmean, mean PTV dose relative to prescription dose; SD, standard deviation.
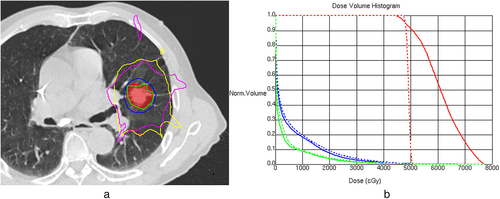
Consistent with the R50% results, the MLD and V5–30, as lung-dose parameters corresponding to low to intermediate doses, exhibited increased values in the IMRT plans. However, the magnitude of the absolute differences between the two techniques in these parameters was small in both ipsilateral and bilateral lungs, with an MLD of 0.75–1.07 Gy and a V20 of 1.2%–2.3%. For bilateral lungs in the 3D-CRT and IMRT plans, the mean MLD was 3.13 and 3.88 Gy, and the mean V20 was 4.3% and 5.5%, respectively. Similar to our results for the indices related to high-dose spillage, the V48 and V50 were improved by IMRT, and they showed differences between the two techniques of 0.3%–0.4% (Table 3, Figure 1).
| Parameters | 3D-CRT (mean ± SD) | IMRT (mean ± SD) | Paired differences (IMRT—3D-CRT) | |
|---|---|---|---|---|
| Mean (range) | p | |||
| ipMLD (Gy) | 5.38 ± 2.02 | 6.44 ± 2.02 | 1.07 (0.12–2.24) | 0.000 |
| biMLD (Gy) | 3.13 ± 1.12 | 3.88 ± 1.15 | 0.75 (0.14–1.43) | 0.000 |
| coMLD (Gy) | 0.78 ± 0.45 | 1.20 ± 0.48 | 0.41 (0.00–0.92) | 0.000 |
| ipV5 (%) | 27.34 ± 8.38 | 32.42 ± 9.28 | 5.08 (2.46–11.34) | 0.000 |
| biV5 (%) | 14.82 ± 4.66 | 18.89 ± 5.24 | 4.07 (2.05–7.85) | 0.000 |
| coV5 (%) | 1.79 ± 2.93 | 4.72 ± 3.96 | 2.93 (−1.16–9.59) | 0.000 |
| ipV10 (%) | 18.82 ± 7.25 | 22.96 ± 7.62 | 4.13 (0.92–9.12) | 0.000 |
| biV10 (%) | 9.75 ± 3.61 | 11.97 ± 3.94 | 2.21 (−0.14–5.40) | 0.000 |
| ipV20 (%) | 8.43 ± 4.79 | 10.75 ± 4.62 | 2.31 (−0.76–5.35) | 0.000 |
| biV20 (%) | 4.27 ± 2.29 | 5.48 ± 2.31 | 1.21 (−0.32–2.66) | 0.000 |
| ipV30 (%) | 3.79 ± 2.34 | 5.02 ± 2.33 | 1.23 (−0.03–3.04) | 0.000 |
| biV30 (%) | 1.91 ± 1.06 | 2.55 ± 1.10 | 0.64 (−0.01–1.72) | 0.000 |
| ipV48 (%) | 0.67 ± 0.57 | 0.37 ± 0.16 | −0.30 (−2.16–0.14) | 0.002 |
| ipV50 (%) | 0.49 ± 0.45 | 0.10 ± 0.09 | −0.38 (−2.16–0.01) | 0.000 |
- Abbreviations: bi, bilateral; co, contralateral; ip, ipsilateral; MLD, mean lung dose; SD, standard deviation; V5, V10, V20, V30, V48, and V50, percentage volumes of ipsilateral and bilateral lungs minus the planning target volume or contralateral lung receiving specific doses of 5, 10, 20, 30, 48, and 50 Gy.
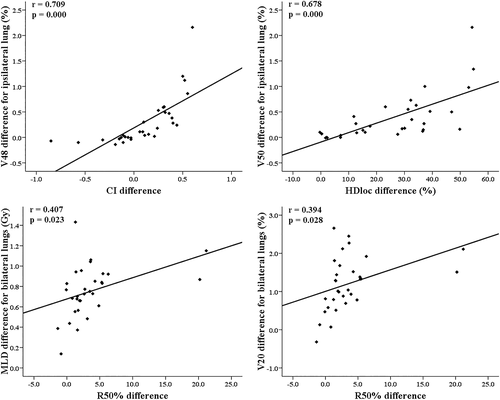
Our results regarding the differences in the RTOG planning indices and the lung-dose parameters between the two SBRT plans were additionally investigated in terms of their relationships. There were significant correlations in the differences between the CI and HDloc indices and the V48 and V50 for ipsilateral lungs and between the R50% index and the MLD, V10, and V20 for ipsilateral and bilateral lungs (Figure 2).
Correlations between the dosimetric differences and tumor characteristics
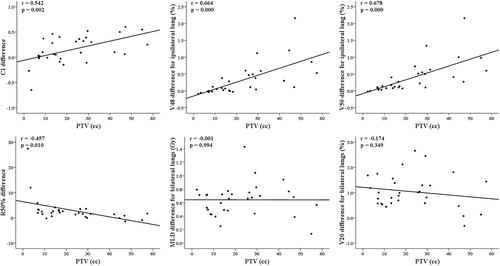
Regarding the correlations (Table 4, Figure 3) of the dosimetric differences between the two SBRT techniques with tumor characteristics, the PTV exhibited positive correlations with the differences in the PTVmean, CI, D2cm, V48, and V50 and negative correlations with the differences in the R50%, MLD and V20 for ipsilateral and bilateral lungs. Regarding location-related parameters, there were positive correlations only between the y-axis distance and the HDloc index difference and between the 3D distance and the D2cm difference, without correlations with the differences in any of the lung-dose parameters. In addition, the differences in the PTVmean (20.5% vs. 17.5%), CI (0.28 vs. 0.03), V48 (0.67% vs. 0.15%), and V50 (0.71% vs. 0.25%) in Lt lung tumors were significantly increased compared to those in Rt lung tumors. The differences in all parameters between tumors in the upper lobe and those in the middle/lower lobes were not significantly different.
| Tumor parameters | Dosimetric differences with significant correlations (r-value, p-value) |
|---|---|
| PTV | PTVmean (0.450, *), CI (0.579, **), R50% (−0.582, **), D2cm (0.522, **), ipMLD (−0.423, *), biMLD (−0.387, *), |
| X-axis distance from ipsilateral lung centroid on planning image of PTV center to PTV center | NS |
| Y-axis distance from ipsilateral lung centroid on planning image of PTV center to PTV center | HDloc (0.419, *) |
| 3D distance from ipsilateral whole lung centroid to PTV center | D2cm (0.470, **) |
- Abbreviations: bi, bilateral; CI, conformity index; HDloc, high-dose location; ip, ipsilateral; MLD, mean lung dose; NS, not significant; PTV, planning target volume; r, Pearson's correlation coefficient; V20, V48, and V50, percentage volumes of ipsilateral and bilateral lungs minus the planning target volume receiving specific doses of 20, 48, and 50 Gy.
- * p < 0.05.
- ** p < 0.01.
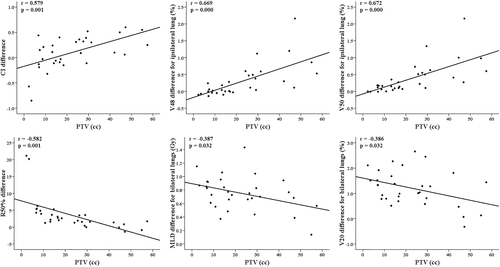
From our results of increasing differences in the intermediate-dose related parameters according to decreasing the PTV, we generated a more rapid dose fall-off, as described in the Methods, in additional IMRT plans for 13 tumors with small PTVs of ≤15 cc. Together with a significant difference (p = 0.004) in the CI between the 3D-CRT (1.60) and IMRT (1.45) plans, the previous correlations between the PTV and the MLD and V20 differences for ipsilateral and bilateral lungs disappeared in 31 tumors with this new application while maintaining the correlations with the differences in the CI, R50%, V48, and V50 (Figure 4).
DISCUSSION
Although there was no significant difference in the CI in the initial comparison, our IMRT plans exhibited better conformity for target and adjacent high-dose regions, similar to the results in most studies comparing dosimetric differences between techniques using 3D conformal and modulated beams.3-6 Furthermore, these improvements for high-dose spillage with IMRT were related to reductions in the high-dose lung volume outside the PTV, such as the V48 and V50, together with good correlations between the RTOG planning indices and lung-dose parameters. Considering the relationships between the CI (48 Gy) and V48 and the HDloc index (>50.4 Gy) and V50 in their definition, the differences of 0.11 in the CI and 25.6% in the HDloc index between the two techniques corresponded to the relatively small differences of 0.3% and 0.4% in the V48 and V50, respectively, for the ipsilateral whole-lung volume. In addition to the conventional risk factors for RP, such as the MLD and V20, some high-dose related parameters, such as the normal lung volume receiving 50 Gy (V50) and the prescription dose (Vp), were also associated with symptomatic RP after lung SBRT in a recent study by Parker et al.18 The absolute difference in the V50 and Vp between the negative and positive RP groups was only 0.7%–1.1% for ipsilateral lungs in their results. With respect to radiological changes after lung SBRT, Badellino et al. reported that late changes occurred in approximately 60% of patients treated with 3D-CRT and VMAT without differences between the two techniques in radiological patterns.8 To date, there is little information on the functions of these high-dose regions inside and outside the PTV as a normal lung after tumor control in patients without late fibrotic changes and the contributions of these regions to RP risk. However, our findings showing increasing differences between the 3D-CRT and IMRT plans in high-dose parameters, including the V48 and V50, according to increasing PTV need to be considered in relation to the potential clinical significance of the high-dose region and tumor characteristics in lung SBRT.
Despite some results indicating less intermediate-dose spillage with modulated beams,3, 5 this improved target conformity with IMRT was generally accompanied by an increase in the volume of normal tissue exposed to low doses.19, 20 In contrast to the consistently improved results for target or high-dose regions with IMRT or VMAT in most studies, the dosimetric benefits relative to those of 3D-CRT in low- to intermediate-dose regions have exhibited some differences among studies. This could be due to the variations in the ring structure with dose limits applied around the PTV for a rapid dose fall-off, the inclusion of normal lung tissue in OAR dose constraints, the used beam configurations including coplanar and noncoplanar beams, and the tumor characteristics included in studies. Similar to the findings of Ong et al.,4 who reported an increase in the CI40%, V5, and V20 when comparing VMAT to 3D-CRT, our study also exhibited increases in low- to intermediate-dose related parameters in the IMRT plans. In particular, their data (4.9% vs. 5.4%) for the V20 in the total lungs with exclusion of the PTV are quite similar to ours. In another study comparing the dosimetric difference between 3D-CRT and IMRT with the same beam angles, Fitzgerald et al. reported that there were no significant improvements in the R50% or MLD with IMRT, whereas the CI and D2cm were improved by IMRT.6 The discrepancy in our results between the R50% and D2cm as indices for intermediate-dose spillage may be explained by the increased D2cm values in the 3D-CRT plans, which had broader DVH lines for PTVs and larger PTVmean values, due to an increase in the maximum point dose in the D2cm structure in addition to an increase in the HDloc index via the use of lower prescription isodose levels for the same PTV coverage with the IMRT plans. Furthermore, these dosimetric characteristics of the 3D-CRT plans compared to the IMRT plans with steeper DVH lines and homogeneous PTV doses may be related to the increased differences in high-dose parameters with increasing PTV. Regarding the clinical significance of the increased MLD and V5–30 in the IMRT plans, the mean (6.44 Gy, 3.88 Gy, and 5.48%) and maximum (10.82 Gy, 6.56 Gy, and 11.52%) values for the ipsilateral MLD, bilateral MLD, and bilateral V20 in the IMRT plans of all 31 tumors were within safe limits for symptomatic RP risk recommended by the HyTEC report and Liu et al.14, 15 Together with these values within safe limits, our small differences between the two techniques in these parameters are unlikely to be related to clinically significant differences.
In contrast to the positive correlations with the differences in high-dose related parameters, as tumor size parameter, the PTV had significant negative correlations with the differences in intermediate-dose parameters, such as the R50%, MLD, and V20, in our initial results. Our consideration for these negative correlations was more gradual dose fall-off outside the PTV for small PTVs in the IMRT plans, for which the maximal dose constraint of 24 Gy at 1.5 cm from all PTVs was applied consistently. Therefore, we applied the same dose constraint at 1 cm instead of 1.5 cm from the PTV to generate a more rapid dose fall-off in additional IMRT plans of 13 tumors with a small PTV of ≤15 cc. This cutoff value of 15 cc was selected with consideration of the median PTV (17.0 cc) in our data and the RTOG protocol guidelines for the D2cm index,16, 17 which recommend a D2cm value of <50% of the prescription dose up to 13.2 cc in PTVs. In all tumors including this new application for 13 tumors, changes in the mean R50% difference (3.59 ➔ 2.99) and correlation coefficient (−0.582 ➔ −0.457) between the R50% difference and PTV were found, along with decreases in the mean difference in the MLD (0.75–1.07 Gy ➔ 0.64–0.90 Gy) and V20 (1.2–2.3 Gy ➔ 1.0–2.0 Gy) for ipsilateral and bilateral lungs. Additionally, the correlations of the PTV with the MLD and V20 differences disappeared. With this more rapid dose fall-off outside the PTV, the relative disadvantage in terms of the MLD and V20 in IMRT for small tumors could be reduced. Regarding the tumor location, the positive correlation between the Y-axis distance and the HDloc index difference and the increased differences in high-dose parameters in Lt lung tumors may be related to the better quality of IMRT plans in these high-dose regions in terms of the higher chance of including an interface between the lung and soft tissues, such as the chest wall, heart, or great vessels. A limitation of this study is that only nine cases were included in the comparison of tumor parameters for the Lt lung and middle/lower lobe locations. As expected, 3D-CRT required fewer monitor units (MUs), as described in Table 2. The increase of approximately 40% in fractional MUs in IMRT could be critical for fast treatment delivery. The advantages of a faster treatment delivery time via VMAT or a higher dose rate, such as via flattening-filter-free (FFF) beams, also need to be considered together with the dosimetric benefits.21, 22
In conclusion, the dosimetric differences between 3D-CRT and IMRT were mainly correlated with the PTV rather than location-related parameters, with positive and negative correlations with the high-dose and intermediate-dose parameters, respectively. Together with the dosimetric benefit in high-dose lung regions of IMRT for larger tumors, the relative increases in the MLD and V20 for small-sized tumors could be reduced by applying a more rapid dose fall-off outside the PTV.
CONFLICT OF INTEREST
None of the authors report any conflicts of interest.


