Three dimensional texture analysis of noncontrast chest CT in differentiating solitary solid lung squamous cell carcinoma from adenocarcinoma and correlation to immunohistochemical markers
Abstract
Background
The aim of the study was to investigate 3D texture analysis (3D-TA) in noncontrast enhanced computed tomography (CT) (NCECT) to differentiate squamous cell carcinoma (SCC) from adenocarcinoma (AC), and the correlation with immunohistochemical markers.
Methods
A total of 70 patients confirmed with SCC (n = 29) and AC (n = 41) were enrolled in this retrospective study. 3D-TA was utilized to calculate TA parameters of all the tumor lesions based on NCECT images, and all the patients were divided into the training and the test groups. The TA parameters were selected by dimensionality reduction, and the model was established to differentiate SCC from AC according to the training group. The ROC curve was used to evaluate the diagnostic efficiency of the model in both the training and the test groups. Spearman correlation were used to assess the correlation between the selected feature parameters and immunohistochemical markers (P63, P40, and TTF-1).
Results
Five TA parameters, including volume count, relative deviation, Haralick correlation, gray-level nonuniformity and run length nonuniformity, were obtained to differentiate SCC from AC by multistep dimensionality reduction. The new model combined with all five TA parameters yielded a high diagnostic performance to differentiate SCC from AC (AUC 0.803) in test group, with a specificity of 89% and a sensitivity of 77%. There was weak correlation between the five texture feature parameters and P63 as well as P40 in all patients (P < 0.05), respectively.
Conclusions
The model including five TA parameters on NECT has a good diagnostic performance in differentiating SCC from AC.
Key points
• Significant findings of the study
The model created by five selected textural feature parameters can differentiate solid SCC from AC without contrast media. The selected five texture feature parameters are correlated to the immunohistochemical markers P63 and P40.
• What this study adds
The textural feature parameters' model can identify SCC from AC without contrast media.
Introduction
Lung cancer is one of the most common cancers, and it has the highest age-standardized rate of all cancers. It affects 22.5 lung cancer patients per 100 000 people, and remains a leading cause of death amongst cancer patients.1, 2 Lung cancer is generally divided into small cell lung cancer and non-small cell lung cancer (NSCLC). NSCLC accounts for 80%–85% of lung cancer. The most common NSCLCs are squamous cell carcinoma (SCC) and adenocarcinoma (AC). Clinical treatment strategies are different according to the histological types of lung cancer and the choice of treatment strategies directly affects the therapeutic effect, survival rate and life quality of lung cancer patients.3 Therefore, the early differentiation of SCC and AC is very important before treatment.
In clinical practice it is difficult to make a differential diagnosis of a solitary solid mass and nodule based on tumor morphology of traditional imaging examinations. Contrast-enhanced computed tomography (CT) scan and CT perfusion imaging can provide additional information, but the accuracy is still not high and there is limited application in patients with severe kidney dysfunction as well as contrast agent allergy. The gold standard for clinical diagnosis of lung SCC and AC is histopathology. Invasive biopsy is often used for pathological sampling. Its complications are serious, such as pneumothorax, and pulmonary hemorrhage, and the accuracy of the results is affected by sample error.4 In recent years, textural analysis (TA) technology based on medical images has been gradually being applied in clinical practice, and has been shown to be of important value in the field of disease diagnosis, differential diagnosis and survival prediction.5-8
The aim of this study was to investigate whether 3D-TA based on noncontrast chest CT (NCECT) could differentiate solitary solid lung SCC and AC, and to evaluate the correlation to the immunohistochemical markers which can identify SCC from AC.
Methods
Study patients
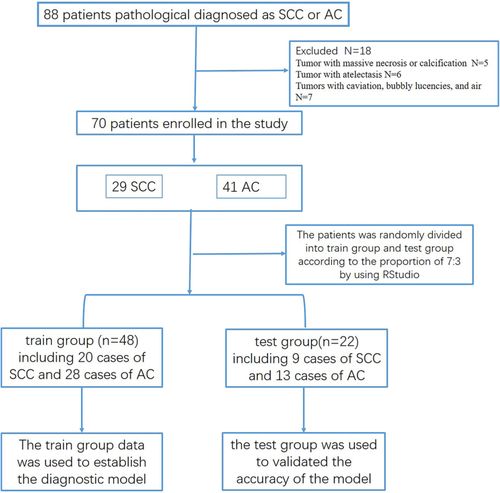
We retrospectively collected the CT and pathological data in 88 patients with solitary solid lung cancer from 2016 to 2018 in our hospital. A flowchart of patients’ enrollment is shown in Fig 1. The inclusion criteria were as follows: (i) Patients had a pathological diagnosis of SCC or AC; (ii) patients had no history of chemotherapy and/or radiotherapy; and (iii) patients had immunohistochemical markers. The exclusion criteria included the following: (i) Tumors had necrosis or calcification; (ii) tumors had atelectasis; (iii) tumors had cavitation, bubbly lucencies, and air. Finally, 70 patients (55 males, age 63 ± 9 years) were enrolled into the study, including 29 patients with lung SCC (age 66 ± 8 years), and 41 patients with AC (age 60 ± 9 years).
Following approval by the local institutional review board, our retrospective study was performed with a waiver of written informed consent.
CT scanning
The CT examinations of all the patients were performed on a Siemens 128-slice multidetector spiral CT (Definition AS+, Siemens, Germany). The patients were placed in a supine position on the CT table, and scanning was performed from the apex to the base of the lung with breath-holding. Scanning parameters included: voltage: 120 KV, current: 35mA; pitch: 1.2; Care Dose 4D; reconstruction thickness: 1 mm; slice interval:1 mm; Kernel: B40f medium.
3D texture analysis
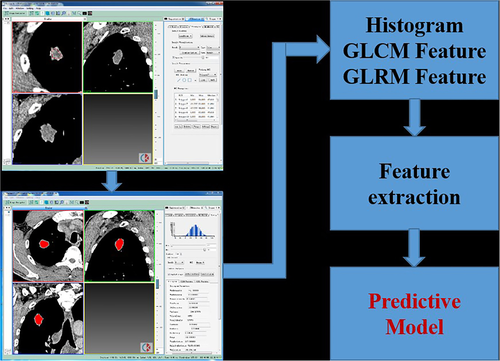
The NECT images of the patients were reconstructed with 1 mm thickness and then were imported into the texture analysis software (CTKinetics APP, version V1.3.0.R, GE Healthcare). The images of lesions were drawn one slice at a time using uniform WW (220HU) and WL (35HU) in the texture analysis software. Finally, 3D merge was performed, and then the texture parameters of the tumors were calculated using the software (Fig 2). Three groups of texture features were utilized to obtain 42 texture features parameters for each tumor. These utilized texture features were Histogram (histogram), GLCM (gray level co-occurrence matrix) and GRLM (gray level run-length matrix).
Statistical analysis
All statistical analyses were performed using RStudio 1.1.463 (Boston, Mass). The data was preprocessed, missing values were replaced by median, and then standardized to eliminate the influence of data dimension. Normal distribution was tested by Shapiro test. During texture feature's dimensionality reduction, the student's t-test was used to evaluate texture feature parameters satisfied the normal distribution, and wilcox test was used to evaluate texture feature parameters unsatisfied the normal distribution. Spearman correlation analysis was used to extract the texture feature parameters without high correlation. The logistic regression method was used with stepwise according to Akaike information criterion (AIC) to select the texture feature parameters for classification of SCC and AC. The diagnostic performance of selected texture parameters created model was evaluated by receiver operating characteristic (ROC) curve. Spearman correlation was performed to evaluate the relationship between texture feature parameters including in the diagnostic model and the immunohistochemical markers of lung cancer, respectively.
Results
Subject characteristics
A total of 70 patients were divided into two groups, the training group (n = 48) and the test group (n = 22), randomly (Fig 1). The training group included 20 cases of SCC and 28 cases of AC; and the test group included nine cases of SCC and 13 cases of AC. The training group data was used to establish the diagnostic model, and the test group was used to validate the accuracy of the TA model.
Selection of TA parameters
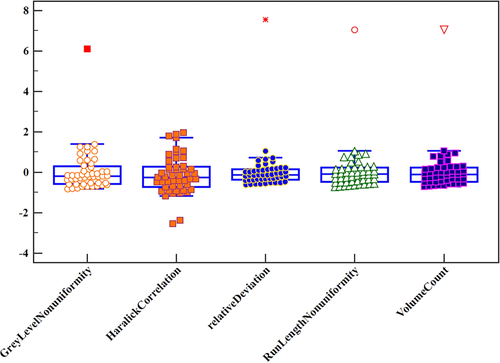
Five texture feature parameters, including volume count, relative deviation, Haralick correlation, gray-level nonuniformity, and run-length nonuniformity were obtained to differentiate between SCC and AC of the lungs (Fig 3) by multistep texture feature selection and dimensional reduction described in statistical analysis session. Their sensitivity, specificity, accuracy and ROC curves are shown in Table 1 and Fig 4.
| Training cohort (n = 48) | Test cohort (n = 22) | |||||
|---|---|---|---|---|---|---|
| AUC | Sensitivity | Specificity | AUC | Sensitivity | Specificity | |
| Volume count | 0.682 (0.532, 0.809) | 0.857 | 0.500 | 0.786 (0.561–0.93) | 0.846 | 0.667 |
| Relation deviation | 0.702 (0.552, 0.825) | 0.893 | 0.450 | 0.863 (0.65–0.971) | 0.846 | 0.778 |
| Haralick correlation | 0.700 (0.551, 0.824) | 0.893 | 0.450 | 0.769 (0.542–0.92) | 0.769 | 0.778 |
| Gray-level nonuniformity | 0.677 (0.526, 0.805) | 0.750 | 0.600 | 0.658 (0.428–0.844) | 0.923 | 0.444 |
| Run length nonuniformity | 0.684 (0.532–0.809) | 0.857 | 0.500 | 0.786 (0.561–0.93) | 0.846 | 0.667 |
- AUC, area under curve, expressed as mean (95% confidence interval).
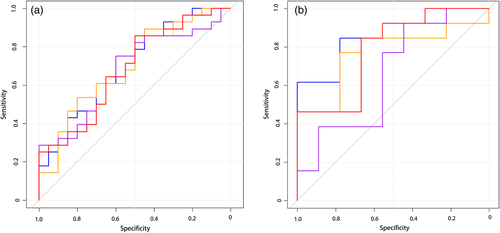
 volume count,
  relative deviation,
  Haralick correlation,
  gray-level nonuniformity,
  run-length nonuniformity, and (b) test set,
  volume count,
  relative deviation,
  Haralick correlation,
  gray-level nonuniformity,
  run-length nonuniformity, respectively.
Creation and evaluation of the differential diagnostic model
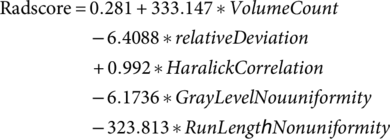
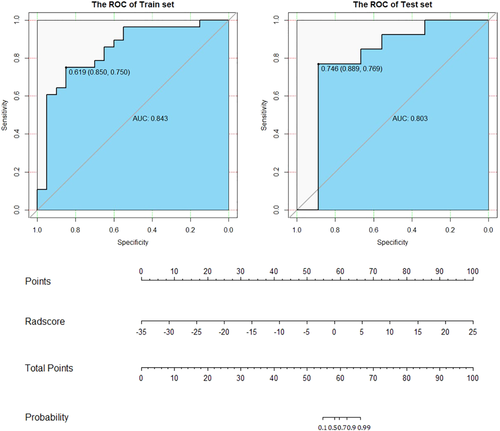
The AUC of the model was 0.843 (95% CI: 0.725–0.961); the specificity was 85% and sensitivity 75% with a cutoff of 0.619 in the training group; and the AUC was 0.803 (95% CI: 0.576–1); the specificity was 0.889 and sensitivity 0.769 with a cutoff of 0.746 in the test group (Fig 5).
Correlation of TA parameters and immunohistochemical markers
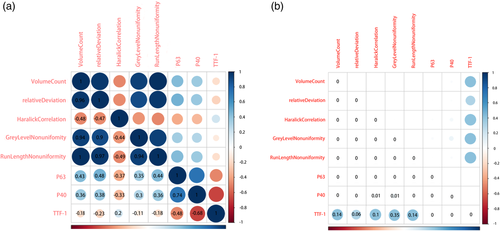
The results of immunohistochemical markers, such as P63, P40, thyroid transcription factor-1 (TTF-1), are shown in Table 2. There was a weak correlation between the five characteristic parameters; and P63 and P40 in all patients with lung cancer, P < 0.05, and there was no significant correlation with TTF-1, P > 0.05 (Fig 6).
| Immunohistochemical markers | SCC (n = 29) | AC (n = 41) |
|---|---|---|
| P63 (+), n (%) | 28 (97%) | 9 (22%) |
| P40 (+), n (%) | 28 (97%) | 0 (0%) |
| TTF-1 (+), n (%) | 2 (5%) | 31 (76%) |
- Immunohistochemical markers expressed as count (percentage).
- TTF-1, Thyroid transcription factor-1.
Discussion
The major finding of this study was that the 3D-TA model had a high diagnostic performance to differentiate solitary solid SCC from AC, and the selected five TA features correlated with the immunohistochemical markers. This model was able to identify solitary solid SCC from AC without a contrast agent, which may benefit patients with severe kidney dysfunction and contrast agent allergy.
The local irregular and macroscopic characteristics of the image is called texture. It is a rule of gray level change of pixels (or subregions) in an image which reflects the internal structure of a tissue and the heterogeneity of tumor.9-13 The theoretical basis for this is image nonuniformity related to different genetic and pathological characteristics. Tumors have different genetic and pathological characteristics, leading to image heterogeneity. The texture feature parameters of medical images cannot be directly visualized by radiologists and they can only be identified by the texture feature extraction software. The software can accurately evaluate the image heterogeneity, and provide more information for the comprehensive evaluation of the lesions.12, 14
Recently, CT TA of lung tumors mainly focuses on diagnosis of benign and malignant lung masses, prediction of lymph node metastasis, diagnosis of histology and subtypes of lung cancer, evaluation of therapy effect after treatment of lung cancer and the prediction of survival rate for lung cancer.15-20 There are few studies on histological classification of lung cancer which use different texture analysis software with different results. Basu et al. and others21, 22 used 2D-TA to classify lung SCC and AC. Obviously, 2D-TA has some limitations, as it cannot fully reflect the heterogeneity of the whole tumor.
To avoid errors caused by artificial classification, random classification by 10-fold cross validation was used to classify the training and the test groups. The AUC of this 3D-TA model, including volume count, relative deviation, Haralick correlation, gray-level nonuniformity, and run length nonuniformity was 0.803, with specificity of 89% and sensitivity of 77%. Five texture parameters and model formulas were obtained for differentiating solitary solid SCC from AC. The first two texture parameters belong to histogram features, which mainly reflect the total number and relative deviation of the selected ROI pixels of images. Haralick correlation belongs to the gray level co-occurrence matrix (GLCM), which reflects the correlation of local gray level in the image. The latter two texture parameters belong to gray run length matrix (GRLM), which reflect the heterogeneity of signal and structure of image pixels in ROI. From these five parameters, we could see that there were differences in the total number of pixels, the correlation of signal and gray level, and the structure of SCC and AC in NECT images. The theoretical basis for these findings may reflect the heterogeneity of tumor pathological manifestation.
Immunohistochemical markers of lung cancer, such as P63, P40 and TTF-1, are considered as the gold standard in the differentiation of SCC from AC. The correlation between the three immunohistochemical markers and the selected five texture parameters enabled us to verify our TA model. P63 and P40 are immunohistochemical markers of SCC, and TTF-1 is a marker of AC, and they have a high degree of accuracy, specificity and sensitivity in differentiating SCC from AC.23-25 The selected five texture parameters were weakly correlated with P63 and P40, but not with TTF-1. It is speculated that these five texture parameters may reflect the histopathological characteristics of SCC, which is the histological basis for the differentiation SCC from AC. As each texture parameter may represent tumor cell type, density and vascular density and so on, further studies with a larger sample size and correlation with histopathology is needed.
There are some limitations in this study. First, the sample size was relatively small, and it was a retrospective analysis. A larger sample size will be enrolled in the next study and our model for the differential diagnosis of SCC and AC of the lungs will also be validated and improved. Second, only the immunohistochemical markers P63, P40 and TTF-1 were included in this study. Other texture parameters that correlate with the other immunohistochemical markers need further research. Third, NECT images of lung cancer patients were performed on one CT scanner, and external validation will be investigated on CT images of the other CT scanners.
In conclusion, this 3D-TA model, including volume count, relative deviation, Haralick correlation, gray-level nonuniformity, and run length nonuniformity on NECT images had high specificity, sensitivity and accuracy to differentiate solitary solid SCC from AC. The five texture feature parameters correlated with immunohistochemical markers P63 and P40. This TA model may provide important clinical value in the diagnosis and treatment of SCC and AC patients in the future.
Acknowledgments
This work was supported by Key Program of Wuhan Municipal Health Commission project (grant numbers: WX18B08, 2018).
Disclosure
No authors report any conflict of interest.


