Reference Growth Curves for Cypriot Children 6 to 17 Years of Age
Abstract
Objective: The purpose of the study was to present smoothed percentiles for body weight and height, waist circumference, and body mass index (BMI) in Cypriot children and to compare their BMI 85th and 95th percentiles with those of children in other countries.
Research Methods and Procedures: The study was a cross-sectional study, including a representative sample of 2472 healthy children (49.1% boys) in Cyprus ages 6 to 17 years, who were evaluated during the 1999–2000 school year. Body weight and height and waist circumference were measured using standard procedures. BMI was calculated as weight in kilograms per height in square meters. Smoothed, sex-specific percentiles for these variables were calculated using polynomial regression models. Crude weight, height, waist, and BMI percentile values are presented in sex-specific tables and smoothed percentile curves are presented in charts. The 85th and 95th percentiles for BMI were compared with measurements from other countries, because of the concern of the upper limits of BMI in respect to the evaluation of obesity.
Results: The 85th and 95th BMI percentile values are higher in Cypriot boys than in Swedish and Iranian boys through all ages and in girls ages 6 to 15 years, whereas after the age of 15 years, both Swedish and Iranian girls’ percentiles are equalized with their Cypriot peers.
Discussion: Weight, height, waist circumference, and BMI values and charts are presented for the first time for Cypriot children and adolescents. Much concern should be addressed to the observation that for the majority of the Cypriot sample, the upper BMI limits are higher than the peers of developing and developed countries.
Introduction
Recording body weight and height on standard percentile charts is an essential tool for monitoring growth, and therefore, long-term health in children and adolescents. Traditionally, non-national percentile plots have been used in most countries—and in Cyprus as well—but the construction of national percentile curves can help in detecting long-term trends of these parameters (1). No such plots existed so far for Cypriot children.
The concern about the worldwide increase of the prevalence of obesity in both adults (2) and children (3) (4) (5) is well-known. Childhood obesity is a matter of serious concern leading to possibly serious health hazards (6) (7) (8) (9). Existing information about childhood obesity in Cyprus suggests that the prevalence is similar to that observed in developed countries (10) (11) and some anthropometric indices have increased during the past 10 years (11) (12).
The evaluation of obesity relies largely on body mass index (BMI) in the clinical setting and in epidemiological studies. The American Academy of Pediatrics Expert Committee on obesity evaluation and treatment suggests using BMI as the tool for the screening and classification of childhood obesity (13). Two studies have evaluated the association (assessed with multiple regression analysis) of BMI to percentage of body fat (PBF), measured by DXA, in children and adolescents (14) (15). In one study, BMI explained 63% of the variance of PBF in boys and 69% in girls (14). When combined with gender and maturational stage, BMI explained 76% of the variance of PBF in white children and 77% of the variance of PBF in black children (15). It has been shown, however, that the relation between PBF and BMI is different among various adult ethnic groups (such as white, Chinese, Ethiopians, Indonesians, and Thais) (16) and the use of more appropriate statistical methods, such as Hattori's chart-analysis of BMI, has shown a great variability in PBF for a given BMI in children 8 to 12 years of age (17). Thus, these findings support the opinion that BMI cut-off points for obesity should be cautiously sought, and that they should at least be population-specific.
Waist circumference is also an important variable, because it correlates well with intra-abdominal adipose tissue (18) (19) (20) and with metabolic complications such as a pathological lipid profile in both adults and children (21) (22) (23) (24) (25).
The purpose of this study was to construct percentile curves for BMI, waist circumference, and body weight and height in a representative sample of children and adolescents, ages 6 to 17 years, in the unoccupied Turkish troops part of Cyprus and to compare these curves to the curves of other countries.
Research Methods and Procedures
Study Design and Subjects
The data were collected during the 1999–2000 school year and were obtained from primary and secondary schools in all five freely accessible districts of Cyprus. The whole population in this area was estimated at 657,000; 128,700 were children and adolescents ages 6 to 17 years at the end of 1997 (26). It was estimated that 2357 children in this age group (6 to 17 years) would satisfy an interval level of 2% at a 95% confidence interval. This sample was increased by 10% to compensate for possible nonparticipation in the study, and thus 2600 children were randomized for participation.
The schools were selected with the cooperation of the Statistical Service of the Ministry of Finance of the Republic of Cyprus. Children were randomly selected from their schools, providing that the sample was representative of the total population distribution on the island in respect to district and urban/rural distribution in each district. All public elementary and secondary schools of Cyprus participated in the randomization. The percentage of children attending public elementary schools was 96% during the 1999–2000 school year, and the percentage of those attending public secondary schools was over 90% (Statistical Service of the Republic of Cyprus, personal communication, 2001). A total of 136 classes from 98 of 409 elementary schools was selected (i.e., 24% of the elementary schools were included in the study). A total of 135 classes from 70 of 95 secondary schools was selected (i.e., participation of 73%).
A maximum number of 10 to 12 children per class, randomly selected from their class catalogue, were selected to have a broad coverage in respect to socio-economic level. In certain rural schools, with small numbers of students, the selected number per class was reduced to 6 to 8 children.
The children participated in the study after written consent was given by their parents or legal guardian.
Anthropometric Measurements
Trained research assistants measured body weight and height. The details of the measurements have been described elsewhere (25). Briefly, weight (in kilograms) was measured after breakfast (light clothing and no shoes) with a portable scale (SECA 762; Vogel and Halke, Hamburg, Germany). Children were asked to void before they were weighed. Height (0.1 cm) was measured in the standing position, with a portable stadiometer (SECA 208; Vogel and Halke). The portable scale and stadiometer were calibrated daily.
BMI was calculated as weight (kilograms)/square height (square meters). Waist circumference was measured at the level of umbilicus, in the standing position, with a flexible nondistendible tape.
Statistical Analysis
Crude percentiles were calculated for body weight and height and BMI separately for boys and girls in 1-year intervals. The percentiles were smoothed using polynomial regression models. The calculated percentiles were the 5th, 10th, 15th, 25th, 50th, 75th, 85th, 90th, and 95th—but for practical reasons only the 5th, 15th, 50th, 85th, 90th, and 95th percentiles are presented.
Because of the interest in the upper limits of BMI for the evaluation of overweight and obese children, the 85th and 95th percentiles for BMI were compared with recently published percentiles from Sweden (27) (as a representative of developed countries) and from Iran (28) (as a representative of developing countries), respectively.
Results
A total of 2518 of the 2600 children randomized for this study actually participated (participation rate was 96.8%). We excluded 11 children that had growth disturbances as a result of any primary disease (malignancies, endocrine diseases, etc.) or as a consequence of its treatment (e.g., steroids). We also excluded 35 children that were ages 18 years or older; therefore, a total of 2472 children (1214 boys or 49.1%) remained in the final analysis.
The ratio of their residence was 1.94:1 (urban:rural areas), whereas the whole population's ratio is 2.2:1 (26). The sample's distribution in respect to district and area of living (urban or rural) was similar to the whole population in Cyprus.
The mean values and SDs for body weight and height, waist circumference, and BMI in relation to age are shown in Table 1 for boys and Table 2 for girls. There is a gradual increase in body weight and height, which notably decelerates after the age of 15 years in boys and the age of 13 years in girls. There is also an increasing trend in waist circumference both in boys and girls. Similarly, there is an increase in BMI until the age of 16 years in boys and the age of 15 years in girls. BMI values are slightly higher in girls until the age of 12 years compared with boys, but after the age of 13 years, BMI is higher in boys.
| Age | Number | Body weight (kg) | Body height (cm) | Waist circumference (cm) | BMI (kg/m2) |
|---|---|---|---|---|---|
| 6 | 69 | 23.4 (4.4) | 120.3 (5.2) | 55.7 (6.0) | 16.1 (2.3) |
| 7 | 93 | 26.1 (5.4) | 125.2 (5.5) | 57.6 (6.8) | 16.6 (2.7) |
| 8 | 96 | 29.9 (7.8) | 131.3 (7.3) | 60.4 (7.7) | 17.2 (2.9) |
| 9 | 121 | 33.1 (7.0) | 136.2 (5.9) | 62.8 (7.9) | 17.7 (2.8) |
| 10 | 101 | 38.4 (9.6) | 141.7 (6.6) | 66.5 (10.1) | 19.0 (3.9) |
| 11 | 101 | 41.7 (10.3) | 147.2 (7.4) | 66.9 (9.0) | 19.1 (3.3) |
| 12 | 108 | 46.5 (10.9) | 154.0 (8.3) | 69.1 (8.9) | 19.4 (3.3) |
| 13 | 115 | 53.1 (13.3) | 159.9 (9.3) | 71.4 (10.6) | 20.6 (4.1) |
| 14 | 105 | 62.5 (13.9) | 167.9 (7.2) | 75.9 (11.0) | 22.1 (4.2) |
| 15 | 105 | 63.6 (13.1) | 171.1 (8.2) | 75.2 (9.8) | 21.6 (3.5) |
| 16 | 105 | 69.8 (13.2) | 173.7 (6.4) | 78.7 (9.8) | 23.1 (4.1) |
| 17 | 95 | 71.8 (12.4) | 175.5 (5.6) | 79.3 (9.0) | 23.3 (3.5) |
| Age | Number | Body weight (kg) | Body height (cm) | Waist circumference (cm) | BMI (kg/m2) |
|---|---|---|---|---|---|
| 6 | 89 | 23.4 (4.6) | 119.7 (4.6) | 55.5 (6.5) | 16.2 (2.6) |
| 7 | 100 | 26.8 (5.3) | 126.0 (4.9) | 58.1 (6.6) | 16.8 (2.5) |
| 8 | 96 | 29.0 (7.6) | 129.6 (6.1) | 58.8 (7.8) | 17.1 (3.3) |
| 9 | 112 | 33.1 (8.6) | 135.9 (6.7) | 62.1 (8.3) | 17.7 (3.4) |
| 10 | 120 | 39.2 (10.6) | 142.6 (7.8) | 65.4 (9.6) | 19.0 (3.9) |
| 11 | 107 | 44.3 (10.1) | 150.2 (7.4) | 66.1 (7.2) | 19.5 (3.2) |
| 12 | 118 | 48.2 (11.1) | 155.1 (6.2) | 67.0 (8.4) | 19.9 (3.7) |
| 13 | 101 | 49.8 (8.7) | 158.0 (6.9) | 66.4 (6.0) | 19.9 (3.0) |
| 14 | 113 | 52.9 (8.5) | 159.7 (6.3) | 68.1 (6.1) | 20.7 (3.2) |
| 15 | 101 | 55.6 (9.0) | 160.9 (6.6) | 69.5 (6.5) | 21.5 (3.1) |
| 16 | 103 | 54.9 (8.4) | 160.8 (5.5) | 68.5 (6.5) | 21.2 (2.9) |
| 17 | 98 | 56.3 (9.6) | 161.8 (5.7) | 69.7 (7.3) | 21.5 (3.4) |
The crude percentiles are shows as follows: for body weight, Table 3 for boys and Table 4 for girls; for height, Table 5 for boys and Table 6 for girls; for BMI, Table 7 for boys and Table 8 for girls; and for waist circumference, Table 9 for boys and Table 10 for girls. The smoothed percentiles are illustrated in Figures 1–8.
| Percentiles | ||||||
|---|---|---|---|---|---|---|
| Age (years) | 5th | 15th | 50th | 85th | 90th | 95th |
| 6 | 17.82 | 19.84 | 23.00 | 26.80 | 30.00 | 34.30 |
| 7 | 18.97 | 21.00 | 25.00 | 30.45 | 34.00 | 37.15 |
| 8 | 21.99 | 23.50 | 29.00 | 35.50 | 40.65 | 44.15 |
| 9 | 25.00 | 26.00 | 32.00 | 41.55 | 43.00 | 46.50 |
| 10 | 25.47 | 29.39 | 35.60 | 49.94 | 52.80 | 59.95 |
| 11 | 30.00 | 33.00 | 39.00 | 52.00 | 56.80 | 63.80 |
| 12 | 31.45 | 35.35 | 45.00 | 60.00 | 61.50 | 67.91 |
| 13 | 35.40 | 40.00 | 50.00 | 65.80 | 74.20 | 80.36 |
| 14 | 44.59 | 49.50 | 59.00 | 76.15 | 82.80 | 85.70 |
| 15 | 46.30 | 51.95 | 61.00 | 75.20 | 80.00 | 90.58 |
| 16 | 51.60 | 58.00 | 66.50 | 81.65 | 86.40 | 93.53 |
| 17 | 55.84 | 60.00 | 69.00 | 84.40 | 88.50 | 94.07 |
| Percentiles | ||||||
|---|---|---|---|---|---|---|
| Age (years) | 5th | 15th | 50th | 85th | 90th | 95th |
| 6 | 18.00 | 19.00 | 22.00 | 28.97 | 30.50 | 33.55 |
| 7 | 19.31 | 22.00 | 26.00 | 32.99 | 34.09 | 37.48 |
| 8 | 20.00 | 22.50 | 27.00 | 35.00 | 40.27 | 45.23 |
| 9 | 23.76 | 25.98 | 30.95 | 38.15 | 44.40 | 50.51 |
| 10 | 25.53 | 28.08 | 37.00 | 51.00 | 53.90 | 61.80 |
| 11 | 31.94 | 34.00 | 43.00 | 54.00 | 58.20 | 63.92 |
| 12 | 34.48 | 38.00 | 47.00 | 56.15 | 60.05 | 67.23 |
| 13 | 37.10 | 41.65 | 49.00 | 59.35 | 62.00 | 65.45 |
| 14 | 40.00 | 44.40 | 52.00 | 62.00 | 65.40 | 68.40 |
| 15 | 43.00 | 45.30 | 54.00 | 64.35 | 66.00 | 71.80 |
| 16 | 44.20 | 47.00 | 54.00 | 62.40 | 68.00 | 71.90 |
| 17 | 43.00 | 46.93 | 54.50 | 66.53 | 70.20 | 76.50 |
| Percentiles | ||||||
|---|---|---|---|---|---|---|
| Age (years) | 5th | 15th | 50th | 85th | 90th | 95th |
| 6 | 111.66 | 114.10 | 120.80 | 125.46 | 126.50 | 129.06 |
| 7 | 116.63 | 120.00 | 125.30 | 131.67 | 132.68 | 135.50 |
| 8 | 121.41 | 124.60 | 131.00 | 137.14 | 138.79 | 142.10 |
| 9 | 127.52 | 129.56 | 136.00 | 142.34 | 143.84 | 145.60 |
| 10 | 131.73 | 134.93 | 141.30 | 149.37 | 150.08 | 152.59 |
| 11 | 136.26 | 139.59 | 147.00 | 154.00 | 157.02 | 161.80 |
| 12 | 142.27 | 146.00 | 152.85 | 161.43 | 163.55 | 168.92 |
| 13 | 143.80 | 149.20 | 161.50 | 170.16 | 172.40 | 174.02 |
| 14 | 152.74 | 161.48 | 168.00 | 175.00 | 176.46 | 179.56 |
| 15 | 155.84 | 164.68 | 172.00 | 178.00 | 179.00 | 181.00 |
| 16 | 162.32 | 166.54 | 174.00 | 181.10 | 183.00 | 184.44 |
| 17 | 166.20 | 170.00 | 175.20 | 181.56 | 184.04 | 186.00 |
| Percentiles | ||||||
|---|---|---|---|---|---|---|
| Age (years) | 5th | 15th | 50th | 85th | 90th | 95th |
| 6 | 112.00 | 115.68 | 119.13 | 124.70 | 126.22 | 128.11 |
| 7 | 118.02 | 121.85 | 125.50 | 131.00 | 132.06 | 134.43 |
| 8 | 120.51 | 123.00 | 129.50 | 137.09 | 137.96 | 140.26 |
| 9 | 126.26 | 129.28 | 135.30 | 143.21 | 146.21 | 148.58 |
| 10 | 132.03 | 134.20 | 141.85 | 149.87 | 153.13 | 156.19 |
| 11 | 137.90 | 140.60 | 151.20 | 157.58 | 160.10 | 161.98 |
| 12 | 145.16 | 148.94 | 155.10 | 161.75 | 163.04 | 166.04 |
| 13 | 145.91 | 152.12 | 158.20 | 165.27 | 167.28 | 169.63 |
| 14 | 149.20 | 153.48 | 160.00 | 165.36 | 167.80 | 170.98 |
| 15 | 151.01 | 154.23 | 161.20 | 167.05 | 169.80 | 172.00 |
| 16 | 151.78 | 155.06 | 160.60 | 166.36 | 168.60 | 170.00 |
| 17 | 152.29 | 155.43 | 161.25 | 168.52 | 169.44 | 171.05 |
| Percentiles | ||||||
|---|---|---|---|---|---|---|
| Age (years) | 5th | 15th | 50th | 85th | 90th | 95th |
| 6 | 13.43 | 14.30 | 15.36 | 18.17 | 19.39 | 21.29 |
| 7 | 13.06 | 14.45 | 16.22 | 18.17 | 19.95 | 22.71 |
| 8 | 14.08 | 14.58 | 16.57 | 19.50 | 21.51 | 23.88 |
| 9 | 14.20 | 14.94 | 17.05 | 21.12 | 21.92 | 23.29 |
| 10 | 14.39 | 15.41 | 18.04 | 22.61 | 25.84 | 27.39 |
| 11 | 14.88 | 15.71 | 18.62 | 22.44 | 23.55 | 26.54 |
| 12 | 14.93 | 16.05 | 18.88 | 23.61 | 24.65 | 26.35 |
| 13 | 15.93 | 17.03 | 19.29 | 25.54 | 26.88 | 28.78 |
| 14 | 17.08 | 18.26 | 21.08 | 25.59 | 26.44 | 31.19 |
| 15 | 16.87 | 18.50 | 20.90 | 24.13 | 26.45 | 29.08 |
| 16 | 17.67 | 19.73 | 22.06 | 27.20 | 28.33 | 31.62 |
| 17 | 118.70 | 20.02 | 22.53 | 27.56 | 28.08 | 30.25 |
| Percentiles | ||||||
|---|---|---|---|---|---|---|
| Age (years) | 5th | 15th | 50th | 85th | 90th | 95th |
| 6 | 13.32 | 14.08 | 15.29 | 19.15 | 19.96 | 22.16 |
| 7 | 13.08 | 14.37 | 16.58 | 19.83 | 20.67 | 21.41 |
| 8 | 13.16 | 14.34 | 16.27 | 20.00 | 21.44 | 23.82 |
| 9 | 13.63 | 14.80 | 16.87 | 20.22 | 22.71 | 25.75 |
| 10 | 14.18 | 15.04 | 18.29 | 23.42 | 25.39 | 25.81 |
| 11 | 15.28 | 16.36 | 19.11 | 22.91 | 24.53 | 26.26 |
| 12 | 15.38 | 16.60 | 19.11 | 23.07 | 23.77 | 26.06 |
| 13 | 15.82 | 17.29 | 19.57 | 23.25 | 24.41 | 26.33 |
| 14 | 16.32 | 17.90 | 20.32 | 24.03 | 24.97 | 26.83 |
| 15 | 16.87 | 18.35 | 21.23 | 24.14 | 25.71 | 28.23 |
| 16 | 17.64 | 18.55 | 20.39 | 24.33 | 25.81 | 27.27 |
| 17 | 16.93 | 18.46 | 21.08 | 24.62 | 26.54 | 29.56 |
| Percentiles | ||||||
|---|---|---|---|---|---|---|
| Age (years) | 5th | 15th | 50th | 85th | 90th | 95th |
| 6 | 48.7 | 51.0 | 54.0 | 60.1 | 65.6 | 69.7 |
| 7 | 49.5 | 51.5 | 56.3 | 62.0 | 67.5 | 72.7 |
| 8 | 52.5 | 53.7 | 59.0 | 66.0 | 72.2 | 78.2 |
| 9 | 53.5 | 55.0 | 60.8 | 71.5 | 75.0 | 79.8 |
| 10 | 54.6 | 57.0 | 64.0 | 77.9 | 81.6 | 89.7 |
| 11 | 57.0 | 59.0 | 64.2 | 75.8 | 78.4 | 84.3 |
| 12 | 57.5 | 61.0 | 67.0 | 79.4 | 82.9 | 86.7 |
| 13 | 60.4 | 62.1 | 68.0 | 82.4 | 86.3 | 95.3 |
| 14 | 64.0 | 66.0 | 73.3 | 87.0 | 89.2 | 99.1 |
| 15 | 63.3 | 67.0 | 73.0 | 82.3 | 88.9 | 94.9 |
| 16 | 67.0 | 71.0 | 75.8 | 88.8 | 92.4 | 101.2 |
| 17 | 67.9 | 71.4 | 76.3 | 88.0 | 92.3 | 98.2 |
| Percentiles | ||||||
|---|---|---|---|---|---|---|
| Age (years) | 5th | 15th | 50th | 85th | 90th | 95th |
| 6 | 48.0 | 49.6 | 53.0 | 62.9 | 65.9 | 70.2 |
| 7 | 48.3 | 51.9 | 57.9 | 64.3 | 66.1 | 71.2 |
| 8 | 49.7 | 51.1 | 57.0 | 67.1 | 69.8 | 75.0 |
| 9 | 53.0 | 54.8 | 60.0 | 70.8 | 72.1 | 75.2 |
| 10 | 53.1 | 57.0 | 63.8 | 77.3 | 79.2 | 84.5 |
| 11 | 55.1 | 59.0 | 65.5 | 73.8 | 76.6 | 80.9 |
| 12 | 54.8 | 59.9 | 65.5 | 74.2 | 77.0 | 82.1 |
| 13 | 58.0 | 61.0 | 65.2 | 72.8 | 75.4 | 77.0 |
| 14 | 59.6 | 62.0 | 67.0 | 75.8 | 77.0 | 79.5 |
| 15 | 59.6 | 63.0 | 68.1 | 77.6 | 79.5 | 80.9 |
| 16 | 60.2 | 63.0 | 67.0 | 74.0 | 78.0 | 84.4 |
| 17 | 60.3 | 62.9 | 68.4 | 76.0 | 81.1 | 86.3 |
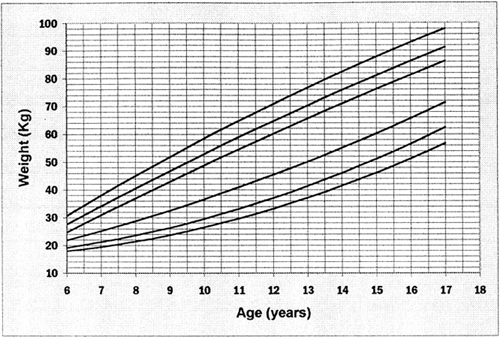
Smoothed percentile curves for body weight (in kilograms) in boys (percentiles are 95th, 90th, 85th, 50th, 15th, and 5th).
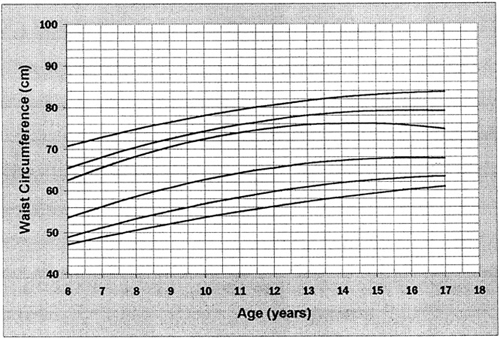
Smoothed percentile curves for waist circumference in girls (percentiles are 95th, 90th, 85th, 50th, 15th, and 5th).
Figure 9 presents the comparison of the 85th percentile for BMI for boys (Figure 9A) and girls (Figure 9B) of this study with recently published curves from Iran. A similar comparison for the 95th percentile is shown in Figure 10 A and 10B with the 95th percentile from Iran and Sweden, respectively.
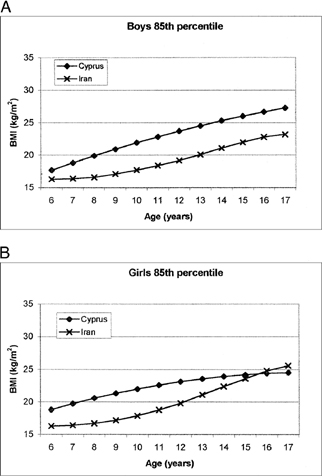
(A) Comparison of the 85th percentile of BMI values in boys from Cyprus with boys from Iran. (B) Comparison of the 85th percentile of BMI values in girls from Cyprus with girls from Iran.
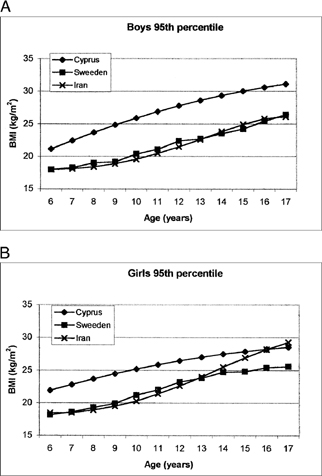
(A) Comparison of the 95th percentile of BMI values in boys from Cyprus with boys from other studies. (B) Comparison of the 95th percentile of BMI values in girls from Cyprus with girls from other studies.
As is obvious from Figures 9A and 10A, boys in Cyprus compare less favorably with boys from Iran and Sweden. Both the 85th and 95th percentiles are higher in Cypriot boys. The 95th percentile in Cypriot boys is ∼3.0 to 4.5 kg/m2 higher than the Swedish boys at the ages of 6 and 17 years. Similar differences are observed with Iranian boys.
Similar differences are also observed in comparing Cypriot girls with Swedish girls, with the Cypriot girls exceeding Swedish girls by 3.0 to 4.0 kg/m2 in the 95th percentile. The same applies to Iranian girls until the age of 16 years, when both the 85th and the 95th percentiles equalize (Figures 9B and 10B).
Discussion
This study presents (for the first time) data on body weight and height, waist circumference, and BMI from a representative sample of Cypriot children ages 6 to 17 years. All previous reports from Cyprus were either not representative or were limited in age range. We also constructed (for the first time) percentile curves for these variables and age group.
Anthropometric measurements, such as body weight and height, are the simplest, easiest to obtain, noninvasive, cheapest, and most widely accepted methods for the evaluation of growth and body composition of children. These measurements also reflect, and are therefore useful in, the evaluation of nutritional status and health of children (1). In the clinical setting, the anthropometric measurements are plotted against percentile plots from a “reference” population that poses acceptably limits of these parameters (1).
Waist circumference has gained major interest because it correlates well with intra-abdominal fat and the metabolic complications associated with it (18) (19) (20) (21) (22) (23) (24) (25). This index is simple and easily obtained; therefore, it can be applied widely in the clinical setting provided that specific cut-offs exist. Although cut-offs for predicting adult risk for certain conditions exist (21), to our knowledge, no specific cut-offs or even reference percentiles are available for children. The presentation, therefore, in this study of waist circumference percentiles can help in further investigation of specific cut-offs in respect to certain metabolic complications of obesity in children.
BMI is the simplest and most widely accepted index used in the evaluation of obesity both in the clinical and the epidemiological setting—not only in adults—but also in children (29). But what is the ideal reference population? It is obvious that the percentiles for weight and height from countries with high socioeconomic status, such as western Europeans, cannot be used for starving countries such as those of central Africa. Similarly, it is questioned whether BMI plots from the United States can be used for other populations. The genetic background of different ethnic groups is also a significant, and perhaps more important, confounder in the distribution of BMI and its relation to body fatness (16). It is doubtful, therefore, whether certain limits of BMI can have an equal significance in risk classification for certain health hazards in different populations. It has been shown recently, for example, that the absolute risk for coronary heart disease mortality is ∼3.5 times greater in the United States and northern Europe than in Japan and southern Mediterranean Europe, after adjustment for certain confounders (30), and blood pressure has variable influence from body fatness.
On the other hand, debate exists to the use of BMI for the evaluation of obesity in growing children because this assessment is complicated by height gain (31) (32); therefore, other means (such as the ratio of weight/standard weight) are proposed for evaluation of obesity in children (32).
Nevertheless, the weight, height, and BMI percentiles can definitely help us in the evaluation of long-term changes of these indices in a given population and the comparison of the obesity status of a given population with other reference populations. This comparison can help the authorities determine the status of obesity in the population and decide whether there is a need to address certain population measures to control the problem. The results of this study, therefore, can be viewed as the baseline data in a long-term observation of the trends of BMI and also of body weight and height in childhood in Cyprus, and hence observe the long-term changes of growth patterns in Cypriot children.
Finally, the comparison of the 95th percentile of our sample with the same curves of the recently published Swedish (as a representative of developed countries) and Iranian (as a representative of developing countries) childhood curves indicates that Cypriot children are heavier than their Swedish and Iranian peers, except girls after the age of 16 years, when the curves equalize both for the 85th and 95th percentiles. This latter finding is interesting and needs further investigation regarding dieting customs of female adolescents and, even more importantly, regarding the presence of possible risk factors for eating-behavior disturbances such as anorexia nervosa.
In conclusion, growth curves for Cypriot children have been constructed for the first time. Much concern should be addressed to the observation that for the majority of the Cypriot sample, the upper BMI limits are higher than the peers of developing and even developed countries.
Acknowledgments
No outside funding/support was provided for this study. We thank the Ministry of Health and the Ministry of Education and Culture. We also thank Mrs. Dora Kyriakides of Statistical Service of the Ministry of Finance for her valuable contribution.


