Specific Modification of Granular Potato Starch by Means of Partial Debranching Using Pullulanase
Abstract
Native potato starch (PS-N) is enzymatically modified in the granular state using pullulanase (PUL) for the purpose of a specific partial molecular degradation of the polymers. The PUL compound is added to the aqueous starch suspension (40%, w/w) and processed. The process parameters are varied systematically (enzyme dosage [ENZ] 4/20 mL; pH of the suspension [pH 4.7/7.3]; hydrolysis temperature [TEMP] 40/50 °C, and hydrolysis duration [TIME] 20/120 min) and a new-developed heat-induced enzyme inactivation approach (storage of the partially dewatered moist starch for 120 min at 100 °C) is intended to terminate the hydrolysis. Morphological (LM, SEM, and CLSM) and thermal characterization (DSC) of the starch products indicate a partial damage of the granules and a partial loss of the semicrystalline structure owing to the heat treatment, which is confirmed by XRD. The molecular properties (SEC-MALS-DRI) are mainly controlled by the factors ENZ, pH, and TEMP, but the intended degradation of the amylopectin (AP) by cleavage of the α-1,6-linkages (debranching) is accompanied by a molecular degradation of the amylose (AM) fraction. However, both specificity of the hydrolysis and achievable gel strength are remarkably improved compared to acid-thinned products.
1 Introduction
For food applications, partially degraded starches are advantageous regarding the industrial processing of highly concentrated solutions (reduced hot paste viscosity[1]) as well as specific functional properties like gelation and formation of mechanically strong gel systems (improved gel strength).[2] The latter involves the development of a 3-dimensional amylose (AM) based network. Because of its interfering effect on the gelation process (molecule dimension, large), the molecular degradation of the amylopectin (AP) fraction is basically intended. However, the largely intact molecular structure of the AM fraction is favored. Since the requirements on the starch's molecular structure are specific, the modification is challenging. Besides the established utilization for, e.g., gelled sweets, such starch products are also suitable for other applications such as cheese analogues.[3]
Acid-thinned (AT; also acid-thinning) starch refers to starch products modified using mineral acids such as hydrochloric acid (high concentration starch slurry [e.g., 40% w/w], which is processed at very low pH below the gelatinization temperature [e.g., stirring at 40 °C]) for several hours or even days followed by neutralization, washing, drying, and grinding of the material.[4] As a result, glycosidic bonds of the starch polymers (α-1,4- and α-1,6-glycosidic linkages) are cleaved and the molar mass (MM) of the starch is reduced, while the granular structure remains basically intact. The acid primarily attacks glycosidic linkages located and accessible in the amorphous regions of the semicrystalline structure.[5] This leads to degradation of amylopectin (AP), in which the AP fraction is preferentially cleaved at its branching points (α-1,6-glycosidic bonds) or nearby.[4, 6] Since the AM is concomitantly degraded to a remarkable extent, the AT can be classified as less specific,[7] despite the fact of certain specificity attributed to the semicrystalline granular structure and associated accessibility for the H3O+.
An alternative modification approach is the (partial) enzymatic hydrolysis of starch in the granular state. While enzymes such as α-amylase or β-amylase cleave α-1,4-glycosidic bonds, debranching enzymes attack specifically α-1,6-glycosidic linkages. The most used debranching enzymes are pullulanase (PUL, EC 3.2.1.41) and isoamylase (EC 3.2.1.68). Both are able to degrade AP, but only PUL is able to debranch pullulan.[8] During the debranching of AP, PUL attacks different molecules randomly instead of degrading one molecule at a time.[9] PUL is produced by a variety of microorganisms (e.g., Klebsiella pneumoniae, Escherichia intermedia, Bacillus acidopullulyticus) and plants (also referred to as R-enzyme, e.g., from oat, rice, pea)[10] and differs in structure and other characteristics. In the present context PUL refers to PUL type I, whereupon four other types have been described differ in substrate or binding specificities.[11] Indeed, most research work related to enzymatic debranching is focussed on production of resistant starch, but partially debranched modified starch products could possibly be a significant alternative for AT starches.
Liu et al.[12] and Babu and Parimalavalli[13] reported a reduced paste viscosity after debranching a gelatinized starch by PUL. Leong et al.[14] and Reddy et al.[15] proved that starch can be enzymatically debranched in its granular state (increase of reducing end groups as a consequence of partial molecular cleavage), leading to a reduction of the hot paste viscosity. However, they used heat inactivation to stop the hydrolysis, resulting a gelatinized starch product after the actual enzymatic modification. A different method includes the removal of the enzyme by precipitating and washing the starch with ethanol (EtOH).[16] It was shown that enzymatic debranching in the granular state reduces the MM of the starch polymers, while the unit chain length distribution remained unchanged verifying selective cleavage of α-1,6-glycosidic linkages. Keeping the molecular structure of the AM fraction largely intact is beneficial for application of the modified starch as gelling agent.[17, 18] However, they did not observe an improvement in the gelling ability of the successfully debranched starch, which was attributed mainly to negative effects of the washing step including EtOH. On the other hand, Chiu[19] and Liu et al.[12] reported that gels with high mechanical strength can be prepared based on starch modified (partial debranching) in the gelatinized state.
Because of the unquestioned potential of PUL inducing a specific molecular degradation of starch polymers and the reported advantages related especially to the achievable gel strength, the present study deals with the systematic enzymatic modification of a potato starch (PS) in the granular state. The impacts enzyme concentration (ENZ), pH of the slurry (pH), hydrolysis temperature (TEMP), and hydrolysis time (TIME) were investigated particularly in terms of controlling the molecular composition of the products (SEC techniques) and the gelling capability. Since the reported limitations of washing with EtOH, the termination of the hydrolysis was aimed by means of a new approach including a heat treatment of the partially dewatered moist starch with the objective of the enzyme inactivation. The associated impact on the granular structure or the expectable changes, respectively, due to limited gelatinization was monitored by different methods (i.e., SEM, LM, CLSM, XRD, DSC).
2 Experimental Section
2.1 Starch and Starch Products
2.1.1 Native Starch
Commercial native granular PS (PS-N; Superior, Emsland-Stärke GmbH, Emlichheim, Germany) was used for the preparation of modified starch samples as initial material. The AM content was 24.5 ± 1.0% w/w. The contents of protein (≤0.1% w/w), ash (≤0.5% w/w), and lipid (≤0.1% w/w) were provided by the supplier. The dry matter content was about 83.83% w/w.
2.1.2 Enzymatic Hydrolysis
The starch modification was performed by applying a debranching enzyme (PUL; solution, Promozyme D6 [4000 NPUN·g−1/4800 NPUN·mL−1/1680 U·mL−1], Novozymes A/S, Bagsvaerd, Denmark) to the granular starch in laboratory scale. Process parameters like enzyme dosage (ENZ, n = 2), pH of the slurry (pH, n = 2), hydrolysis temperature (TEMP, n = 2), and the reaction duration (TIME, n = 2) were systematically varied (statistical design, n = 16).
An aqueous starch suspension was prepared in a glass beaker, placed in a water bath, and continuously stirred (500 min−1). For the preparation of each sample, the respective amount of enzyme solution was added (4 [42 U·g−1 in the final suspension] and 20 mL [210 U·g−1 in the final suspension]), the pH (4.7 and 7.3) and the temperature (40 and 50 °C) of the slurry were adjusted, and the aqueous starch system processed for certain time (20 and 120 min). During modification, the slurry had a starch concentration of 40% w/w with a total mass of 400 g.
After the respective modification the starch material was recovered by filtration in a suction filter with filter paper (cellulose). In a first step, the wet starch material was heated in a climate cabinet at 100 °C for 120 min (termination of the hydrolysis, thermal deactivation), and subsequently stored at 40 °C for about 24 h (drying). The starch product was ground (pulverisette 14, Fritsch GmbH, Idar-Oberstein, Germany; 200 mm mesh), bottled in closed containers and stored at 20 ± 2 °C.
The denotation of the samples was composed of PS-EH- (enzymatically hydrolyzed PS) in combination with the applied process conditions (abbreviations: 4-/20- [enzyme dosage, mL], 4.7-/7.3- [pH of the suspension], 40-/50- [hydrolysis temperature, °C], and 20-/120- [hydrolysis time, min]). For example, PS-EH-4-4.7-40-20 was modified with a dosage of 4 mL enzyme solution at pH 4.7 at 40 °C for 20 min.
Additionally, a blank sample (PS-BLA) was obtained by processing the aqueous starch suspension according to the description above (without enzyme, pH about 5.7…6.0, 40 °C, 20 min), including the partial dewatering by filtration, heating the moist starch at 100 °C for 120 min and subsequent drying at 40 °C for about 24 h (climate cabinet).
The dry matter content of PS-BLA as well as the PS-EH-samples was about 90–92% w/w.
Deionized water was used for the experiments.
2.2 Microscopic Methods
2.2.1 LM/LM-Pol
The starch material was suspended in water, placed between the slide and coverslip. The micrographs were taken using a light microscope (LM; AxioScope A1 equipped with a camera AxioCam ICm1, Carl Zeiss, Germany) under normal (LM) and polarized light (LM-pol). The magnification was set to ×200. The LM images were processed using the blue ZEN Software (Carl Zeiss, Jena, Germany).
2.2.2 SEM
The starch particle surface properties (PS-N: granular, PS-BLA and PS-EH: partially granular, ground product) were investigated using a ZEISS DSM 982 Gemini microscope (Carl Zeiss AG, Oberkochen, Germany) equipped with a wolfram cathode. The samples were affixed with double-faced adhesive tape on the sample carrier and sputtered with Au with a layer thickness of about 15 nm (SCD 030, Balzers Union, Balzers, Liechtenstein). The micrographs were taken at a magnification of ×200, ×500, and ×1000, respectively.
2.2.3 CLSM
Images of stained starch samples were taken using an upright Leica TSC SP 5 II confocal microscope (Leica Microsystems, Wetzlar, Germany) equipped with a dedicated hybrid detector (HyD) and an acousto-optical beam splitter (AOBS) system using an oil immersion total internal reflection fluorescence (TIRF) objective (Leica PLAN APO 100×1.47 Oil).
For the visualization of specific starch structures, different fluorophores had been used, 8-amino-1,3,6-pyrenetrisulfonic acid (APTS) for specific labeling of the reducing ends of the starch polysaccharides and rhodamine for growth ring structure unveiling.
A mass of 2 mg of starch powder was suspended in 4 µL of freshly prepared APTS solution (20 mM) dissolved in 15% acetic acid. Briefly, 4 µL of 1 M sodium cyanoborohydride was added and the staining was performed according to Blennow et al.[20] with minor modifications. After washing for five times, the samples were suspended in 40 µL 50% glycerin/water, and 20 µL of the dispersion were mounted on glass slides afterwards and directly used for microscopy (settings: excitation wavelength 𝜆 = 488 nm, detection 𝜆 = 500–535 nm).
Rhodamine staining of the starch samples was performed according to van de Velde et al.,[21] except for the addition of sodium azide. After staining, the samples were washed five times with 40 µL water und suspended in 40 µL 50% glycerin/distilled water. For CLSM imaging, 20 µL of the dispersion were mounted on glass slides and directly used for microscopy. Fluorescence signals were detected in the range from 𝜆 = 590 to 640 nm with an excitation wavelength of 𝜆 = 561 nm. The laser intensity was set to 1–2% for imaging.
2.3 XRD
The starch samples were investigated on uniformly fine powders using X-ray diffraction (XRD). Random amounts of the powders were analyzed using a Bruker D2 PHASER diffractometer (Bruker Corporation, Billerica, MA, USA) from 3° to 40° 2𝜃 using Cu-K𝛼 radiation (30 kV x 10 mA−1; step size 0.01° 2𝜃; time/step: 0.5 s). The diffractograms were evaluated using peak separation and analysis software PeakFit Version 4.12, and the crystallinity (Xc) was determined (Xc = [1 − (A/T)] × 100 [%]) based on the calculated peak area related to the amorphous background (A) and the corresponding total area of the diffractogram (T).
2.4 Pasting Profile
The pasting properties of PS-N, PS-BLA, and selected enzymatically modified samples were determined using a rotational rheometer (MCR 302, Anton Paar GmbH, Graz, Austria) equipped with a special starch cell (ST24-2D/2V/2V-30). The method was analogous to measurements using a rapid visco analyzer (RVA), and the conditions applied were basically in accordance with the description by Asiri et al.[22] with modifications. A volume of 35 mL of a 6% w/v starch suspension was transferred to the measuring cell. The analysis was carried out at 200 min−1 at the following conditions: isotherm at 20 °C (section I, 1 min), heating from 20 to 96 °C (section II, rate: 2.5 K min−1), isotherm at 96 °C (section III, 20 min), cooling to 25 °C (section IV, rate: 4.0 K min−1), and isotherm at 25 °C (section V, 25 min) and viscograms obtained basically according to RVA pasting profiles. The viscosity of the aqueous starch system recorded was dependent on the measuring system (e.g., volume and geometry) and hence a relative value.
2.5 Solubility
The solubility (S) was determined according to Ulbrich et al.[18] with modifications. Starch dispersions were prepared by processing 7.5% w/w starch suspensions at 70 and 90 °C (30 min, water bath, stirring) and subsequent dilution with water to 2.5% w/w. An aliquot of 30 g was centrifuged at 11,180 × g for 15 min (Biofuge 28RS, Heraeus, Hanau, Germany), and a volume of the supernatant of 0.5 mL was mixed with 4.5 mL DMSO. The starch concentration was determined by means of SEC-MALS-DRI, and the starch's S calculated [%].
2.6 DSC
The thermal gelatinization properties of the native granular PS, the BLA, and EH samples were examined using DSC (DSC 204 F1 Phoenix equipped with an intercooler, Netzsch, Selb, Germany).[23] The starch powder was weighted in an aluminum pan, water was added (4–7 mg starch, about 20–35 µL water, ratio of about 1:5) and the crucible hermetically sealed before measurement. The scanning conditions were as follows: the initial temperature was kept at 20 °C for 2 min (isothermal segment), ramped to 100 °C at a heating rate of 10 K·min−1 (non-isothermal segment, heating), maintained at 100 °C for 2 min (isothermal segment), and then cooled to 20 °C with a rate of 40 K·min−1 (non-isothermal segment, cooling). The thermograms were evaluated in terms of gelatinization temperatures (To, Tp, and Tc) and ∆Hgel (Netzsch Proteus thermal analysis-Version 7.1.0 software). The experiments were performed in quadruple determination, and the arithmetic mean as well as the corresponding standard deviation were calculated.
2.7 Molecular Characterization
The molecular characterization of the starch samples was basically in accordance with the methodical description by Ulbrich et al.[24] with minor modifications.
Preparation of Solutions
Starch solutions were prepared by heating aqueous dispersions of 2.5% w/w in an autoclave (Model I, Carl Roth GmbH & Co. KG, Karlsruhe, Germany) to 145 °C under continuous stirring (300 min−1) for 30 min and subsequent high-shear-treatment using an Ultra-Turrax T25 (IKA-Werke GmbH & Co. KG, Staufen, Germany) at 24 000 min−1 for 2 min at about 80 ± 5 °C. An aliquot of the dispersion was diluted 1:10 v/v in preheated DMSO (2.5 mg∙mL−1), and the stabilized solution was passed through a 5 µm PTFE filter (Carl Roth GmbH & Co. KG, Karlsruhe, Germany) before analysis (SEC-MALS-DRI).
Enzymatic Debranching for Analytical Purpose
A volume of 10 mL of the freshly prepared starch solution (2.5% w/w) was tempered to 40 °C and a volume of 83 µL of the PUL enzyme solution Promozyme D6 (4000 NPUN·g−1/4800 NPUN·mL−1/1680 U·mL−1; Novozymes A/S, Bagsvaerd, Denmark) was added. The dispersion was stirred at 40 °C for 20 min (complete debranching), and the solution subsequently heated to 95 °C and tempered for 20 min for termination of the PUL. The solution was diluted 1:10 w/v in preheated DMSO and passed through a 5 µm PTFE syringe filter (Carl Roth GmbH & Co. KG, Karlsruhe, Germany) before analysis.
Separation System
The molecular characterization was carried out by means of SEC-MALS-DRI. The separation was executed with a SEC-3010 module (WGE Dr. Bures GmbH & Co. KG, Dallgow-Döberitz, Germany) including degasser, pump, and auto sampler connected to a MALS detector and a differential refractive index detector (DRI). The MALS detector was a Bi-MwA (Brookhaven Instruments Corporation, Holtsville, NY, USA) fitted with a diode laser operating at 𝜆 = 635 nm and equipped with seven detectors at angles ranging from 35° to 145°. The DRI was a SEC-3010 RI detector operating at 𝜆 = 620 nm. Three columns in a row were used: AppliChrom ABOA DMSO-Phil-P-100 (100–2500 Da), P-350 (5–1500 kDa), and P-600 (20 to >20 000 kDa) (Applichrom, Oranienburg, Germany). The samples were eluted with degassed DMSO (Carl Roth GmbH & Co. KG, Karlsruhe, Germany) containing 0.1 M NaNO3 at a flow rate of 0.5 mL·min−1 and a temperature of 70 °C. During the sample, the data from the MALS and DRI detectors were collected and processed using ParSEC Enhanced V5.61 chromatography software to give the concentration (ci) of the eluted solution and MM at each retention volume (Mi). MwST was calculated. The basis for the molecular characterization by means of SEC-MALS-DRI had been described elsewhere.[25, 26]
The separation system was additionally calibrated (SEC-cal-DRI) using a set of 10 pullulan standards (800k, 400k, 200k, 110k, 50k, 22k, 10k, 6k, 1.3k, and 342; PSS Polymer Standards Service GmbH, Mainz, Germany) as well as Glc with a MM range between 180 and 805 000 g·mol−1. The standards were dissolved in DMSO (2.5 mg·mL−1 w/v) and gently stirred 24 h at 80 °C. The standard solutions were measured and the elution volume at the position of the peak maximum was used as the reference for the particular Mi and the calculation of the calibration curve.
Peak Separation
The SEC chromatograms (enzymatically debranched for analytical purpose) were advanced analyzed using peak separation and analysis software PeakFit Version 4.12 as described elsewhere.[27] Based on the fitted SEC chromatograms, single peaks (chromatograms) representing different fractions (AM/degraded AM fraction, AP branch chain [APBC] fraction, chromatogram originated from enzyme solution [no importance attached]) were identified and calculated. The values of Mw were calculated by means of the correspondent separated chromatogram and the MM curve (fit) from the MALS-detector (SEC-MALS-DRI; MwAM) or the standard calibration curve (SEC-cal-DRI; MwAPBC), respectively, according to the description elsewhere.[28, 29]
Chromatograms representing the AP fraction of the samples were calculated based on the SEC chromatograms of the starch sample (ST, not enzymatically debranched for analytical purpose) by subtracting the chromatogram of the respective AM fraction (obtained based on the enzymatically debranched sample for analytical purpose and mathematical peak separation; description before). MwAP was calculated based on the obtained chromatogram (ci, AP) and the MM curve (fit) of the starch (Mi, ST).
2.8 Gel Strength
Gels were prepared on the basis of the freshly disintegrated starches (7.5% w/w; PS-N, PS-BLA, and PS-EH [n = 16]) and characterized according to the description elsewhere.[2]
Preparation of Concentrated Starch Dispersions and Preparation of Gels
Firstly, starch pastes were prepared by heating aqueous suspensions of 7.5% w/w in an autoclave (Model I, Carl Roth GmbH & Co. KG, Karlsruhe, Germany) to 145 °C under continuous stirring (300 min−1) for 20 min and subsequent high-shear-treatment using an Ultra-Turrax T25 (IKA-Werke GmbH & Co. KG, Staufen, Germany) at 24000 min−1 for 2 min at about 80 ± 5 °C. Moreover, gels were casted in containers (diameter 30.0 mm, height 20.0 mm), covered and storage for 7 d at 5.5 ± 1.5 °C.
Mechanical Compression Test
A fresh and planar surface was realized by cutting the gels. The mechanical strength of the gel system was determined by compression using a texture analyzer (Test Control II, Z1.0, 1kN, Zwick/Roell, Ulm, Germany) equipped with a cylindrical penetration probe (diameter 25.4 mm). The peak force (N) of the first penetration was taken as gel strength. Gel preparation and measuring its hardness were carried out in triple determination. The arithmetic average (x) and the corresponding standard deviation (s) were calculated.
2.9 Statistical Evaluation
The impact of the different modification parameters (ENZ, n = 2; pH, n = 2; TEMP, n = 2; TIME, n = 2) on the DSC gelatinization properties (To, Tp, Tc, and ΔHgel) and molecular data (MwST, MwAM, MwAP, and MwAPBC) were investigated based on an experimental design (n = 16) using Statgraphics Plus 5.0 software. The values for the probability of error (p-value) were listed in the p-value table (analysis of variance; Table 1). With a p-value less than 0.05, the factor investigated had a statistically significant effect at a 95.0% confidence level (boldface type in the p-value table). Additionally, selected results from the statistical evaluation were summarized in mean and interaction diagrams showing the calculated means of each category and the confidence interval with a 95.0% confidence level.
| Gelatinization properties | Molecular properties | |||||||
|---|---|---|---|---|---|---|---|---|
| Factor Single | To | Tp | Tc | ΔHgel | MwST | MwAM | MwAP | MwAPBC |
| ENZ | 0.0704 | 0.0147 | 0.0145 | 0.9861 | 0.0001 | 0.0007 | 0.0002 | 0.7355 |
| pH | 0.1161 | 0.3557 | 0.4827 | 0.9155 | 0.0001 | 0.0012 | 0.0001 | 0.0919 |
| TEMP | 0.0042 | 0.3286 | 0.7015 | 0.4967 | 0.0386 | 0.0244 | 0.0428 | 0.0785 |
| TIME | 0.0032 | 0.8504 | 0.9129 | 0.4855 | 0.7404 | 0.7317 | 0.7005 | 0.0217 |
| Interaction | ||||||||
| ENZ-pH | 0.3002 | 0.8745 | 0.7297 | 0.9831 | 0.0004 | 0.0030 | 0.0005 | 0.2677 |
| ENZ-TEMP | 0.3929 | 0.3592 | 0.6378 | 0.9800 | 0.9074 | 0.7112 | 0.9636 | 0.1658 |
| ENZ-TIME | 0.0274 | 0.7618 | 0.8421 | 0.5805 | 0.7787 | 0.8523 | 0.8135 | 0.6142 |
| pH-TEMP | 0.1308 | 0.7161 | 0.6830 | 0.2388 | 0.8369 | 0.9110 | 0.8551 | 0.0030 |
| pH-TIME | 0.2595 | 0.5381 | 0.2400 | 0.6217 | 0.1054 | 0.1073 | 0.1027 | 0.3110 |
| TEMP-TIME | 0.0069 | 0.4652 | 0.3479 | 0.5363 | 0.6128 | 0.7044 | 0.7547 | 0.0885 |
- Boldface type: since p-values are less than 0.05, these factors have a statistically significant effect on the respective dependent variable at the 95.0% confidence level.
3 Results and Discussion
3.1 Characterization of the Starch Powder/Morphological Characterization
3.1.1 SEM and LM
The effect of the modification procedure on granule morphology was investigated by different microscopic methods. Figure 1 shows the SEM micrographs (1–3) as well as the LM micrographs (4–5) of PS-N, PS-BLA, and two different PS-EH samples.
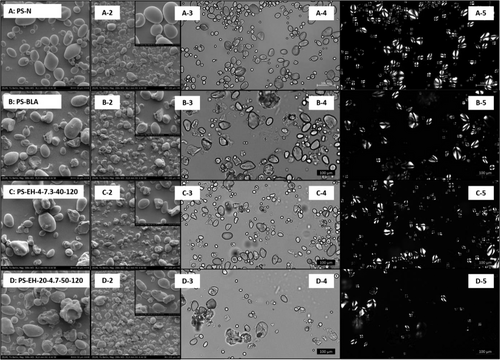
Figure 1A shows PS-N with individual granules clearly visible (Figure 1A-4/5) and showing birefringence (Figure 1A-5; the appearance of a Maltese cross) in polarized light. The latter results from the presence of ordered molecular structures and is characteristic for largely intact semicrystalline starch granules. In comparison, some of the granules of PS-BLA (Figure 1B-4/5) appear to be damaged, resulting in irregular shapes and loss of birefringence most likely induced by swelling and gelatinization of single granules during processing. The inactivation and drying step after the hydrolysis involved partial dewatering of the granular starch and subsequent heating at 100 °C for 120 min. Although the gelatinization temperature is significantly increased at reduced water content (Qi and Tester[30]), gelatinization of part of the granules occurred and is ensured, respectively, even though most of the starch granules remained intact. In addition, micrographs of the enzymatically modified samples with the lowest (Figure 1C-4/5, PS-EH-4-7.3-40-120) and the highest (Figure 1D-4/5, PS-EH-20-4.7-50-120) degree of degradation show, similar to the PS-BLA, gelatinized starch material on the one hand (loss of semicrystalline character) and granules appear to be not noticeably influenced by the modification on the other hand.
This is basically confirmed by the SEM images shown in Figure 1A–D1–3. Even at high magnification, no alteration of the surface is visible beyond that caused by gelatinization. It can be expected that the intermolecular bonds stabilizing the starch granules remain mostly unaffected by the cleavage of glycosidic linkages. Therefore, it is reasonable to assume that debranching can occur without causing visible morphological changes. Li et al.[31] and Asiri et al.[17] on the other hand, reported a slight change of the granule surface as a result of molecular cleavage by means of PUL. In the present study it is difficult to distinguish from damage originated by enzymatic hydrolysis intrinsically and partial gelatinization/melting.
3.1.2 CLSM
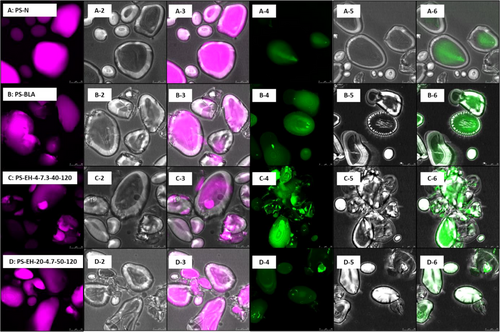
CLSM micrographs were taken for selected samples (PS-N, PS-BLA, PS-EH-4-7.3-40-120 [lowest degree of molecular degradation] and PS-EH-20-4.7-50-120 [highest degree of molecular degradation]) stained with two different fluorophores (rhodamine and APTS). APTS reacts specifically with the reducing ends of the molecules resulting a 1:1 stoichiometric ratio of molecule labeling. Since its lower MM, AM contains a much higher molar ratio of reducing ends per AGU compared to molecules from the AP fraction. This results basically a higher by-weight labeling of the AM fraction enabling the distinction of the two molecule structure fractions by means of CLSM or virtually visualizing the distribution of AM and AP within the granular structure.[32, 20]
Figure 2 summarizes the images. The PS-N is characterized by individual and intact granules differing in size and shape (Figure 2A-1-6), which corresponds with the results from SEM and LM. In contrast, the not-modified processed reference starch product (PS-BLA, Figure 2 B-1-6) showed indications for damaged and partly impaired granules, respectively, most probably due to partial gelatinization/melting (partial loss of semicrystalline structure) as well as processing including, i.e., grinding. However, the starch polymers appear to be located within the granular structure. The enzymatically modified starch samples also showed an altered granular structure (Figure 2C-1-6,D-1-6). On the one hand, nearly intact granules were found and on the other hand, strongly impacted structures were identified. Apparently, part of the starch polymers existed dispersed outside the granules suggesting that the molecular degradation promoted leaching effects. Still, this is speculative since the observations were not systematically with respect to the degree of molecular degradation. Moreover, the influence of residual enzyme protein on the fluorescence (local intensity) is unknown, possible misinterpretation of the CLSM micrographs is not unlikely, and the images show finally just a very small detail potentially not representative for the whole sample and hence only an indication.
3.1.3 XRD
Figure 3A shows the XRD diffractograms of two native common starches of different crystalline modification (B-type: PS-N, A-type: CS-N [native regular corn starch]).[33] Remarkable differences in terms of the scattering pattern are obvious and are characterized basically by different intensities of peaks at the Bragg angles (2θ) of about 5.70°, 11.60°, 14.30°, 15.30°, 17.10°, 19.70°, 22.3°, and 24.10°, which is indicated (Figure 3A).
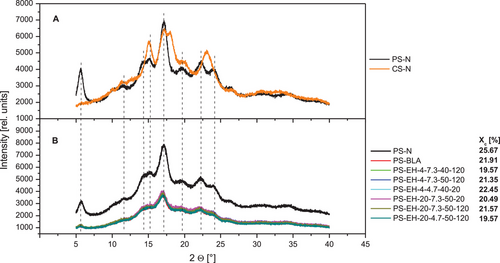
The XRD patterns of the PS-N, PS-BLA, and different degraded starch samples are shown in Figure 3B. While there is a large difference between PS-N and PS-BLA, the investigated modified samples are practically indistinguishable from PS-BLA. The positions of peaks in the diffractograms are the same for all samples, but the intensity is generally lower in the processed samples (including PS-BLA) compared to PS-N, indicating a partial disruption of starch crystallites (Wang et al.[34]). Based on the scattering pattern and peaks at characteristic 2θ (Figure 3A,B), the crystalline structure of the processed samples was identified as B-type characteristic for PS (Vasanthan et al.[35]). The results indicate that neither the modification nor the heat treatment resulted in a major reordering of the double helices, a prerequisite for a change of the crystal type. Zobel et al.[36] reported a change from B- to A-type for PS during HMT.
Xc of the investigated starch samples was determined and the values presented in Figure 3B. A lower Xc of the processed starch samples (PS-BLA and PS-EH samples) was determined compared to PS-N, which is attributed to the partial gelatinization of the granules during the thermal treatment (Zobel et al.[36]) and confirmed by the previous observations (SEM, LM, and CLSM). It should be noted that the dry matter content of the processed samples was slightly higher (90–92% w/w) compared to PS-N (about 84% w/w) resulting probably higher Xc for the PS-N (overestimated) or lower Xc (underestimated) for the processed samples.
3.2 Swelling Properties
3.2.1 Pasting Profiles
Figure 4 shows the pasting profiles of the native starch (PS-N), the processed starch (PS-BLA) and two enzymatically modified starches exemplarily for low (PS-EH-4-7.3-40-120; Mw about 38.6 ×10⁶ g·mol−1) and high degree of molecular degradation (PS-EH-20-4.7-50-120; Mw about 4.90 ×10⁶ g·mol−1). The viscogram of the PS-N was typically with the characteristic high peak viscosity at about 80 °C during heating (segment II) and the remarkable decrease up to the end of the isothermal segment at 96 °C (segment III).[37, 38] The significant decrease of the peak viscosity and increase of the pasting temperature (maximum peak viscosity) of PS-BLA compared to PS-N could be ascribed mainly to the processing of the sample including i.a. annealing (ANN)[38] and heat moisture treatment (HMT),[39-42] but a certain impact due to mechanical treatment[43] of the starch (milling/grinding; PS-BLA and PS-EH-samples) seems possible, too. The partial molecular degradation (PS-EH-samples) decreased the peak viscosity systematically according to the respective degree of conversion.[40,44, 45] However, in the course of the section III and in the subsequent sections IV and V, the relative viscosity of PS-BLA as well as the PS-EH-samples were higher compared to that of PS-N (Figure 4).
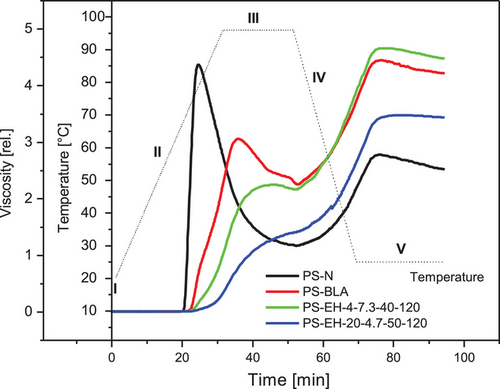
Since the solution state of the investigated starch samples is limited and presumably different due to varying processing and treatments (PS-N: native, not processed; PS-BLA: no molecular degradation, processed; PS-EH-samples: molecular degradation, processed), the level of the relative viscosity obtained in section V should not associated particularly with the gel hardness. It supposably reflects mainly the (comparatively) high flow resistance of the paste because of the reduced temperature (viscosity as a function of the temperature), beginning retrogradation and intensified particle–particle interaction (friction). The development of a 3-dimensional gel network consisting mainly of AM with AP embedded in is, however, unlikely.
3.2.2 Solubility
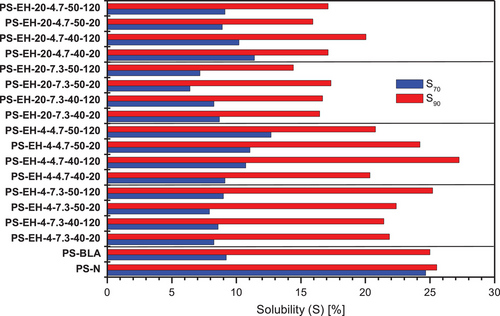
The polymer solubility (S) of all starch samples was determined based on aqueous 7.5% w/w starch dispersions heated to 70 and 90 °C, respectively. The calculated values of S are summarized and displayed in Figure 5. The S of PSN was found nearly independent on the dispersion temperature at about 25%. The S for PS was repoted approximately in the same range.[46] In contrast, all processed starch samples had a strongly reduced S when dispersed at 70 °C (S70). The S70 of PS-BLA was about 9% and the values determined for the enzymatically modified starches varied between 6% and 13%. However, enhanced dispersion temperature of the processed starch samples (PS-BLA and PS-EH-samples) enhanced S significantly to values between 15% and 27% (S90). Particularly the low S70 of all processed starch samples could be ascribed to the molecular changes induced by ANN and HMT. Increasing S with increasing dispersion temperature on the one hand and changes in the starch's S due to HMT as well as ANN on the other hand were reported by Liu et al.[47] HMT of starch can result in reduced S.[48] Reasons for lowered S are probably internal rearragements and formation of more ordered double helical structures owing to hydrothermal treatment.[49] In contrast, an enhancement of S due to partial molecular degradation of the starch (granular, AT) was reported elsewhere.[50]
3.2.3 DSC
The DSC gelatinization data (To, Tp, Tc, and ΔHgel) were collected for the PS-N, the starch sample which subjected to the thermal inactivation process (PS-BLA, no enzymatic modification) and the enzymatically modified starch samples (PS-EH samples). Compared to PS-N (To = 61.9 ± 0.22 °C, TP = 66.93 ± 0.36 °C, Tc = 73.25 ± 0.58 °C, ΔHgel = 16.12 ± 0.60 J·g−1), the values obtained for PS-BLA (To = 65.93 ± 0.35 °C, TP = 72.90 ± 0.66 °C, Tc = 78.13 ± 0.67 °C, and ΔHgel = 8.85 ± 0.29 J·g−1) were remarkedly changed. On the one hand, ΔHgel decreased about 45%, and on the other hand, the transition temperatures were found to be shifted about 5 K to higher values.
The reduction of ΔHgel reflects primarily the loss of double helices[51] and indicates a partial gelatinization of PS-BLA during processing, confirming the microscopical observations discussed before. Some of the granules have been damaged most likely during the initial phase of the inactivation/drying step when the moisture content was still high enough allowing sufficient movement of the molecules. It can be assumed that the weakest structures are damaged first, contributing to the increase of To. Moreover, the increase of the transition temperatures may result from molecular alignment. Such processes are generally referred to as ANN and HMT and occur above the glass transition temperature (Tg) and below To. Above Tg, polymer chain movement is possible, resulting in reorganization of the starch polymers and particularly AP double helices.[30]
In excess water, the Tg of starch is approximately at room temperature (Zeleznak and Hoseney,[52] Mizuno et al.[53]) and the process of reorganization is referred to as ANN. It results improved alignment of double helices, correction of structural defects within crystalline regions, and minor optimizations of double helix length (Tester and Debon[54], Vamadevan et al.[55]). In principle, HMT refers to the same processes at limited moisture content (10–30% w/w) on the one hand, and at higher temperatures on the other hand (usually in the range 90–120 °C[56]).
Regarding the modification-involved processing and subsequent inactivation and drying procedure applied in the present study, the enhanced transition temperatures are assumed to result from a combination of ANN presumably predominantly during the modification (PS-BLA; suspension, processed for 120 min at 40 °C) and initial phase of the inactivation/drying step, and HMT accordingly predominantly during the late phase of the inactivation/drying (reduced water content, 120 min at 100 °C).
The enzymatic modification changed the DSC swelling behavior and the characteristic parameters, respectively. Compared to PS-BLA, the respective transition temperatures of the modified samples were higher ranging between 65.93 and 69.80 °C (To), 73.73 and 76.27 °C (Tp) as well as 78.87 and 82.13 °C (Tc), and ΔHgel was found to be in the same range or slightly lower (6.54–9.85 J·g−1).
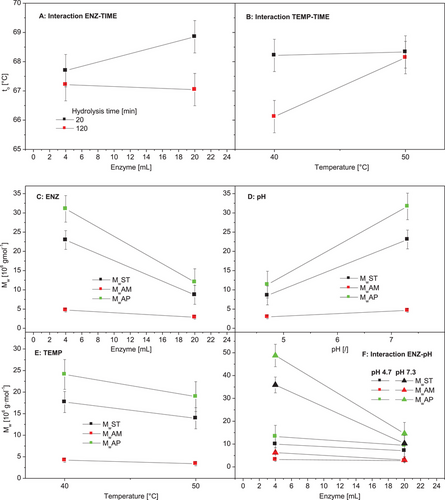
The impact of the varied modification parameters on the characteristic DSC transition temperatures and ΔHgel was investigated statistically by means of ANOVA. The p-value table is presented in Table 1. The single factors temperature (TEMP) and time (TIME) had a statistically significant impact on To, since the p-values were lower than 0.05 (Table 1). Increasing TEMP enhanced To, but an increased TIME lowered it. Also, combinations (an interaction of two factors) with contribution of TEMP and TIME, respectively, were identified to impact To significantly (Table 1). The specific effects are visualized based on the interaction plots (Figure 6A,B). Increasing enzyme concentration (ENZ) increased To significantly in the case of short hydrolysis (``time’’; Figure 4A), and an enhanced hydrolysis duration led to reduce To exclusively at lower hydrolysis temperature (Figure 6B). Enhancement of the enzyme dosage (ENZ) from 4 to 20 mL increased Tp and Tc significantly (Table 1). Since none of p-values was lower than 0.05, a systematically impact of one of the investigated modification parameters on ΔHgel was not found (Table 1).
Effects of the enzymatic modification inherently (partial molecular degradation) as well as different varied modification factors on the gelatinization behavior were found. Increased transition temperatures were reported for degraded starch (acid-thinned) elsewhere[57, 27] and attributed to the fact that the acid treatment involved molecular degradation weakens the amorphous regions of the semicrystalline structure and therefore reduces the effect of cooperative melting during gelatinization. Additionally, it was suggested that the hydrolysis leads to the formation of longer amylopectin double helices because the geometric constrains of the amorphous layer are reduced.[58]
However, Asiri et al.[17] and Ulbrich et al.[18] found no effect of enzymatic debranching on To and Tp, but both studies reported a decrease of Tc. Li et al.[31] reported that the comparatively strong hydrolysis was coincided with a reduction of ΔHgel and increasing gelatinization temperatures, while Li et al.[16] found a decrease of transition temperatures in debranched rice starch products.
3.3 Molecular Properties
Figure 7 shows the chromatograms of the native starch (PS-N), the processed starch without modification (PS-BLA) and two enzymatically modified starch samples reflecting a low (PS-EH-4-7.3-40-120) and a high (PS-EH-20-4.7-50-120) degree of molecular degradation, respectively. No significant difference was found between PS-N and PS-BLA showing evidently that the several processing steps including i.a. ANN, partial gelatinization/melting and grinding did not affect the molecular structure. In contrast, the semicrystalline structure was altered remarkedly (see Section 3.1).
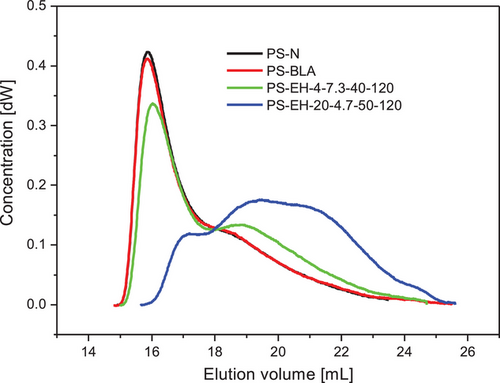
As expected, the starch modification using the debranching enzyme PUL changed the molecular properties. The shape of the chromatograms was altered, and the chromatogram area was shifted to higher elution volume due to partial molecular degradation. The chromatogram peak between 15 and about 18 mL, which represents mostly the AP fraction (Figure 7; PS-N and PS-BLA), was successively reduced and a molecular structure formed including potentially branched dextrins of different DP (degree of polymerization) and probably single APBC (released) in the range of 18–25 mL elution volume (Figure 7; PS-EH-20-4.7-50-120). Comparatively rigorous modification conditions resulted in a high degree of molecular degradation due to cleavage of primarily α-1,6-glycosidic linkages within the branched structure fraction of the starch polymers.
The enzymatical treatment of the granular starch was intended for a specific partial MM reduction of the starch polymers, particularly the highly branched AP fraction. However, the obtained data allow to conclude that the modification incorporated the partial cleavage of both α-1,6-linkages (branching points) and α-1,4-linkages (linear polymer sections). Based on the ANOVA and calculated p-values (Table 1), the factors ENZ, pH, TEMP, and ENZ-pH (interaction) were identified to have a statistically significant impact on MwST, MwAM, and MwAP. The values decrease with increase of the enzyme dosage (ENZ, Figure 6C), with decrease of the pH of the aqueous suspension during modification (pH, Figure 6D) and with increase of the hydrolysis temperature (TEMP, Figure 6E). The decrease of MwST, MwAM, and MwAP with increasing enzyme dosage (ENZ) was strongly dependent on the pH and occurred mainly at pH 7.3. At pH 4.7, an effect of the factor ENZ was not visible (Figure 6F).
The parameters TIME as well as pH-TEMP (interaction) were statistically significant on MwAPBC, i.e., the molecular composition of the BC of the branched molecule fractions changed. This fact and the remarkable degradation of the AM fraction are indications for cleavage of α-1,4-linkages, alongside the purposed debranching.
For visualization of differences regarding the molecular composition, chromatograms of the PS-EH samples were exemplarily compilated and compared in terms of the different impacts and their effect on the starch's molecular structure. Figure 8A,B shows the impact ENZ for both pH levels investigated. At the high pH (Figure 8A) the shifts of the chromatograms due to enhancement of the enzyme dosage (ENZ) were remarkably on the one hand, but the differences at low pH were not that pronounced (Figure 8B). Most likely, the pH of the starch suspension of 4.7 causes conditions beneficial for (additional) acid hydrolysis reducing the effect of ENZ (Figure 6F, interaction plot). Inversely considered the gradation of the pH had a greater effect on the molecular composition at low enzyme dosage (4 mL, Figure 8C) compared to the higher enzyme concentration in the suspension (20 mL, Figure 8D). The effect of graded hydrolysis temperature on the molecular composition is shown in Figure 8E,F.
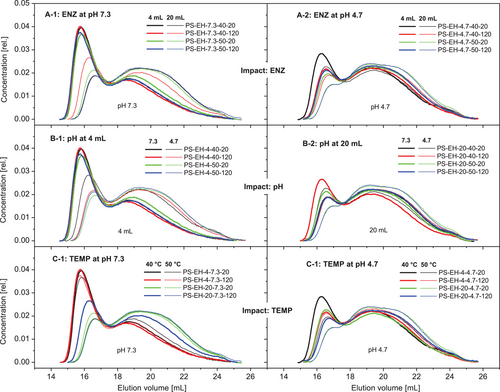
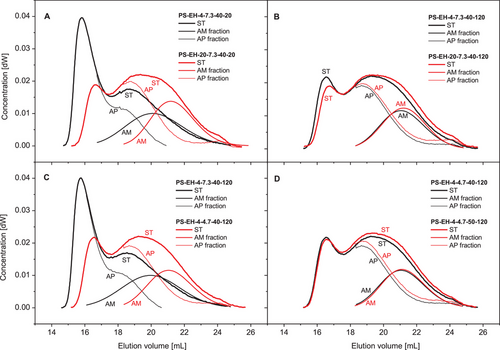
In contrast to the initial expectation, the molecular degradation using the debranching enzyme PUL was in all appearance not limited to the α-1,6-glycosidic linkages and consequently not limited mostly to the highly branched AP fraction. Since the molecular degradation of the AM fraction was evidently shown (Table 1, Figure 6C–F) and the average DP of the APBC fraction was impacted by a single (TIME) and an interaction factor (pH-TEMP, Table 1), the cleavage of α-1,4-linkages concomitantly to the partial debranching should be implied (AM and AP fraction) and considered.
Figure 9 illustrates the molecular changes of both structure fractions due to modification exemplarily for the factor ENZ (Figure 9A,B), the factor pH (Figure 9C), and the factor TEMP (Figure 9D) based on the SEC chromatograms. The degree of degradation of the AM fraction corresponds well with that of the starch (ST) and the respective AP fraction. The present results show that particularly the AM is exposed to significant chain cleavage even when modification is performed with a debranching enzyme system, and not excluded. The intended degradation of the branched structures is accompanied with the partial hydrolysis of polymers from the AM fraction, which is attributed to a side activity of the technical enzyme solution reported previously by Vorwerg et al.[59]
3.4 Gel Strength and Examination of the Specificity of the EH Compared to the AT Process
The mechanical strength of aqueous starch gels is one of the most important attributes when using the starch essentially as gelling agent. The values of the gel strength (compression test) obtained for the investigated samples (PS-BLA and PS-EH samples) are summarized in Figure 10A and displayed sorted according to the MwST. The PS-BLA had a gel strength of about 2 N, which is comparatively low and was basically expected for the non-degraded PS (reference). Another two enzymatically modified samples were conspicuous due to the unexpected low gel hardness (PS-EH-4-7.3-50-20 [4.71 ± 0.77 N], PS-EH-20-4.7-40-20 [4.65 ± 0.13 N]). All the other PS-EH starch samples had a comparatively high (about 10–14 N) or even very high (up to about 16–17 N) gel strength. This classification of the enzymatically modified starches is suitable in the context, since the ability to form mechanically strong gel structures was examined comprehensively in an earlier study based on AT starches (similar gel preparation procedure, highest gel strength between 8 and 10 N).[7, 60] In contrast to the present study, an optimum MwST was found for AT starches,[60] which was apparently not the case when modified with PUL.
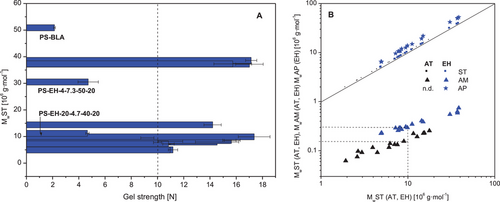
Figure 10B shows basically the MwAM as a function of MwST for partially degraded starches derived from different degradation approaches (EH: n = 16, present study; AT: n = 16, earlier study based on regular PS [Ulbrich and Flöter[7]]). Since a calculation of the molecular composition of the AP fraction was performed in the present study, the MwAP is also displayed in Figure 8B. Comparing the values of MwAM based on both different hydrolysis processes, a quite distinct difference is obvious. At same MwST, the MwAM was significantly higher when modified with PUL, which evidently demonstrates the perceptibly higher specificity of the polymer degradation with PUL (EH) compared to that with acid (AT). For example, at MwST of 10 ×106 g·mol−1 the AM fraction of the EH samples had a Mw of nearly 300 000 g·mol−1, whereas that of the AT was about 150 000 g·mol−1. This huge difference reconfirms the acid-induced cleavage of both α-1,6- (some branches in the AM fraction) as well as α-1,4-glycosidic linkages occurring within the polysaccharide structure during the AT process on the one hand, and the concurrent advantage of the modification using PUL on the other hand. The results relating to the gel strength quasi verify the strong dependence of the functional properties on the molecular composition of the starch and particular the MM of the AM fraction.
4 Conclusions
An enzymatic modification of granular PS was successfully performed using PUL, and a new-developed heat-induced enzyme inactivation approach applied to terminate the hydrolysis reaction.
The modification method based on a technical grade enzyme compound was found to be appropriate to produce granular partially degraded starch products, and particularly the enzyme dosage (ENZ), the pH of the slurry (pH), and the hydrolysis temperature (TEMP) were found to be factors controlling the extent of the depolymerization. The specificity of the molecular degradation in terms of the polymer structure fraction (AP/AM) as well as the specific linkages cleaved within the starch polymers (α-1,6-glycosidic / α-1,4-glycosidic linkages) was higher compared to AT starches, but the intended molecular degradation of the AP was accompanied by a noticeable degradation of the AM fraction. Nevertheless, the enzymatically modified potato starches produced in the laboratory scale and tested were dispersible in water and performed well with respect to achieved gel strength. The enzymatic modification could be a serious and economic alternative to the acid-hydrolysis (AT) of starch, but the methodical approach to terminate the hydrolysis and the enzyme activity, respectively, should advance or revisited.
Acknowledgements
This IGF Project of the FEI was supported via AiF within the programme for promoting the Industrial Collective Research (IGF) of the German Ministry of Economics and Climate Action (BMWK), based on a resolution of the German Parliament. Project AiF 21643 N. The authors would like to thank Emsland-Stärke GmbH for providing the PS-N, Novozymes Nederland B.V. for providing the PUL, Mr. Christoph Fahrenson (ZELMI, TU Berlin) for preparing the SEM micrographs as well as Mrs. Ewgenia Kuhl for her assistance in performing numerous experiments. The authors also thank Ms. Emma M. Ulbrich for checking the manuscript linguistically.
Open access funding enabled and organized by Projekt DEAL.
Conflict of Interest
The authors declare no conflict of interest.
Open Research
Data Availability Statement
Research data are not shared.


