K-Doping Suppresses Oxygen Redox in P2-Na0.67Ni0.11Cu0.22Mn0.67O2 Cathode Materials for Sodium-Ion Batteries
Abstract
In P2-type layered oxide cathodes, Na site-regulation strategies are proposed to modulate the Na+ distribution and structural stability. However, their impact on the oxygen redox reactions remains poorly understood. Herein, the incorporation of K+ in the Na layer of Na0.67Ni0.11Cu0.22Mn0.67O2 is successfully applied. The effects of partial substitution of Na+ with K+ on electrochemical properties, structural stability, and oxygen redox reactions have been extensively studied. Improved Na+ diffusion kinetics of the cathode is observed from galvanostatic intermittent titration technique (GITT) and rate performance. The valence states and local structural environment of the transition metals (TMs) are elucidated via operando synchrotron X-ray absorption spectroscopy (XAS). It is revealed that the TMO2 slabs tend to be strengthened by K-doping, which efficiently facilitates reversible local structural change. Operando X-ray diffraction (XRD) further confirms more reversible phase changes during the charge/discharge for the cathode after K-doping. Density functional theory (DFT) calculations suggest that oxygen redox reaction in Na0.62K0.03Ni0.11Cu0.22Mn0.67O2 cathode has been remarkably suppressed as the nonbonding O 2p states shift down in the energy. This is further corroborated experimentally by resonant inelastic X-ray scattering (RIXS) spectroscopy, ultimately proving the role of K+ incorporated in the Na layer.
1 Introduction
Sodium-ion batteries (SIBs), as the most promising replacement for lithium-ion batteries, have attracted great attention owing to similar reaction mechanism and sodium resource abundance.[1] Among many potential cathode candidates, layered transition metal oxides (denoted as NaxTMO2, x < 1, TM = transition metal), featuring facile 2D Na+ diffusion channels, have remained in the research focus.[2] Nevertheless, the limited theoretical capacity solely based on TMs has largely plagued their practical application. Inspired by Li-excess manganese layered oxides, the oxygen redox activity in NaxTMO2 has recently been exploited to improve the energy density of SIBs.[3] Similar to the Li-O-Li configuration, a Na─O─X atomic arrangement can trigger oxygen redox reactions when partially substituting X elements in the TM layer, where X represents Li+, Mg2+, Zn2+, or vacancies.[4-9] The formation of unhybridized O 2p orbitals with high energy induced by the Na─O─X configuration enables oxide anions to be oxidized. Furthermore, incorporating doping elements with high covalency in the charged state can largely enhance the oxygen density of states near the Fermi level, thus promoting oxygen redox reactions, as proved in Na-deficient P2-Na2/3Fe2/9Ni2/9Mn5/9O2 and P3-Na0.67Mn0.9Cu0.1O2.[10-12]
In the context of structural stability, the replacement of Mn ions with diverse TMs or alkali/alkaline-earth elements in such system is also a viable approach, as it hinders the P2 to O2 or OP4 (O/P intergrowth structure) phase transition effectively.[13-15] Besides, regulating the Na layer can effectively suppress the phase transition and thereby improve cycling stability. For example, Shen et al. demonstrated that Ca2+ residing in Na layers can act as “pillars” to disturb the Na+/vacancy ordering, suppress the P2-O2 phase transition and alleviate lattice oxygen release due to the strengthened bonding in the Ca-O configurations.[16] As reported by Wang et al., large-sized K+ doping in Na layer leads to the reinforced MnO6-octahedra slabs and favorable Na+ extraction/insertion, resulting in high reversible capacity of 240.5 mA h g−1 and good capacity retention of 98.2% after 100 cycles.[17] Wang et al. suggested the possibility that the Mg-ion can reside in both TM and Na sites. The Mg-ion in the Na layer can inhibit the structural collapse along c direction.[18] Similarly, Ouyang et al. demonstrated that K-doping in Na0.67Mn0.6Ni0.3Cu0.1O2 sample creates fast ion transport pathways, leading to enhanced cycling stability and rate performance.[19] Despite impressive discoveries, the research remains predominately on ensuring structural stability by Na site-regulation, with only a few studies addressing the effects of Na site dopants from the perspective of oxygen redox reactions in layered oxide cathodes. This is an indispensable aspect for further improvement of the cathode capacity and the long-term cycling durability.
Herein, K-doping into the Na layer of P2-type Na0.67Ni0.11Cu0.22Mn0.67O2 oxide and its role in enhancing electrochemical properties, improving structural stability, and modifying oxygen redox reactions have been systematically investigated. Operando synchrotron XAS was conducted to perform a detailed charge compensation mechanism analysis in both pristine and K+-doped cathodes. The structure evolution of both cathodes during electrochemical cycling was monitored by operando XRD. Na+ diffusion kinetics was studied via GITT and rate capability measurements. The electrochemical cycling performance between 1.5 and 4.5 V reveals that K+-doped cathode displays improved cycling stability at 0.5C (1C = 200 mA g−1) over 100 cycles. Particularly, enhanced discharge capacities are achieved at high C rates with 68.6 and 51.3 mA h g−1 at 5C and 10C, respectively. Moreover, RIXS spectra of K+-doped cathodes at fully charged/discharged states (4.5 and 1.5 V) after various cycles suggest suppressed oxygen redox reactions. Further investigation by density functional theory (DFT) indicates a downward shift in energy of nonbonding O 2p states, in the electronic structure around TM 3d and O 2p orbitals near the Fermi level.
2 Results and Discussion
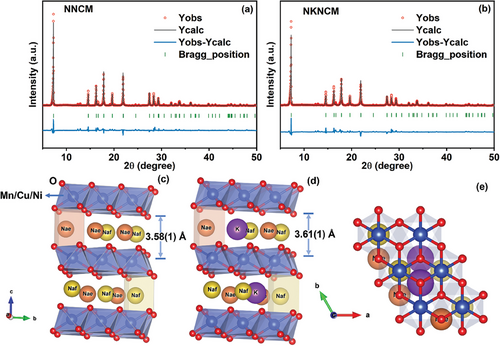
The stoichiometry of the as-synthesized Na0.67Ni0.11Cu0.22Mn0.67O2 (NNCM) and Na0.62K0.03Ni0.11Cu0.22Mn0.67O2 (NKNCM) samples was examined by inductively coupled plasma optical emission spectroscopy (ICP-OES). As shown in Table S1 (Supporting Information), the results indicate the ratio between the TMs is close to the expected stoichiometry. Figure 1a,b display the XRD refinement results of the pristine powder. All diffraction peaks are in good agreement with the P2-type structure (space group: P63/mmc). In this structure, the O framework is stacked in an ABBA sequence, and the TM slabs are formed by randomly distributed NiO6, CuO6, and MnO6 octahedra. Na ions are in prismatic coordination environment between the adjacent TM layers, which are face- (Naf) and edge- (Nae) sharing with the TMO6-octahedra (Figure 1c-e). The strong electrostatic repulsion between two neighboring Na sites prevents the Na+ occupying them at the same time (hence the Na deficiency). K+ has a higher propensity to be located at the Nae site which is energetically more favorable.[20] The peaks observed at 2θ = 12–13° correspond to the superstructure, which is derived from the Na+/vacancy ordering in ab-plane due to the strong Na-Na and Na-TM repulsive interactions.[18, 21, 22] The detailed refinement results are presented in Tables S2 and S3 (Supporting Information). According to the refined structural data, an increase in the c lattice parameter is observed for NKNCM (c = 11.175(0) Å) in comparison with NNCM (c = 11.167(0) Å), due to the larger ionic radius of K+ (1.38 Å) than Na+ (1.02 Å), while the a lattice parameter shows negligible difference. The schematic illustration of the refined structure for NNCM and NKNCM is depicted in Figure 1c–e. Enlarged Na layer spacing d(O─Na─O) from 3.58(1) to 3.61(1) Å is obtained after larger-size K+ incorporation in the Na layers. In addition, the spacing of TM layer is reduced from 2.01(1) to 1.98(1) Å as a consequence of strengthened interaction of TMO6-octahedra slabs.[17] Figure S1 (Supporting Information) depicts the element mappings of NKNCM powder that are detected by scanning electron microscopy-energy dispersive spectroscopy (SEM-EDS). The main metal elements are uniformly distributed. The normalized Ni, Cu, and Mn K-edge X-ray absorption near edge structure (XANES) spectra of as-synthesized NNCM and NKNCM powder samples are displayed in Figure S2 (Supporting Information). For oxidation states analysis, Ni K-edge spectra of a reference of Ni2+ (NiO), Ni3+ (LiNiO2), Cu K-edge spectra of a Cu+ reference (Cu2O), Cu2+ reference (CuO), and Mn K-edge spectra of a Mn4+ reference (MnO2) are also included. It is evident that Ni, Cu, and Mn are present predominantly as Ni2+, Cu2+ and Mn4+, respectively.
The electrochemical behaviors of NNCM and NKNCM were evaluated using galvanostatic charge-discharge tests within the voltage window of 1.5–4.5 V versus Na+/Na. The charge-discharge profiles for the first cycle at 0.1C are presented in Figure 2a. NNCM and NKNCM cathodes exhibit initial charge capacities of 131.1 and 117.9 mA h g−1, respectively. Figure 2b presents a plot of potential as a function of Na content (x). NKNCM has lower Na content than NNCM in the pristine state, while the same amount of Na is observed at the end of charging. Therefore, NKNCM has fewer Na+ deintercalated, corresponding to the lower initial capacity, since K+ act as pillars in the Na layer rather than being extracted.[23] The preservation of K element in NKNCM electrode was confirmed after the 1st cycle, as shown in Figures S3 and S4 (Supporting Information). In addition, SEM-EDS analysis for the electrolyte collected from NKNCM half-cells after cycling was performed (Figure S5, Supporting Information). Na, P, F, O, and Ni elements can be exclusively observed, while K is absent (Here Ni elements are derived from copper tape used for SEM). This further confirms the absence of K loss. In the first charging process, both cathodes exhibit a sloping voltage profile (indicating the solid solution reaction region) followed by a long voltage plateau (corresponding to a phase transition) above 4.0 V.[24] A shorter voltage plateau is observed in NKNCM compared to NNCM, indicating that the stability of the structure can be improved by K incorporation. During the subsequent cycles, the high-voltage plateau of NKNCM remains shorter than that of NNCM in the fifth cycle as depicted in Figure S6 (Supporting Information), implying that NKNCM undergoes less serious phase changes upon cycling. Figure 2c shows initial cyclic voltammetry (CV) curves of two cathodes in the voltage range of 1.5–4.5 V. The pair of anodic/cathodic peaks in NNCM between 2.8 and 4.0 V can be assigned to Ni2+/3+/3.5+ and Cu2+/3+ redox reactions, contributing to the reversible capacity. The charge compensation mechanism will be discussed in more detail in the following XAS discussions. The strong oxidation peaks starting at ≈4.2 V can be assigned to P2-OP4 phase transition, in accordance with previous reports.[25-27] Notably, as shown in Figure S7 (Supporting Information), this oxidation peak gradually shifts to lower voltage with cycle going on, indicating that the phase transformation is only partially reversible, which possibly, cause structural distortion and capacity fading.[28] Similar electrochemical behaviors are observed for NKNCM, while a less shifting of the oxidation peak upon cycling is demonstrated. Figure 2d,e show cycling performance as well as the Coulombic efficiency of the cathodes at current rate of 0.5C. The capacity retention of NKNCM after the 100th cycle is 87.2% (compared to the 3rd cycle), which is higher than that of NNCM with 84.6%. This can be attributed to suppressed oxygen evolution and improved structural stability induced by K-doping, which will be further proved in the following sections.
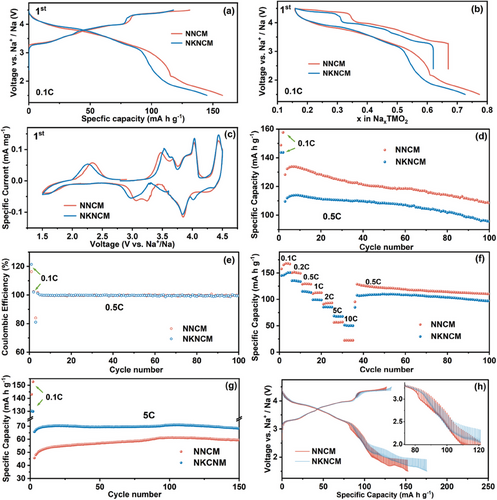
Figure 2f and Figure S8 (Supporting Information) display the rate capability of NNCM and NKNCM at different current rates of 0.1C, 0.2C, 0.5C, 1C, 2C, 5C, and 10C in the voltage range of 1.5–4.5 V, respectively. For NNCM cathode, when the current rates increase from 0.1 to 10C, the discharge capacities of 157.8, 150.5, 128.8, 110.8, 91.1, 56.3, and 22.2 mA h g−1 can be achieved, respectively. When the current is resumed from 10C to 0.5C, the discharge capacity can be recovered to 125.4 mA h g−1, demonstrating the robust rate capability of NNCM. In comparison, NKNCM exhibits lower capacities at low current rates but higher capacities at high rates (5C and 10C) due to the facile fast Na+ extraction/insertion process. In Figure 2g, the NKNCM sample displays better cycling performance than the NNCM sample at a high rate of 5C. This also implies that the enlarged Na layer spacing after K-doping favors the diffusion of Na+. Figure 2h and Figure S9a (Supporting Information) show the GITT profiles of the cathodes during the first desodiation and sodiation process as a function of capacity and time, respectively. The Na+ diffusion coefficient (DNa+) can be calculated according to Equation S1 (Supporting Information) derived by Weppner et al.[29] Figure S9c,d (Supporting Information) indicate the DNa+ values of both cathodes calculated from GITT, which show a similar tendency with voltage changes. During charging, the overpotentials and DNa+ of NNCM and NKNCM show no significant difference below 4 V (within stable P2 phase region as proved below). Above 4 V, the diffusion coefficient gradually decreases, which is induced by the P-type and O-type phase transition, as demonstrated by previous reports that Na+ mobility in P2 structure is faster than in O2 structure.[7, 30, 31] However, during discharge, when the voltage is beyond 2.2 V, which belongs to a single-phase solid solution reaction zone, the smaller overpotential and higher Na+ diffusion coefficients of NKNCM can be observed, verifying improved Na+ diffusion kinetics after K-doping. Here overpotential is the voltage difference between the end of interrupted charge/discharge and the end of relaxation, representing the reaction kinetics of electrodes.[32] When further deeply discharged to 1.5 V, the rapid decrease in DNa+ indicates different reaction kinetics, which can be attributed to phase transition toward the orthorhombic P’2 phase (will be discussed in the following operando XRD section).[33] Over the whole P2 single-phase region, NKNCM exhibits higher diffusion coefficients than NNCM. Moreover, during cycling at high rate (5C and 10C), both cathodes exhibit low capacities (lower than 70 mA h g−1), implying low amounts of deintercalated Na+, i.e., the cathodes are preserved in the single-phase region during charging and discharging. Therefore, rapid Na+ diffusion kinetics in this region of NKNCM as proved by GITT has a crucial impact on the improvement of its specific capacities at high rate. In addition, the lower overpotential causes NKNCM to reach the cut-off voltage later than NNCM, resulting in longer charging and discharging time, consistent with higher capacity in GITT measurement.
Operando XAS characterizations for the electrodes at different states of charge were performed to elucidate the charge compensation mechanism of TMs. For the Mn K-edge XANES spectra of NNCM and NKNCM (Figure S10, Supporting Information), two main features including the pre-edge (1s to 3d transition) and the main edge (1s to 4p transition) can be observed (marked by blue square, also shown in the inset).[34] As illustrated in the enlarged region, the pre-edge peaks consist of two distinct peaks corresponding to the transition from the 1s orbital to the t2g orbitals and the eg orbitals, respectively.[35] Upon cycling, the main energy edge position for both cathodes shows no significant change, which indicates that Mn4+ does not participate in the charge compensation. The increased intensity of the pre-edge peaks during charging can be attributed to the gradual distortion of the MnO6 octahedra stemming from the oxidation of neighboring TMs.[36-38] The Ni and Cu K-edge XANES spectra for both cathodes are displayed in Figure 3. During the first charging process (Na+ deintercalation), Ni K-edge for NNCM continuously shifts to higher energy until 4.5 V (Figure 3a). However, for NKNCM, Ni K-edge shifts and reaches the final state when charged to 4.0 V (Figure 3c). At the charging cut-off voltage 4.5 V, Ni for both cathodes appear to be in the same valence states, which are higher than Ni3+ (LiNiO2). The Ni K-edge energy position shift is ≈3 eV, suggesting a final average valence of Ni3.5+. Notably, when charged to the same voltage in the range of 4.0–4.5 V, the Ni oxidation state of NNCM is lower than that of NKNCM. This phenomenon may be associated with oxygen ions oxidation accompanied by the transfer of electrons from oxygen to Ni ions for charge compensation in NNCM.[39] For the Cu oxidation states change of both cathodes, the Cu absorption edges shift mainly occurs above 4.42 V and Cu2+ undergoes oxidation to Cu3+. During discharging, the Ni is reduced to a valence between +2 and +3, and Cu K-edge moves back to the original position, in accordance with the partial reduction of Ni ions and complete reversibility of the Cu redox. Compared with NKNCM, the Ni absorption edge of NNCM shifts to lower energy, implying more reduction of Ni during discharge. From these observations, the cationic charge compensation of NNCM and NKNCM is contributed by Ni and Cu redox reactions. The higher discharge capacity of NNCM is attributed to the reduction of lattice oxygen (oxygen redox participates in the charge compensation in NNCM cathode will be explained in the later section) and more reduced Ni.
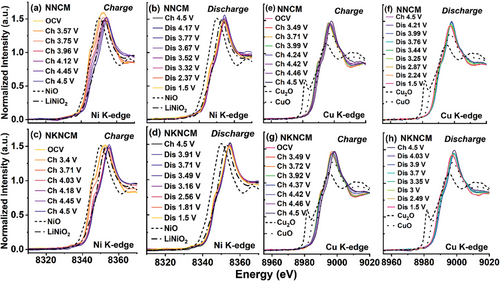
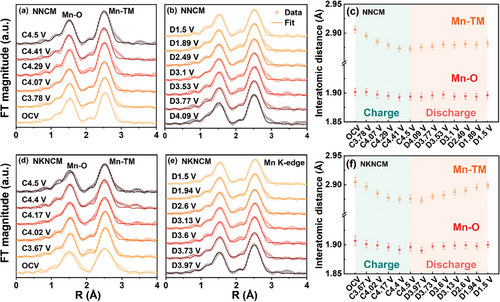
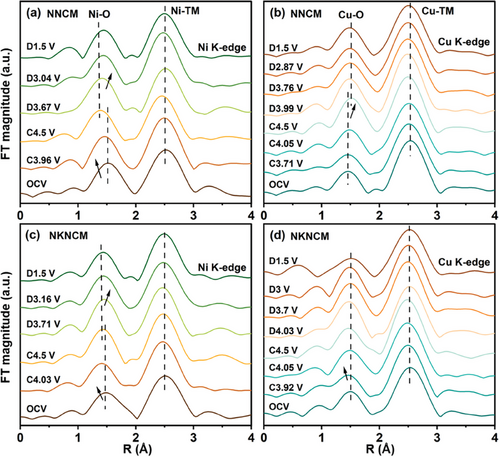
Figure 4 displays the magnitudes of Fourier transforms of k3-weighted extended X-ray absorption fine-structure (FT-EXAFS) spectra of the Mn K-edge for NNCM and NKNCM at various charged and discharged states, and the fitting results of the first (Mn─O) and second (Mn-TM) coordination shells are embedded. The detailed local structural parameters obtained from these fits are listed in Tables S4 and S5 (Supporting Information). At open-circuit voltage (OCV), compared with the undoped sample, the Mn─O and Mn-TM coordination shells of the K-doping sample show no significant change. For both cathodes, only a slight decrease of Mn─O distance (<0.02 Å) can be observed as the cells are charged to 4.5 V.[40] This agrees with the XANES results, showing the oxidation states of the Mn ions stay unaltered. The barely changed Debye-Waller factor implies the maintenance of structural order as a result of robust Mn4+-O bond in the octahedral coordination.[41] The absence of Mn-related redox relieves the adverse Jahn-Teller distortion and metal ion dissolution induced by Mn3+.[42] The changes in the Mn-TM distance can be attributed to the valence variation of the neighboring Ni and Cu ions.[38] In addition, the Mn-TM bond in the NKNCM cathode exhibits a more reversible evolution than NNCM during the following discharge process, suggesting better stability of the TM slabs. For the Ni K-edge FT-EXAFS spectra (Figure 5a,c), for both cathodes, the peak centered at ∼1.5 Å corresponding to the Ni-O coordination shifts to shorter distance during the charging process, originating from the ionic radius change due to the oxidation of Ni ions. Upon discharging to 1.5 V, the length of Ni-O for NNCM gradually prolongs. In contrast, the Ni-O length of the K+-doped sample changes less pronounced and recovers more reversibly to the initial position after the discharge process. A similar evolution in the local structure can be noticed in the Cu K-edge FT-EXAFS spectra of NKNCM accompanying Na+ extraction and insertion (Figure 5b,d). However, for NNCM, the Cu─O bond length displays an opposite trend above 4 V, possibly attributed to longer Cu─O2 distance than the Cu─O in the lattice.[43] Overall, highly reversible local structural changes around Mn, Ni, and Cu atoms of NKNCM support its cycling stability.
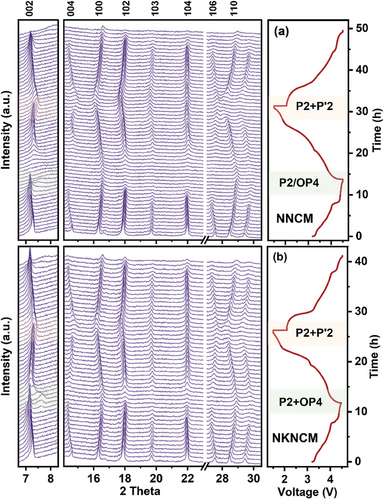
For investigating the structure stability of NNCM and NKNCM upon the Na+ deintercalation/intercalation process, operando XRD measurements were performed on both cathodes within 1.5–4.5 V at a current rate of 0.05C. Selected operando XRD patterns along with refinement results are shown in Figures 6 and S11 (Supporting Information). Compared to the powder sample, the reduction in the c lattice parameter may be attributed to self-discharge of the cells during OCV state. For NNCM cathode, during the first charging process, the 002 and 004 reflections shift to lower angles until 4.0 V, while 102 reflection shifts to higher angles, suggesting an expansion along the c-axis, which is consistent with the increase in c lattice parameter in Figure S11a (Supporting Information).[44] As in most layered oxides, the interlayer distance of d(O─Na─O) will increase, because the decreased Na content will raise the electrostatic repulsive forces between neighboring TMO2 layers.[45] Simultaneously, the 100 and 012 reflections move to higher angle, indicating a contraction along the a axis because of the shrinking TM-O bonds in TMO6 octahedra. This contraction results from the decrease in TM ions size with higher oxidation states, which is consistent with the change of lattice parameter a.[46] During subsequent charging, the peaks shift in the opposite direction, which can be ascribed to the slipping of TMO2 layers, leading to the formation of a second phase. The P2 peaks become here less intense and broader, indicating an attenuated long-range ordering of P2-type slab stacks.[8, 14] Meanwhile, weak reflections of an OP4 phase (indexing to space group P63) appear, in which the octahedral and prismatic Na layers arrange alternately. The biphasic region is in good agreement with the voltage plateau observed above 4.3 V in Figure 2a. This phase transformation induces severe strain in the structure, leading to the formation of internal stresses and cracks after prolonged cycling.[47] Note that the intensity of the reflections in the OP4 phase is inadequate to refine with the bi-phase model. Nevertheless, in this region, a decrease in the c lattice parameter is observed, suggesting the presence of the OP4 phase. This is ascribed to the smaller interlayer distance in the O-type compared to the P-type layer.[7, 48] With continuous charging, the peak of OP4 phase shifts to higher angle, corresponding to the increase in O2 stacking and decrease in P2 stacking in the intergrowth of OP4 phase (OP4 features a distinctive stacking of alternative O- and P-type layers). In this voltage range, more O-type layers appear, the c lattice parameter decreases continuously, and the formation of more pronounced neighboring O-type slabs results in stacking faults. This phase transition has been demonstrated to affect the diffusion kinetics.[7] In comparison, the overall peak shift of NKNCM during charging is less obvious. Moreover, for NKNCM, the P2 structure is more preserved and the c lattice parameter exhibits less decline in the bi-phasic region, implying that less O2 stacking layers are formed at deep charged state.[8] These results suggest that K-doping can effectively alleviate the phase transition from P2 to OP4 and accounts for maintaining structural stability during cycling. In the following discharge process, all the diffraction peaks recover to initial positions and the lattice parameters evolution follows the opposite trend of the charging process, indicating a reversible structural transformation. When the discharge voltage is below 2 V, the 002, 100, and 110 reflections gradually split into two and become broadening, suggesting a P2/P’2 bi-phase transformation mechanism (Figure S12, Supporting Information).[49] The new secondary phase can be indexed into Cmcm space group with orthorhombic lattice, which is a distorted form of the P2 phase along the b-axis.[44, 50] The lattice distortion is induced by Na site redistribution at deep sodiation state since adjacent Nae and Naf sites cannot be occupied simultaneously to alleviate the strong Na+-Na+ repulsion.[51, 52, 20] Here the lattice parameters of P’2 phase cannot be determined due to the significant peak overlapping. A slight decrease in the c lattice parameter might be attributed to the compress of the Na─O bonds in P2 phase with high Na content.[53] In addition, throughout the whole discharge process, the a lattice parameter of NNCM exhibits more significant changing than NKNCM, which due to more reduced Ni as demonstrated in XAS analysis. In the second charge process, the P’2 phase transforms reversibly to the single P2 phase at around 2.5 V. Compared with NNCM, the solid solution range of NKNCM is extended to lower voltage after K-doping. Overall, within this charge/discharge voltage window, a more reversible phase evolution is observed for NKNCM, demonstrating that K-doping improves P2 phase stability, which plays an important role in achieving better cycling stability.
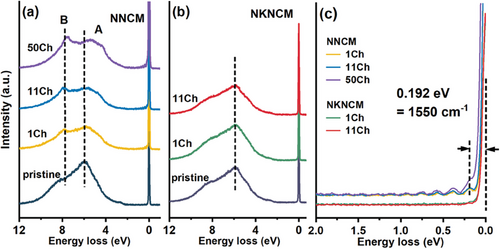
The difference of the oxygen redox behavior of the two cathodes were experimentally characterized to probe the nature of the oxidized oxygen. Ex situ O K-edge RIXS spectra for NNCM and NKNCM cathodes at pristine state and after various cycles (at 1st, 11th, and 50th cycle) at the charged state (4.5 V) are presented in Figure 7. For NNCM, an elastic peak region at energy loss of 0 eV can be observed at charged state after the 1st, 11th, and 50th cycle. A progression of sharp peaks can be resolved with the fundamental vibrational frequency of ≈1550 cm−1 close to that of molecular O2 (Figure 7c).[54, 55] With the increase of energy loss, the peak spacing decreases linearly, demonstrating the anharmonic oscillation O2 diatomic molecule (Figure S13, Supporting Information).[43] In the broad inelastic region, peak B at energy loss of 8 eV (Figure 7a), which can be assigned to the filled π molecular orbitals, also belongs to molecular O2.[43] The gaseous molecular O2 formed and trapped in the lattice indicates significant structural reorganization during charging.[55] Furthermore, peak A reflects the electronic structure of metallic band of the oxide.[56] In comparison to the pristine state, peak A shifts toward low-energy loss for the charged electrodes after cycles, indicating TMO6 distortion upon cycling.[57] However, for NKNCM, neither features of the oxygen oxidation and nor peak A shift can be observed, demonstrating that K-doping inhibits oxygen redox reactions and mitigates structural distortion. As depicted in Figure S14 (Supporting Information), for NNCM, the features of oxygen oxidation disappear in the discharged samples, indicating that O2 species are reduced back to O2−. Therefore, the reversible oxygen redox in NNCM continuously contributes extra capacity beyond cationic redox reactions. The peak A shifts back to the original position in the discharge process, which suggests the reversible TMO6 distortion during charging and discharging, in good agreement with EXAFS results as discussed above.
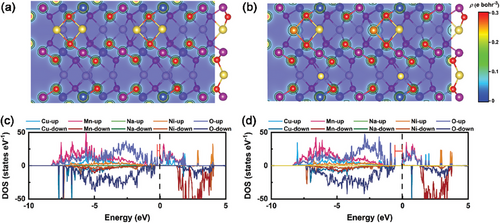
First-principles calculations were performed to investigate the electronic structures of NNCM and NKNCM. The lattice constants of pristine NNCM (a = 2.89 Å and c = 11.17 Å) and NKNCM (a = 2.89 Å and c = 11.18 Å) were fixed to the experimental value determined by XRD. The charge density distribution as depicted in Figure 8a (NNCM), and Figure 8b (NKNCM) reveals a stronger electron cloud overlap between K and O than that of Na and O. Similar results were observed in a previous report, indicating a K─O antibonding which is different from Na─O bonding.[17] The projected density of states (PDOS) of NNCM and NKNCM are compared in Figure 8c,d. For NNCM, the bonds below the forbidden band and at the top of the valence band are dominated by the O 2p, and a small contribution of Ni 3d, Cu 3d states. The small overlap between the O 2p orbitals and the 3d orbitals of Ni, Cu leads to the formation of the nonbonding O 2p states, which contributes to the oxygen redox reaction.[58] With the introduction of K, an increase of Cu 3d spin-down electrons is observed, suggesting stronger hybridization between Cu and O, which is beneficial to stabilize the structure.[17] Therefore, doping leads to stronger covalent TM─O interactions, which would push O 2p states down in energy.[59] The nonbonding O 2p states in NNCM show dominance near the Fermi level (−0.22 eV), while the oxygen states in NKNCM shift to the low-energy direction (−0.57 eV), making it less prone to oxidation in the same voltage region. This increases the difficulty of triggering oxygen redox reactions in NKNCM.
3 Conclusion
In summary, the effects of K-doping in Na layers on the structural stability and both cationic/anionic redox of P2-Na0.67Ni0.11Cu0.22Mn0.67O2 cathode have been thoroughly investigated. Combining RIXS measurements and DFT simulations, it is demonstrated that doped K+ increases the hybridization of Cu 3d and O 2p orbitals near the Fermi level. This results in the oxygen density of states moving to low-energy direction, consequently in a lower propensity of oxygen redox activity of NKNCM. Besides, based on the XANES results, Ni and Cu are proved to take part in the cationic charge compensation of NNCM and NKNCM, while Mn remains electrochemically inert. The incorporation of K+ also improves the reversibility of local structural evolution near TMs, maintaining TM layer integrity, and thereby enhancing the cycling stability. This is further demonstrated by operando XRD results. During sodiation/desodiation at high current rate (5C and 10C), a higher discharge capacity can be obtained for K+-doped cathode because of smoother Na+ diffusion in the solid solution reaction region as proved by GITT. This work presents new insights into understanding the impact of doping in Na layer on oxygen redox reactions for developing high-rate capability electrode materials.
4 Experimental Section
Synthesis
P2-type Na0.67Ni0.11Cu0.22Mn0.67O2 and Na0.62K0.03Ni0.11Cu0.22Mn0.67O2 were synthesized via solid-state reaction. A stoichiometric ratio of Na2CO3 (Sigma-Aldrich, 99%), K2CO3 (abcr GmbH, 99%), NiO (Alfa Aesar, 99%), CuO (abcr GmbH, 99.5%), and Mn3O4 (abcr GmbH, 97%) precursors were mixed using a SPEX 8000DM mixer/mill for 1 h. 10% excess of Na2CO3 and 5% excess of K2CO3 were used to compensate the loss by volatility during the heating process. The mixture was pelletized under 3 MPa and then transferred to an alumina crucible. The pellets were preheated up to 500 °C for 2 h and then annealed at 900 °C for 12 h followed by naturally cooling to room temperature. Then the final products were grounded in an agate mortar and transferred to an argon-filled glovebox for storage (O2 < 0.1 ppm, H2O < 0.1 ppm).
Materials Characterization
The elemental composition of the as-prepared samples was determined by ICP-OES. The powder samples were dissolved in aqua regia (HCl: HNO3, 3:1) and analyzed by performing a double determination using an ARCOS ICP-OES (Spectro Analytical Instruments, Kleve, Germany) with axial plasma view. For phase determination, XRD patterns were collected on a STADI P diffractometer (STOE, Germany) with Mo-Kα1 radiation (λ = 0.70932 Å, 50 kV, and 40 mA) and a Mythen2K detector. Rietveld refinement was conducted using the Fullprof Suite software.[60] The atomic structure of the samples was visualized using VESTA software. For operando XRD measurements during electrochemical cycling, a customized CR2032 coin cell with quartz glass windows (6 mm in diameter, 100 µm in thickness) was used.[61] The cell was mounted on a rocking sample holder in the above-mentioned diffractometer and measured in transmission geometry. Each scan was recorded for 10 min in 0.02° step from 3° to 36°. The charge/discharge of the cells were performed at 0.05C (1C = 200 mA g−1) in the voltage range of 1.5–4.5 V on a Gamry potentiostat. SEM images were obtained using a ThermoFischer Scientific Phenom ProX microscope in back-scattered electrons (BSE) mode. The attached EDS detector was used to map the elemental distribution. The EDS results were conducted at an accelerating voltage of 15 kV. The powder samples were deposited on SEM holder with carbon tape. For the electrolyte samples, copper tape was used.
Electrochemical Characterization
The working electrodes were prepared by mixing the active materials, super P (Alfa Aesar, 99%) and poly(vinylidene difluoride) (PVDF) binder (Solef 5130, Solvay) with a weight ratio of 85%: 7.5%: 7.5% in N-methyl-2pyrrolidone (NMP, Alfa Aesar, 99.5%). The homogeneous slurry was coated on aluminum foil and dried under vacuum at 100 °C for 12 h. For operando and ex situ X-ray measurements, carbon paper was used as the current collector. The compacted electrodes were punched into disks of 13 mm in diameter. The coin cells were assembled using the Na metal foil as anode and the glass fiber (Whatman, GF/D) as separator. 1 M NaPF6 dissolved in a mixture of ethylene carbonate (EC), dimethyl carbonate (DMC), and fluoroethylene carbonate (FEC) (47.5:47.5:5, v/v/v) was used as an electrolyte. The galvanostatic charge-discharge cycling was carried out using Arbin battery testing instrument at 25 °C in a voltage range of 1.5–4.5 V. The rate capability tests were performed at various C-rates ranging from 0.1C to 10C. CV curves were collected on a potentiostat (Bio-Logic VMP-300) at a scan rate of 0.2 mV s−1. For GITT measurements, at each step, the cells were charged/discharged at a current rate of 0.1C for 6 min, then rested for 30 min. For SEM-EDS measurement of the electrolyte, coin cells after cycling were disassembled, and the separator was immersed in 1 mL DMC inside the glovebox. After precipitation, the supernatant was gradually dripped onto SEM copper tape, followed by drying.
RIXS and XAS
Ex situ O K-edge RIXS measurement was performed at beamline U41-PEAXIS of BESSY II (Berlin, Germany) at an excitation energy of 531.0 eV.[62] The cycled cells at different charged/discharged states were disassembled inside an Ar-filled glovebox and rinsed with DMC. Subsequently, the electrodes were dried in vacuum, loaded onto the sample holder using adhesive copper tape, and then transferred into the RIXS chamber without exposure to air.
Operando XAS measurements at Mn, Ni, and Cu K-edges were carried out at the beamline P65 of PETRA III extension of DESY (Hamburg, Germany) in the standard transmission setup using a Si(111) double-crystal monochromator and two plane Si mirrors at an angle of incidence of 2 mrad for higher harmonics suppression.[63] A customized CR2032 coin cell with Kapton window (6 mm in diameter) was used.[42] Corresponding pure Mn, Ni, or Cu foil was measured simultaneously with each spectrum as reference foil for energy calibration. The electrochemical cycling for operando XAS measurements were performed using a Bio-Logic VMP3 potentiostat. The XANES and EXAFS data were processed following standard procedures using Athena and Artemis programs.[64]
Theoretical Calculation
The first-principles calculations based on spin-polarized density functional theory (DFT) were performed to reveal the oxygen redox mechanisms in NNCM and NKNCM using the Vienna Ab initio Simulation Package (VASP).[65] The projector augmented wave (PAW) method was adopted to describe the ion-electron interactions.[66] Perdew-Burke-Ernzerhof (PBE) version of generalized gradient approximation (GGA) was used for the exchange-correlation energy.[67] A kinetic energy cutoff of 400 eV was used for the plane wave expansion of the valence electron wave functions. A Γ-centered Monkhorst-Pack k-point mesh of 3 × 3 × 3, 10−6 eV cell−1 in total energy, and 5 × 10⁻² eV Å−1 in force were used for the convergence criterion during structural optimization. A dense k-point mesh of 5 × 5 × 5 was used in electronic structure calculation. GGA plus Hubbard U (GGA + U) method with U values of 4, 6, and 6 eV was introduced considering the on-site Coulomb interaction of d electrons of Mn, Cu, and Ni in NNCM, respectively.[68] A supercell of 3 × 3 × 1 was used to simulate mixed atomic sites in NNCM (Figure S15, Supporting Information).
Acknowledgements
B.Z. acknowledges financial support from the China Scholarship Council (CSC). The authors thank Prof. Dr. Maximilian Fichtner (HIU, Germany) for access to ICP-OES measurement and Dr. Edmund Welter for helpful discussions on the XAS data. The authors acknowledge DESY (Hamburg, Germany), a member of the Helmholtz Association HGF, for the provision of experimental facilities. XAS experiments were carried out at beamline P65 (proposals I-20221092 and I-20230151) and the authors would like to thank Dr. Volodymyr Baran for assistance in using VMP3 potentiostat. RIXS beamtime was allocated for proposals 221-11099-ST and 231-11886-ST. The authors thank Prof. Philipp Adelhelm and Dr. Yongchun Li at Humboldt-University Berlin for access to the Glovebox for loading RIXS samples. G.K. gratefully acknowledges the financial support by the Deutsche Forschungsgemeinschaft (DFG, German Research Foundation) under Germany´s Excellence Strategy—EXC 2154—Project number 390874152. [Correction added on October 24, 2024, after first online publication: Projekt Deal funding statement has been added.]
Open access funding enabled and organized by Projekt DEAL.
Conflict of Interest
The authors declare no conflict of interest.
Open Research
Data Availability Statement
The data that support the findings of this study are available from the corresponding author upon reasonable request.


