The Multiweek Thermal Stability of Medical-Grade Poly(ε-caprolactone) During Melt Electrowriting
Abstract
Melt electrowriting (MEW) is a high-resolution additive manufacturing technology that places unique constraints on the processing of thermally degradable polymers. With a single nozzle, MEW operates at low throughput and in this study, medical-grade poly(ε-caprolactone) (PCL) is heated for 25 d at three different temperatures (75, 85, and 95 °C), collecting daily samples. There is an initial increase in the fiber diameter and decrease in the jet speed over the first 5 d, then the MEW process remains stable for the 75 and 85 °C groups. When the collector speed is fixed to a value at least 10% above the jet speed, the diameter remains constant for 25 d at 75 °C and only increases with time for 85 and 95 °C. Fiber fusion at increased layer height is observed for 85 and 95 °C, while the surface morphology of single fibers remain similar for all temperatures. The properties of the prints are assessed with no observable changes in the degree of crystallinity or the Young's modulus, while the yield strength decreases in later phases only for 95 °C. After the initial 5-d period, the MEW processing of PCL at 75 °C is extraordinarily stable with overall fiber diameters averaging 13.5 ± 1.0 µm over the entire 25-d period.
1 Introduction
Additive manufacturing (AM) technologies are an essential part of biomaterials processing,[1] tissue engineering (TE) applications[2] and, more recently, biofabrication.[3] Poly(ε-caprolactone) (PCL) is appealing as a scaffold material in this context, as it is hydrolytically stable for sufficient periods in cell culture as well as having long-term degradation in vivo. PCL also has excellent processing characteristics in general; multiple manufacturing technologies use this polymer extensively,[4] including solution electrospinning (SES), templating, and emulsion formation. Increasing the resolution of controlled manufacturing also allows the possibility to produce hierarchical structures necessary for more complex tissue replacements[5] as well as personalized implants.[6]
There are several AM technologies already used to process biomaterials and the ones that have successfully translated to the clinic to date have all been based on solvent-free techniques.[7] These include electron beam melting, extrusion-based direct writing[2, 8] and selective laser melting (SLM). Another solvent-free AM process that is being developed within academia with the intent for clinical translation is melt electrowriting (MEW), follows the principles of melt extrusion but produces higher resolved structures than the afore-mentioned AM technologies. MEW fills the dimension gap between SES and extrusion-based direct writing by achieving fiber diameters typically ranging between 2 and 100 µm.[9]
MEW has already been applied to a large variety of biomedical applications including cartilage TE,[10] cancer research,[11] and heart valve replacement.[12] Additionally, MEW has been combined with other biofabrication technologies to create hybrid systems with superior properties compared to constructs created by one method alone.[5] Examples include fiber reinforced hydrogel constructs to better mimic soft tissue mechanical properties[13] or scaffolds utilizing both SES and MEW to control spreading behavior of cells.[14]
MEW, however, places certain requirements on materials that push the boundaries of what is previously investigated. The closest related well-established AM technique using polymer melts is extrusion-based direct writing, which includes using a feedstock filament drawn into a heated nozzle.[15] Due to the relatively high flow rate of extrusion-based direct writing,[16] the polymer is exposed to the high temperature required for melting only for a short time. This short heating period is also applicable for SLM, where polymeric particulates are thermally fused together using a laser source.[17]
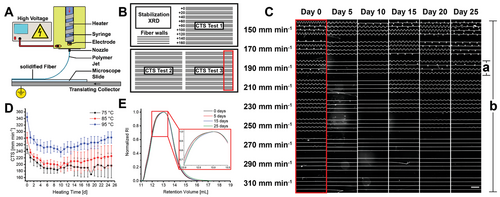
MEW on the other hand requires very low throughput; typically in the order of 2–50 µL h−1 (Figure 1A)[18, 19] and therefore, the molten polymer is typically heated for prolonged periods of time, in the order of hours and days.[20] From a design and regulatory perspective for implantable biomaterials, the thermal degradation and impact on the printed material is essential to ascertain. For this reason, we performed a comprehensive study on the stability of PCL during MEW over a multiweek time frame, to 1) identify the stable operating regime for the process and 2) identify time periods that would indicate thermal degradation. The PCL used in this study was synthesized and purified under good manufacturing practice (GMP) conditions and is the current gold standard polymer for MEW.[21] The investigated extended heating of PCL at moderate temperatures is herein notably different to previous thermal degradation studies, which focus on higher temperature stresses for shorter periods of time.[22-25]

2 Results and Discussion
Biomaterials are one primary application for MEW and translation from university-led research to implantable devices is governed by the regulatory agencies that prioritize safety and reliability.[7, 26] There is a relatively fast-track regulatory pathway for biomaterials in the US, termed the 510(k) route that allows new implants based on similarities to previous devices. In this context, GMP-manufactured polymers with a history of use in the clinic are essential for conforming to this process. The PCL used here is made under such conditions and is the basis for several medical devices, including those that are made by melt-extrusion based AM.[8] The low flow rates associated with MEW, however, result in the PCL being exposed to heat for longer periods than melt extrusion and knowledge of the effects of these elevated heating conditions on manufacturing is important for clinical translation as a biomaterial.
2.1 Melt Electrowriting
We established MEW (Figure S1, Supporting Information) over a 25-d period, using a daily print collection strategy that allowed multiple analysis including also X-ray diffraction (XRD) and mechanical testing. Using two microscope slides per day, the programmed printing paths are shown in Figure 1B and contain several regions including (1) a 25-layer scaffold to stabilize the jet and for XRD measurement, (2) three iterations of printing to determine the jet speed, fiber diameter/morphology, and (3) four fiber walls consisting of 25 stacked fibers for morphological analysis and mechanical testing.
2.2 Critical Translation Speed
Knowing the critical translation speed (CTS) is important throughout a print since this value can influence the fiber diameter and fiber placement when changing printing direction.[6, 25] Corresponding to the jet speed, the CTS provides a value above which the jet will stretch and therefore reduce in final diameter.[9] The CTS was investigated as a part of this study as a measure of process stability and Figure 1C shows the typical progression of the experiment for 85 °C. This shows sets of four fibers direct written direct-written with increasing collector speeds and the CTS was determined when they are linear. Changes in parameters can affect the CTS; for example, a higher processing temperature will reduce the viscosity and results in a higher flow rate to the nozzle. Lower viscosity, in turn, produces a higher CTS since the collector speed must be increased to prevent the jet from buckling (Figure 1D).
The change in CTS trends similarly for all three temperatures and commences with a decrease during the first 5 d (Figure 1D). The decrease in the CTS during the first 5 d was 23% for 75 °C, 28% for 85 °C, and 23% for 95 °C, respectively. The CTS continued to change after day 9 for 85 and 95 °C, while for it remains stable for 75 °C with only small variations. One printing iteration at day 19 was damaged prior to analysis, which explains the observable outlier.
From day 13 on an upward trend for 85 and 95 °C can be observed, which is explainable by ongoing degradation of the material. To confirm thermal degradation, GPC measurements with samples artificially aged at 95 °C have been performed and their results can be found in Figure 1E (a larger version is provided as Figure S2 in the Supporting Information). The measured GPC curves shift towards higher retention volume values with increasing heating time, which translates into polymer chain lengths decreasing with time. The changes are very subtle indicating a very slow degradation of PCL. This is also confirmed by measurements of the viscosity over 24 h that show a very slow decrease (Figure S3, Supporting Information).
2.3 Fiber Diameter
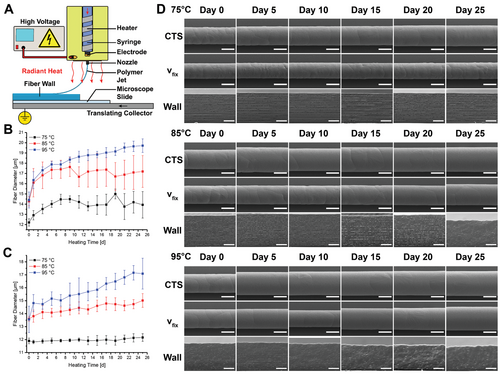
Since the collector speed stretches the jet above the CTS[9] into a catenary shape and affects the fiber diameter, a distinction was made between the diameter of fibers produced at the CTS (Figure 2B) and at a fixed collector speed above the CTS (vfix, Figure 2C). The collector speeds of vfix were 270 mm min−1 (75 °C), 310 mm min−1 (85 °C), and 360 mm min−1 (95 °C) and were selected to ensure that all research was performed above the CTS for the entirety of experiments (Figure 2C), as the vast majority of MEW research is performed at a fixed collector speed (vfix) above CTS; here it is 10% to 76% above the CTS.

The fiber diameter at CTS shows an initial increase as the CTS decreases during the first 5 d, when the development of Figures 1D and 2B are compared. In the following days, the diameter of the samples produced at 95 °C increases, while the diameters of the other two temperatures remained stable. The fiber diameter at vfix for both 85 and 95 °C shows a steady increase over 25 d. In contrast, the diameter at vfix when processing at 75 °C remains almost constant over all 25 d of printing.
This small fiber diameter variation with a fixed collector speed well above the CTS reflects the situation in numerous studies, aiming at the production of straight fibers.[9, 27, 28] With information on the diameter and the collector speed, we could evaluate the respective melt flow rate for all three temperatures. Shown in Figure S4 in the Supporting Information, the volume flow rate at 75 °C does not significantly change throughout the 25 d of printing. For 85 and 95 °C the melt flow rate increases steadily over 25 d with 95 °C increasing at a higher rate. This, as well as the GPC data, suggests a steady degradation of PCL throughout the 25 d of heating.
2.4 Changes in Printing Properties
The most likely cause of a decrease in CTS during the first 5 d would be an increase in viscosity, which has several explanations. The first one involves increasing the average molecular weight by transesterification reactions/postpolymerization.[29] Transesterification might cause a change in viscosity if the initial chain length distribution is shifted towards the low molecular proportion which leads statistically to longer chains as it reaches a thermodynamic equilibrium. Second, the behavior could be explained by physical changes of entanglement in the melt. We wanted to test if an inhomogeneity of the melt caused this reduction in CTS during the first 5 d, by using two different thermal pretreatment methods. First, we compounded the pellets and immediately transferred a hot filled syringe into the heater. This did not have the desired mixing effect, perhaps due to an unavoidable transient cooling when placing the syringe into the MEW printer. In the second approach, we mixed the melt with a spatula directly inside the print head, which indeed resulted in a more stable CTS during the first 5 d. The results of these experiments can be found in Figure S5 in the Supporting Information.
Later in the multiweek period, thermal degradation for 85 and 95 °C becomes observable, with a rising CTS, fiber diameter and therefore overall flow rate. For 75 °C the print is again exceptionally stable with no major changes visible for CTS and the fiber diameter at vfix. This shows that with optimal processing conditions MEW can be exceptionally stable but is susceptible to small alterations in the printing properties of the material probably due to changes of the molecular weight if less optimal parameters are chosen.
2.5 Fiber Morphology
PCL crystallizes in spherulites which should add to the rough appearance of its fibers.[30] Figure 2D provides an overview of the fiber solidification and surface morphology with time. The fibers are generally consistent over the 25 d of printing for the 75 °C group (Figure 2), while fibers produced at 85 and 95 °C with vfix become slightly smoother with time, with fewer spherulites visible. Printing at both vfix and CTS shows a slight decrease in visual roughness of fibers when increasing the temperature from 75 to 95 °C. These differences are small and likely not significant; however, it is possible to change the surface morphology by changing printing parameters as previously shown.[31]
2.6 Fiber Stacking
The fiber stacking behavior affects the 3D structure and interfiber mechanics. All fiber walls were produced at vfix, as setting a single collector speed is standard practice for scaffold production.[32-34] At higher layer number the fibers are closer to the printhead where the ambient temperature is higher, which resulted in a more molten appearance in the upper layers with fibers merging (Figure 2D). At 85 °C the changes during the first 10 d are minor but with increasing time the fiber merging of the upper layers becomes substantial. The fibers at 95 °C behave similarly but this shrinkage already occurs at day 10. Conversely, there were no visible changes in the wall morphology of fibers throughout 25 d for prints performed at 75 °C (Figure 2).
2.7 X-Ray Diffraction
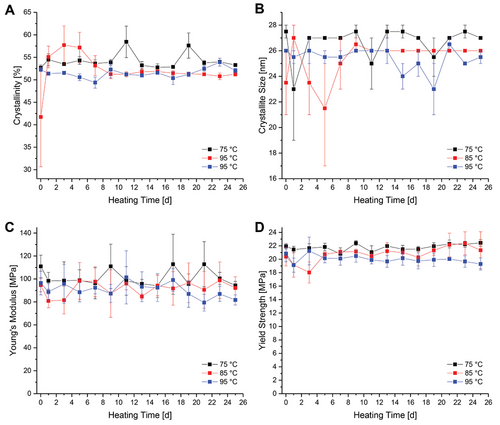
A change in the number and size of crystallites may provide an insight in an overall material change however the crystallinity remains at a value of 52.5 ± 3.4% across all temperatures (Figure 3A). For all samples, crystallites are 25.6 ± 2.3 nm with no major changes observed for all temperatures (Figure 3B). As the crystallinity of PCL is dependent on the molecular weight,[35] changes due to thermal treatment must be too small to have an observable effect with this technique. Some preparation issues account for small difference seen in the first 5 d for experiments performed at 85 °C and are outlined further in the Supporting Information.

2.8 Mechanical Testing
Tensile testing was performed using walls of 25 fibers printed at vfix. Similar to XRD results, the Young's modulus showed no changes throughout the experiment duration for any of the three temperatures (Figure 3C). This is in alignment with Grosvenor et al.[36] who showed that small changes in the molecular weight don't affect the Young's modulus. The yield strength (Figure 3D) is also mostly unaffected at 75 and 85 °C during printing with calculated values ranging from 19–22 MPa. The yield strength is reported to be influenced by the molecular weight,[36] meaning changes due to thermal degradation at 75 and 85 °C were too small to affect the yield strength. There is a reduction in the yield strength at the later periods for 95 °C, perhaps reflecting the thermal degradation changes seen using CTS measurements (Figure 1B). Overall, PCL is very durable over 25 d of constant heating for 75 and 85 °C and shows only small changes in the yield strength for 95 °C.
3 Conclusion
MEW is a high-resolution AM technology that is sensitive to small changes in the physical properties of the melt. When processed at temperatures just above its melting point for 25 d and with a mass flow rate of 1 to 5 µL h−1, PCL is a remarkably stable polymer to process. In the study, small changes in the CTS occurred in the first 5 d at 75 °C, followed by a stable period out to 25 d. There were several changes to the prints while processing at 85 and 95 °C—notably with the CTS and fiber diameter. The Young's modulus, yield strength or crystallinity, however, did not significantly change with time for any of the temperatures used, indicating that the CTS is an especially sensitive measure of processing changes. Overall, our study found that PCL is an extremely durable polymer to process via MEW, and a major reason that this polymer is the gold standard for this AM technology.
4 Experimental Section
Extensive information on the preparation and processing of samples can be found in the Supporting Information.
Materials
Medical-grade PCL (Corbion Inc., Netherlands, PURASORB PC 12, Lot# 1 712 002 224, 05/2018) was used for all the experiments.
MEW Printer
A custom-built MEW printer described previously[27] included a high voltage (HV) source (LNC 10000–05 pos, Heinzinger Electronic GmbH, Rosenheim, Germany) and heated with a silicon nitride ceramic heater (Bach RC, Germany). The polymer was extruded using compressed air controlled by a pressure valve (SMC, Germany) to a nozzle, positioned above a grounded stainless-steel collector mounted on x–y linear axis (Aerotech Inc., Pittsburgh, USA), controlled via G-code run by A3200 Motion Composer (A3200, version 4.09.000.0126, Aerotech Inc., Pittsburgh, Pennsylvania, USA).
Printing Parameters
MEW processing was performed using a 3 mL syringe (3 mL FORTUNA OPTIMA Luer Lock Tip, Poulten & Graf GmbH, Wertheim, Germany) equipped with a 25 G nozzle (length 7 mm; Nordson EFD Deutschland GmbH, Germany) protruding 0.5 mm beyond the HV brass electrode. The syringe was filled with 2 mL of PCL pellets before heating to 75, 85, and 95 °C without any pretreatment. A constant collector distance of 3.5 mm, voltage of 4.5 kV and an air pressure of 2.0 bar were used for all experiments. A weather station (TFA Dostmann GmbH& Co. KG, Reicholzheim, Germany) recorded the ambient air temperature and relative humidity (21.8 ± 0.3 °C and 40.6 ± 3.9%). Each experiment was set to a single temperature and was performed in triplicate and the MEW printer was not used for any other activities during each 25-d printing experiment. As the material was kept at the respective temperature for 24 h per day, a total heating time of 600 h was achieved per iteration.
Collector Configuration
Thermal Pretreatment of PCL
Two pretreatment methods were used, both with a print head preheated to 85 °C together with an empty syringe. In one approach, PCL was added to a compounder (Micro Compounder MC 5, Xplore Instruments BV, Sittard, The Netherlands) and mixed for 30 min at 85 °C and 50 rpm. For the second approach the PCL-filled syringe was placed inside the preheated print head and heated for 30 min. The melt was mixed inside the syringe with a spatula, followed by another 25 min heating prior to MEW.
Determination of Fiber Diameter
The fiber diameter was determined using scanning electron microscopy (SEM) (Crossbeam 340 SEM, Carl Zeiss Microscopy GmbH). After sputter coating a 3 nm layer of platinum (Leica EM ACE600, Wetzlar, Germany), images at day 0, day 1, and then every 2nd day including day 25 were taken. The images were then processed via a custom-made ImageJ macro. The segmentation step was adapted from the ImageJ plugin “DiameterJ”[37] using the “traditional” algorithm, and the “local thickness” plugin. This method analyzes the entire image and results are the mean of the diameter over the entire image. These mean values were then determined for all images (1008 images per temperature) to generate the mean value and the standard deviation of the fiber diameter for each second day for each temperature. Using the information about fiber diameter and CTS, the volume flow rate was calculated. The calculation can be found in the Supporting Information.
GPC Measurements
PCL samples (n = 1) were artificially aged using an oven (Memmert GmbH & Co. KG, Schwabach, Germany) at 95 °C for a total of 25 d. Samples were drawn after 2 h (0 d), 5 d, 15 d, and 25 d. The samples were then dissolved in chloroform (Carl Roth, Karlsruhe, Germany) with a concentration of 5 mg mL−1 and mixed for 2 h. These solutions were filtered through a 0.45 µm polytetrafluoroethylene (PTFE) filter, before measuring them using a GPC device from Malvern (Herrenberg, Germany) with a Viscotek GPCmax (in-line degasser, 2-piston-pump and autosampler) equipped with a column oven (35 °C), refractive index (RI) detector (Viscotek VE3580), a precolumn (Viscotek CGuard) and two columns (2x Viscotek LC4000L, length = 300 mm, width = 8 mm, porous styrene divinylbenzene copolymer, particle size 7 µm). The flow rate was kept at 1.0 mL min−1.
Rheology
The viscosity development of PCL over 24 h at 75, 85, and 95 °C has been determined with a Physica MCR 301 rheometer (Anton Paar, Graz, Austria). The test was performed with a 25 mm parallel plate configuration with a gap of 0.5 mm. After heating up the lower plate to the respective temperature the material was applied, trimmed, and measured in a rotational setup with a shear rate of 0.1 s−1. The setup was encapsulated in a cover to ensure temperature isolation.
Mechanical Testing
Mechanical testing was carried out using the fiber wall (Collector Configuration) fixed via double-sided tape to a frame, cut out of cardboard with a laser cutter (Rayjet 50 C30, Trotec Laser GmbH, Ismaning, Germany). The prepared frames (Figure S6, Supporting Information) were then used to test mechanical strength of PCL fibers using a dynamic mechanical analysis device (BOSE ElectroForce 5500, TA Instruments, New Castle, USA) in static testing mode (triplicate for N = 2 different prints at each temperature). The maximum strain was 150% and the rate 0.05 mm s−1.
X-Ray Diffraction
The scaffold was placed onto a sample holder consisting of a silicon single crystal wafer designed to minimize background signals. The sample holder was fixed in the XRD (D8 DaVinci Design, Bruker, Karlsruhe Germany) and examined with CuKα radiation (λ = 1.54060 Å) in a range from 10° to 50° 2θ, in 0.01° steps, a dwell time per step of 0.85 s while the sample was rotating at 15 rpm (n = 2). The calculations for the crystallinity are provided in the Supporting Information.
Acknowledgements
Financial assistance from the DFG (grant # 322483321) is greatly appreciated. The German Research Foundation (DFG) State Major Instrumentation Programme (INST 105022/58-1 FUGG) funded the Zeiss Crossbeam CB 340 SEM used in this study.
Open access funding enabled and organized by Projekt DEAL.
Conflict of Interest
The authors declare no conflict of interest.
Open Research
Data Availability Statement
Data available on request from the authors.


