Atmospheric absorption and scattering impact on optical satellite-ground links
Summary
Free-space radio-frequency (RF) communication links for intersatellite or satellite-to-ground communications are getting increasingly constraint by the insufficient spectrum availability and limited data rate of RF technology. With the advent of large satellite mega-constellation networks for global communications coverage, this limitation of classical RF communication becomes even more critical. Therefore, the establishment of point-to-point free-space optical link technology (FSO) in space will become of paramount importance in future systems, where the application will be for data-relays links, or for mega-constellations inter-satellite links, as well as for direct data downlinks, or from deep-space probes to ground. Further advantages of optical FSO—besides spectrum availability—is its increased power efficiency, higher data rates, avoidance of interference, and inherent protection against interception. When, however, these optical communication links have to pass through Earth's atmosphere, attenuation and scattering effects do influence the signal transmission. In this publication, we investigate the effects of atmospheric attenuation, including the effects of molecular absorption as well as aerosol scattering and absorption, for typical wavelength regions used for FSO, dependent on the link geometries. Based on transmission-simulation databases, we show useful spectral ranges and their specific attenuation strength. Free spectral transmission windows dependent on atmospheric quality and elevation angle are identified for reliable and efficient use of the optical transmission technology in space applications.
1 INTRODUCTION
Space-ground free-space optical (FSO) communication links—employing modulated laser beams—are currently developed to replace radio frequency (RF)1, 2 communication links in high-bandwidth application areas that have a point-to-point link characteristic, as typical for Earth-observation data repatriation or satellite communication constellations.3-8 To date, various experimental downlinks have been performed by research agencies and industries.9-12 This involved development of varieties of satellite laser terminals and their counter terminals.13, 14 While ground-satellite connections with geostationary satellites (GEO) remain under a constant link elevation and thus show no elevation-dependent dynamic, contacts to low-Earth-orbit (LEO) satellites involve rapid changes of the elevation angle and according variations in distance and atmospheric path length. In order to improve the performance and data rate of communication links, the assessment of the optical satellite downlink path is of utmost interest.15-17
The different channel effects in optical satellite downlinks are depicted in Figure 1. Total power loss depends on distance from satellite to ground station together with the signal's divergence angle and receiving antenna size.18 Pointing loss relies on the precision of dynamic beam pointing during ground contact, which might be hampered—among other causes—by the pointing control loop and its control-signal quality.19 The atmosphere's influence manifests through scintillation produced by the air's index-of-refraction turbulence (IRT),15, 16 through link blockage by clouds20 and through attenuation caused by absorption and different scattering effects—as we will focus on in this document (underlaid in gray in Figure 1).21
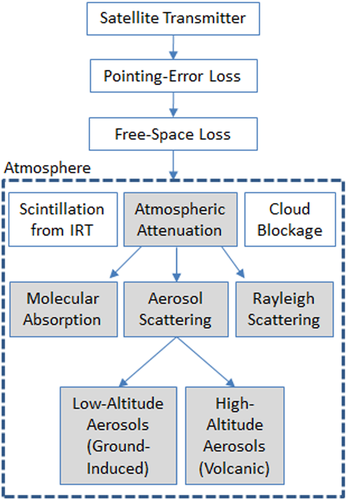
Optical waves are attenuated by Rayleigh scattering, aerosol scattering and absorption, and molecular absorption lines.22 The latter is a highly frequency-selective effect—caused mainly by water vapor and carbon dioxide—that can cause severe discrete signal absorption. Aerosol scattering is again separated into low-altitude effects connected mainly with the underlying terrain (up to heights of few km) and by volcanic ash that is long-term agglomerating in altitudes above 10 km. All those atmospheric effects impact the link quality through their integrated profile along the link path, thus change dynamically during one LEO-DTE (direct-to-Earth) link contact.
In this publication, we investigate the impact of atmospheric attenuation and scattering in the optical domain from 500 nm to 2-μm vacuum wavelength (150 to 599.5 THz frequency), on path geometries as typical for optical links between ground and satellites or space probes, at various link elevation angles, and to different optical ground station (OGS) locations. Different atmospheric constituent's models are applied to account for different geographic locations of OGSs. Favorable carrier frequencies are identified based on the availability of sufficiently large spectral transmission windows.
Besides spectrally slowly varying aerosol absorption, the broad spectral absorption regions are made up of a multitude of tiny strong peaks of molecular absorption resonance. Thus, precise knowledge of their exact occurrence, width, and strength is of paramount importance for optimally configuring bandwidth-efficient and reliable FSO communication systems.
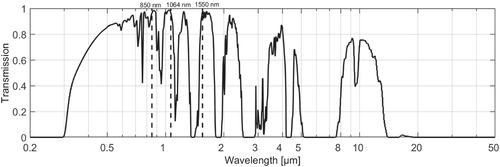
In the practically useful optical C-, L-, and U-Bands (1528–675 nm) and the region around 1 μm (Nd-YAG and semiconductor lasers), the total usable atmospheric transmission windows accommodate more than 17 THz, plus the nowadays lesser used region around 850 nm, compare Figure 2. However, molecular absorption lines can influence transmission also inside those atmospheric windows, as we will also investigate in this paper. Since the bandwidth of a communication signal can be smaller or larger than a specific absorption line, the effect of this “atmospheric notch-filter” ranges from a complete blockage to a selective spectral sectioning of the data signal's spectrum. Since state-of-the-art communication transmitters can be tuned by GHz precision over a large frequency range, we investigate the impact of the molecules' filtering effect continuously. Results reveal the beneficial choices in certain spectral areas.
 (1)
(1) (2)
(2)2 TRANSMISSION SIMULATION WITH ATMOSPHERIC CONSTITUENTS DATA BASES
Transmission depends on several parameters such as aerosol's and molecular constituents' vertical profiles of the atmosphere above the OGS, the link elevation angle, and the altitude location of the ground station above sea level. Simulation models based on molecular constituents and their matching vertical profiles have been developed and applied based on the HITRAN database and LibradTran simulation environment.23-25 In addition to HITRAN, there exists also ITU-R databases26, 27; however, the HITRAN database was used in this paper. Difference between these databases is detailed in O'Hara and Grischkowsky.28 Moreover, this paper also includes Rayleigh scattering, aerosol absorption, and scattering including effects of volcanic activities.
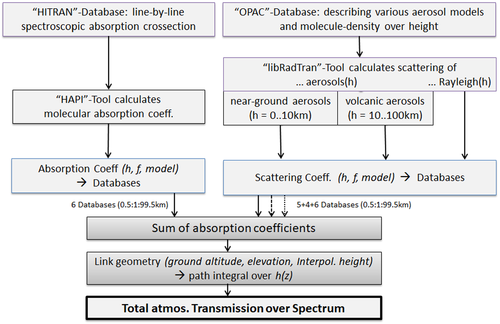
Besides air density above ground, the variations in the constituents mostly refer to the water vapor abundance, but local anthropogenic effects like carbon dioxide or methane input may also have impacts on transmission. Various atmospheric models with different molecular constituent vertical profiles have been developed to enable a modeling of the atmospheric signal attenuation in so-called absorption coefficients. By integrating these over the geometrical path profile, the total atmospheric signal absorption can be evaluated at specific frequency points (or vacuum wavelengths). Figure 3 summarizes the processing steps: from abundance profiles of particles and molecule isotopes at certain heights h under various atmospheric conditions deriving the local spectral absorption coefficients over frequencies f and by regarding the path-integrated absorption resulting in the total spectral transmittance from ground to space.
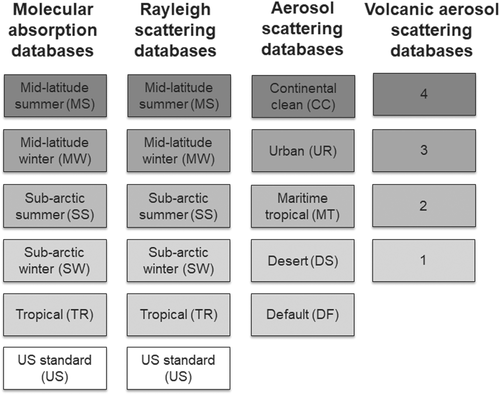
The pressure in Earth's atmosphere decays exponentially from sea level upwards with the 1/e altitude at ~7500 m. Molecule density being directly related to pressure decreases accordingly. However, additional effects like temperature and weather phenomena must be considered and also the effect of varying pressure on the molecule's absorptivity. The occurrence ratio of certain molecules (like water) varies strongly with altitude and atmospheric model. Also, the fraction of aerosols like water droplets, ash, pollen, or any kind of dust in the atmosphere is weather-dependent and reduces with altitude. Volcanic ash again tends to agglomerate at tropopausic altitudes and is dependent on global volcanic activity. At higher levels, some molecules are generated or removed by effects triggered through temperature, radiation, or the interaction with the space environment. Additionally, the absorption behavior of molecules depends on their isotope's mixing ratio. All these effects are modeled in the constituent profiles of atmospheric classes, such as subarctic summer and winter, mid-latitude summer and winter or U.S. standard, or tropical atmosphere as presented in Figure 4.29 The U.S. standard model is close to the mean of all the other models. Tropical and subarctic winter models represent the extreme environment. For aerosol, the different atmospheric models continental clean (CC), urban, maritime tropical, desert, and default are considered. CC model represents remote continental areas with very few aerosols only. The urban model on the other hand is for areas with strong human pollution. Maritime tropical model represents tropical areas which have a low density of water-soluble substance. Desert as name suggests is for arid and sand-dusty areas in the world. The default model represents rural aerosol in the boundary layer with spring–summer conditions and around 50 km of visibility. Finally, for volcanic aerosol scattering, volcanic activity levels (VALs) of 1 through 4 are defined, where 4 is the extreme volcanic aerosols, 3 is high, 2 is moderate, and 1 is background of volcanic aerosols,23, 30, 31 and it is assumed that these volcanic aerosols are encountered globally at any location on Earth.
3 ABSORPTION- AND SCATTERING-COEFFICIENT VERTICAL PROFILES
 (3)
(3) (4)
(4) (5)
(5)3.1 Molecular absorption lines
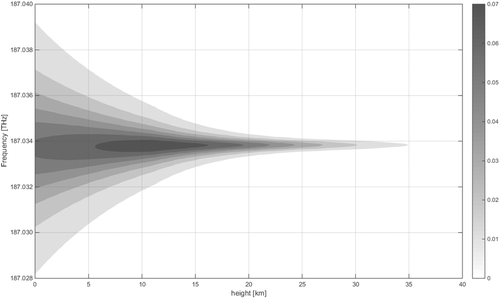
The molecular absorption effect is based on the photon absorption ability of a molecule at different electron energy levels. These energy steps vary slightly in position and width with temperature, pressure, and element isotope. Pressure- and temperature-broadening at lower altitudes leads to spectrally wider molecular absorption lines, as shown exemplary with a CO2-line in Figure 5. Here the spectral absorption width at ground level is around 5 GHz, while above 20 km altitude it reduces to below 1 GHz. As a result of these effects, the on-axis spectral absorption coefficient is highest between 6 and 16 km altitude.
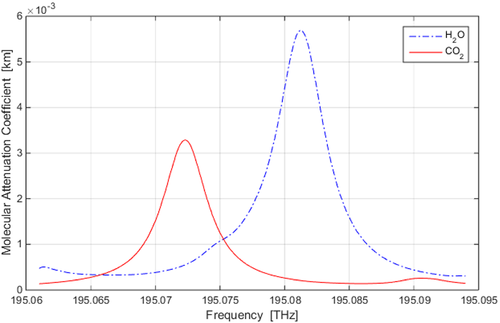
The most relevant molecules in our spectral region of interest are H2O and CO2. Figure 6 shows typical shapes of absorption coefficients at 3 km altitude.
While volume mixing ratio of CO2 is quite constant over altitude, the abundance of water reduces dramatically with height. Figure 7 shows the volume mixing ratio for H2O molecules with respect to altitude. Most water molecules are present below 10 km, and their abundance is significantly higher for tropical atmospheric models compared to others. Figure 8 shows the volume mixing ratio of further molecules (N2, O2, CO, and CO2). For some molecule types, the volume mixing ratio does not change significantly with height, as with CO2 or O2.
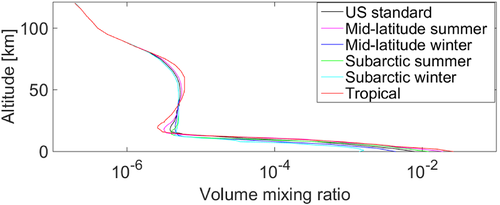

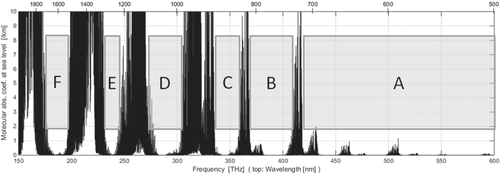
Figure 9 shows the sum of all molecular absorption coefficients at sea level for different frequencies (wavelength on top). Periodic molecular absorption lines maxima caused mainly by water vapor and carbon dioxide (900–980 nm, 1110–1160 nm, 1330–1520 nm, 1760–1990 nm, and so on) alternate with transmission windows (here with an unofficial window-denotation): visible region “A,” 740–810 nm “B,” 836–890 nm “C,” 990–1080 nm “D,” 1220–1300 nm “E,” 1530–1690 nm “F” (omitting a small window around 921 nm). Luckily, the transmission spectra of optical high-speed fiber transmission systems nearly coincide with one of the atmospheric windows (here denoted window “F”), making those components most useful for optical transmission through the atmosphere.
3.2 Aerosol absorption
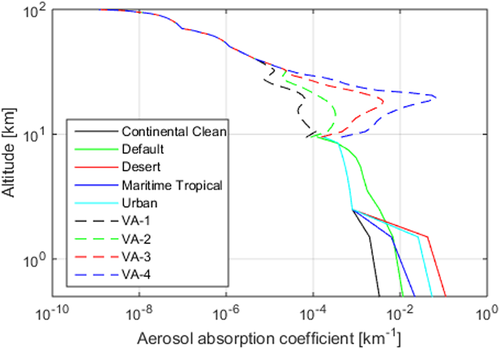
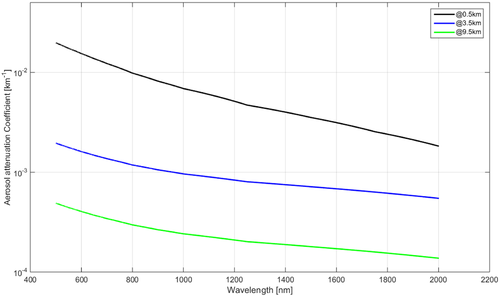
In addition to the molecular absorptions, aerosol also contributes to the scattering and absorption of the signal. Aerosols can have different origins. It could be created by particles coming from the space or on the ground or even created in the atmosphere from gaseous states. Most important are the aerosols created on the ground which affects the lower altitudes (1–2 km).17, 23, 33 Aerosols in boundary layers are generally classified as maritime, rural, urban, and desert model. Volcanic aerosols affect the aerosol concentration at higher altitudes.31, 34 Above 30 km altitudes, aerosols are composed of meteoric and cometary dust.17 Following figures show typical coefficients of aerosol absorption over altitude and optical spectrum. Figure 10 shows that aerosol effects are higher at lower altitudes for different models and converge at 2.5 km (except for default case) up to 10 km. From 10 km up to 14 km, we see the effect of volcanic activities up to 14 km depending on different levels (1–4). After 14 km curve for all VALs converges. Figure 11 shows that the aerosol absorption coefficient of certain aerosols changes slowly spectrally and confirms that aerosols are more prominent at lower altitudes.
4 TOTAL POWER TRANSMISSION FROM ATTENUATION COEFFICIENT PROFILES
From the constituent's abundance at certain locations, their effective attenuation coefficients can be deduced.24, 35 We define atmospheric attenuation in the direction of signal propagation as the combined effects of photon scattering and absorption, that is, any physical effect that reduces the received power, except for the geometric free-space loss by beam broadening or turbulence.
The values of coefficients αi depend on photon frequency, location P in the atmosphere (height), and the atmospheric model which depends on location and meteorological conditions (humidity, volcanic activity, aerosol constituents, etc.).
 (6)
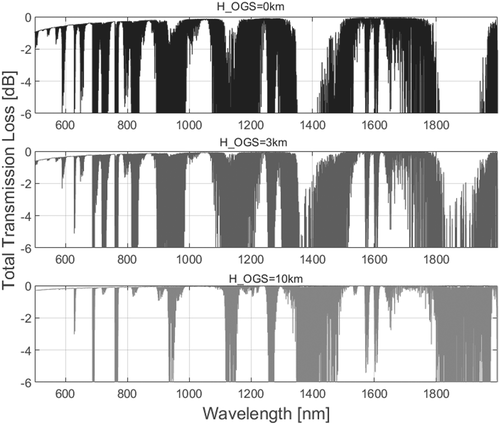
(6)Figure 12 shows the total transmission loss in dB towards zenith using the model for mid-latitude summer molecular and Rayleigh model (MS), CC aerosol absorption with moderate volcanic activity of 2, at three different ground station altitudes 0, 3, and 10 km above sea level. It can be seen that there is higher background transmission loss for the ground station at lower altitude due to ground-aerosol effects.
5 LINK GEOMETRY FOR SKEWED PATHS THROUGH THE ATMOSPHERE
To invoke the coefficients-vectors from the database, the height above sea level versus link distance must be derived in a situation as depicted in Figure 13. The height h above sea level can be calculated from link distance z, link elevation angle versus horizontal plane ε, ground station height HOGS, and possibly a terrain height (which represents the general ground level around a ground station sitting on an isolated mountain top for aerosol constituents)—as it can be assumed for many practical cases.
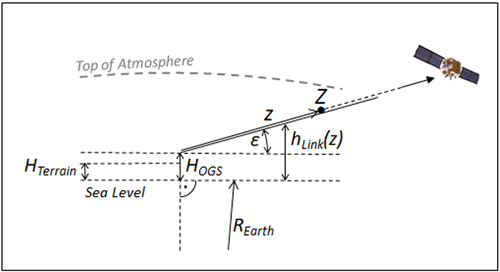
 (7)
(7) (8)
(8) (9)
(9) (10)
(10)5.1 Typical elevations considered for downlinks
Based on the probability distribution for a typical polar orbiting satellite with 500-km orbit height and a ground station at Swalbard (Spitzbergen), Figure 14 illustrates the cumulative elevation angle probability distribution over the horizon during downlink contacts. Obviously, the satellite is seen mostly under low elevations, and angles higher than, for example, 30° are rather sparse. Considering for downlinks a minimum elevation of 5°, the remaining occurrence from 5° to zenith has its mean at 65% with 15° elevation. In other words, all downlinks above 5° elevation will see elevations between 5° and 15° for 50% of the time. There exists no analytical solution for the CDF of elevation, however, numerical analysis confirms that the shape of the normalized distribution function is similar for different ground station locations when the orbit height stays constant.5, 36 This confirms 5°–15°–90° as the typical minimum–average–maximum elevation angles for any downlink contact of Earth-observation satellites.

6 DEFINITION OF REFERENCE SCENARIOS
Link scenarios—that is, elevation, type of atmosphere, and OGS location and surrounding topography—need to be considered: While some absorption lines are not critical at high OGS altitudes and link elevations above, for example, 15°, they might be completely blocking the signal when encountered in links from sea level in the tropics and at lower elevations.
- at least six molecular constituent profiles
- six Rayleigh scattering profiles
- at least five Aerosol scattering profiles
- and four levels of volcanic activity
- OGS at 1000 m a.s.l. and surrounding ground level at 500 m (i.e., ground level for low-altitude aerosols is 500 m): The OGS is located on a small mountain overlooking the plane below. Molecular and Rayleigh profiles are “Midlatitude-Summer,” and Aerosols are “Continental Clean”; volcanic activity is 2 of 4. While higher locations and even better atmospheres are possible, this appears as a typical beneficial situation favored for an OGS placement.
- OGS is at sea level (as well as the surrounding ground), and molecular profile is “Tropical” as well as Rayleigh scattering. Aerosol scattering is “Urban,” and volcanic activity is level 2 of 4. These parameters are certainly close to a worst-case atmosphere and location, but such a location might still be useful in terms of cloud freeness (in lower latitudes) or accessibility (close to a coastal town).
7 TOTAL TRANSMITTANCE OF OPTICAL FREQUENCIES AT DIFFERENT ELEVATIONS
Transmission frequencies should be selected far from any molecular absorption lines, then only the low aerosol, VAL, Rayleigh scattering, and the geometrical situation (link elevation, OGS altitude) are relevant. Typical laser signal wavelength regions (~800, 1064, and ~1550 nm) fall into transmission windows, however still are strongly affected by broadband aerosol absorption. In case A all atmospheric windows appear usable (i.e. attenuation better than -3 dB) (Figure 15), but the strong aerosol background attenuation in case B makes transmission too low at 5° elevation and above 250 THz (Figure 16).
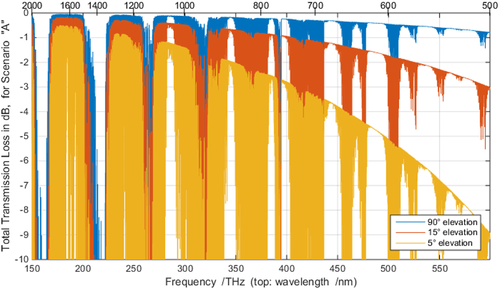
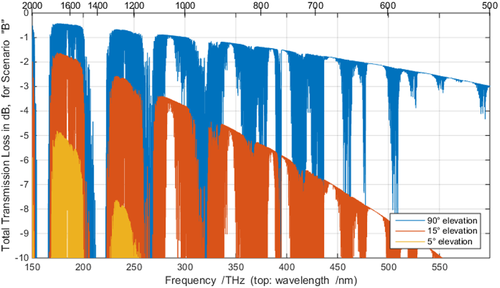
When looking only into spectral areas without molecular absorption lines, the impact from aerosol absorption can be identified separately. The two different scenarios here differ strongly as detailed in Figure 17: While for scenario A, any elevation above 5° offers acceptable aerosol attenuation better than −3 dB for the considered laser wavelengths, the stronger aerosol concentration of scenario B proofs less than −3 dB transmission below 10° elevation for wavelengths around 1550 nm, and even worse at shorter wavelengths.
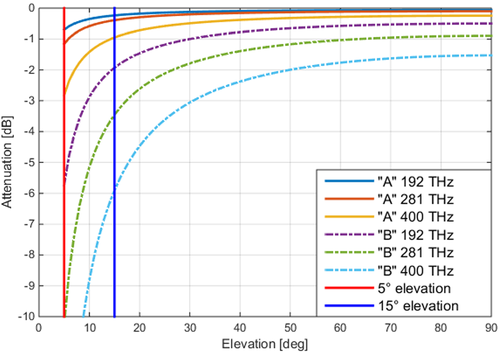
It has to be considered that values in Figure 17 are for cloud-free line-of-sight only. Cloud blockage or attenuation by thin clouds needs to be regarded additionally to calculate the availability of an OGS.
8 TRANSMISSION OF SPECTRAL CHANNELS IN THE OPTICAL C- AND L-BANDS
 (11)
(11)When applying DWDM technology to FSO satellite-ground links, the transmission of the atmosphere sets limits to the usable region. Towards higher frequencies, a limit was identified to be <195.9 THz (n ≤ 28) to avoid a very high water-vapor attenuation region in link standardization.37, 38 Figure 18 depicts the situation for our two atmospheric scenarios, comparing with the center locations of C- and L-Band channels. The absorption regions of CO2 around 1570–1580 and 1600–1610 nm dominate L-Band attenuation, while C-Band is mostly hampered towards lower wavelengths below 1540 nm by sporadic H2O lines. While but the impact from CO2 does not increase significantly towards lower OGS altitudes, the H2O lines show an intensified attenuation effect due to the higher water vapor density at low altitudes. Note that the local strength of CO2 absorption lines often is misrepresented in images due to their narrowness and regularity.
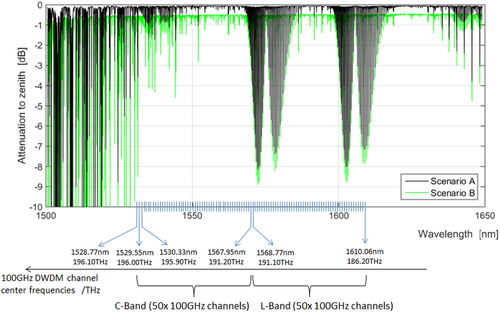
It is further assumed here that FSO channels in space communications are not bound to these 100 GHz steps but can be controlled independently.
When transmitting data-modulated optical carriers between ground and space, the atmosphere's aerosols insert a spectrally rather slowly varying attenuation effect, while molecular absorption lines act as delicate notch filters of typical some gigahertz width. Depending on the width of the data spectrum (i.e., data rate), these molecular notch filters (typically some GHz wide, compare Figure 6) can be broader than the data-spectrum itself, resulting in a complete loss of the data signal. Or they can be smaller than the data spectrum, thus only part of the signal might be filtered, possibly allowing recovering of the complete data at the receiver when combined with according error correction mechanisms. In the latter case, the type of modulation format is crucial: While classical on–off keying (OOK) allows loss of one complete side band, a coherent modulation format might suffer from such notch filtering anywhere in its signal spectrum. However, it seems not advisable at all to allow such atmospheric notch filtering, and critical regions should be avoided for the data spectrum in general. We follow this latter approach in the further analysis. Figures 19 and 20 show the optical power attenuation spectra around C- and L-Band for the three typical elevations and scenarios “A” and “B,” respectively. We concentrate on the frequency range from 1520 nm (197.232 THz) to 1620 nm (185.057 THz) or a total of 12.175 THz, which is slightly larger than C-plus L-Band.
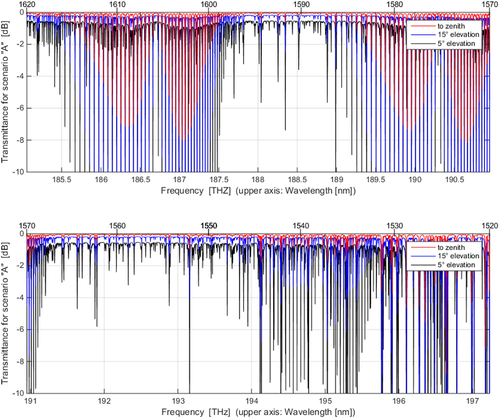
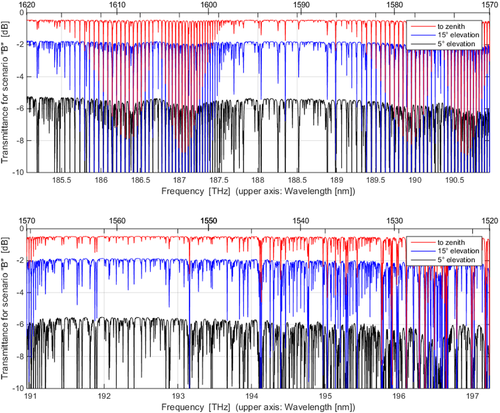
While today carrier frequency sources of fiber communication signals can be fine-tuned to some GHz stability, this might not be possible in space applications with strong and fast temperature variations. Another important issue is the Doppler shift of the carrier frequency caused by the high relative speeds of LEO satellites towards ground stations (up to ±29 000 km/h). If uncompensated, this velocity can cause a shift of up to ±3 GHz at 1552-nm signal wavelength, depending on the orbital situation. With these prerequisites in mind, it appears advisable to allow a guard band from data spectra to strong absorption lines of at least 10 GHz.
To identify suitable spectral areas, we concentrate on scenario “A” at elevation 5°, and with the prerequisites of strongest acceptable attenuation of −3 dB, a 10 GHz guard band and a minimum window size w of 100 GHz. Figure 21 indicates these windows marked in green, and Figure 22 shows a typical detail of these plots to discern the green, yellow, and red areas: Red regions show stronger attenuation than −3 dB, while the yellow areas are prohibited due to undersized window width or breaching of the guard band limitation. Agglomerated resonance lines of CO2 around 190 THz prohibit a larger part of the spectrum, while H2O lines sporadically induce gaps in the remaining regions.
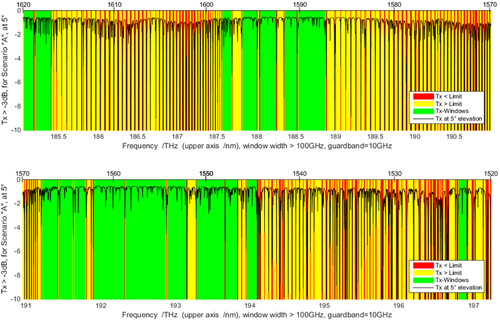

The results are summarized in Table 1. Scenario “B” proves not suitable for identification of transmission windows: Due to its very high aerosol attenuation background, it exhibits generally a stronger loss than 3 dB for 5° elevation.
| Window # | f-start/GHz | λ-start/nm | f-end/GHz | λ-end/nm | Window width/GHz |
|---|---|---|---|---|---|
| 1 | 185 067 | 1619.91 | 185 179 | 1618.94 | 112 |
| 2 | 185 218 | 1618.59 | 185 401 | 1616.00 | 183 |
| 3 | 187 574 | 1598.26 | 187 683 | 1597.34 | 109 |
| 4 | 187 828 | 1596.11 | 188 005 | 1594.60 | 177 |
| 5 | 188 053 | 1594.19 | 188 245 | 1592.57 | 192 |
| 6 | 188 361 | 1591.59 | 188 507 | 1590.35 | 147 |
| 7 | 188 530 | 1590.16 | 188 871 | 1587.29 | 341 |
| 8 | 191 216 | 1567.82 | 191 417 | 1566.17 | 201 |
| 9 | 191 437 | 1566.01 | 191 622 | 1564.50 | 185 |
| 10 | 191 646 | 1564.31 | 191 797 | 1563.07 | 152 |
| 11 | 191 913 | 1562.13 | 192 316 | 1558.86 | 403 |
| 12 | 192 337 | 1558.67 | 192 871 | 1554.37 | 535 |
| 13 | 192 895 | 1554.18 | 193 145 | 1552.16 | 250 |
| 14 | 193 291 | 1550.99 | 193 659 | 1548.04 | 368 |
| 15 | 193 682 | 1547.86 | 193 825 | 1546.71 | 144 |
| 16 | 193 962 | 1545.62 | 194 091 | 1544.00 | 129 |
| 17 | 196 803 | 1523.31 | 196 904 | 1522.53 | 101 |
From 185.057 to 197.232 THz, a total of 214 windows exist, but only the 17 stated in Table 1 are wider than 100 GHz after subtracting the 10 GHz guard band.
The gray underlaid windows roughly show the regions standardized by CCSDS for telemetry data downlinks (191.3–195.9 THz) and uplink beacon transmission (188.35–188.75 THz) in Optical On/Off Keying (O3K) links.38
When reducing window width requirements w to 50 or 25 GHz (but keeping the 10 GHz guard band), more windows become available, and the total available spectrum increases as summarized in Table 2.
| Scenario “A” | No. of windows | Total available spectrum 1520–1620 nm |
|---|---|---|
| w > 100GHz | 17 | 3.73 THz |
| w > 50GHz | 25 | 4.38 THz |
| w > 25GHz | 70 | 5.92 THz |
Large transmission fractions are leveraged when the gaps between CO2 lines can be employed; this however requires channels smaller than 30 GHz as can be seen in the lowest row of Table 2. Even more spectrum can be released by setting the minimum elevation higher than 5° or by accepting more maximum attenuation than −3 dB. Also, the atmosphere's properties vary strongly over time and location, submitting each OGS to a range of attenuation properties. Based on molecular absorption lines, the above analysis however provides a solid estimate for the design of reliable space-ground transmission systems.
An interesting option is the free spectral region around 1625 nm, offering approx. additional 2 THz, which however cannot yet be served with today's high-power amplifier components.
Laser link technology should account for any downlink system to work under the typical OGS conditions, which makes scenario “A” the reference for designing optical LEO downlink systems.
9 CONCLUSIONS
This work presents an overview of the attenuation effects in the optical domain as relevant for laser communication between satellites or space probes and their OGSs. The increased attenuation of the signal at low link elevation due to the increased atmospheric path length impacts strongly the LEO downlink situations. While high elevations occur rather seldom with LEOs, such are more prominent with links to space probes.
Starting from the necessity to verify the optical transmission spectrum for space missions, we explain the simulation process to calculate transmission of optical data signals through the atmosphere. A database of absorption coefficients for various atmospheric conditions was described and employed for this transmission analysis. We calculate absorption coefficient spectra regarding the geometry in space-ground links in general—like ground station altitude, surrounding terrain, and link elevation angles.
It is remarkable how severe the atmosphere can attenuate laser signals if chosen at inappropriate spectral location or when the OGS' altitude and surrounding air quality—including the abundance of water vapor, carbon dioxide, and aerosols—become adverse.
The impact of molecular absorption lines on modulated signal spectra for the DWDM laser region from 1520 to 1620 nm (optical C- and L-Band) was investigated in detail. Between several discrete and narrow molecular absorption lines from H2O and CO2, many smaller transmission windows have been identified. With the abundance of fiber transmission components—specifically precisely tunable laser sources, amplifiers, filters, and receivers—this wavelength region is favored for OLEODLs as well as optical intersatellite links and deep-space links. Thus, the understanding of its atmospheric attenuation behavior is of great importance. Due to the irregular appearance of water-vapor lines, their appearance requires detailed investigation to allow efficient use of the available spectrum. With CO2 lines showing up more regularly in the spectrum, an adopted carrier frequency grid falling in between those lines could be assumed for even better spectral usage, when the channel width is chosen below 30 GHz.
We deduced a set of 17–70 spectral transmission windows (depending on minimum window width) in the span from 1520 to 1620 nm only, resulting in available transmission spectrum between 3.7 and 5.9 THz. While these windows appear unproblematic in terms of attenuation for advantageous atmospheric quality and low elevations, even more spectrum can be leveraged when higher minimum elevation angles are considered.
This investigation paves the way to more efficient and reliable use of the optical space data spectrum for application in LEO Downlinks, for GEO feeder links, and for the future communication with deep-space probes.
ACKNOWLEDGMENTS
The authors want to acknowledge the work of Solveig Marie Froen on the absorption data bases, as well as our colleagues from DLR's Institute of Atmospheric Physics for valuable discussions. We also want to thank all contributors to the free databases and software like HiTRAN, HAPI, and LibRadTran who made this study possible.
Open access funding enabled and organized by Projekt DEAL.
CONFLICT OF INTEREST
The authors declare that they have no conflicts of interest.
Biographies

Dirk Giggenbach received the Dipl.-Ing. (MS) degree in electrical engineering from the Technical University of Munich in 1994 and the Dr.-Ing. (PhD) degree from the University of the German Federal Armed Forces at Munich in 2004. Since 1994, he has been working with the German Aerospace Center (DLR), at Oberpfaffenhofen, Institute of Communications and Navigation. Between 2000 and 2013, he established the “Optical Free-Space Communications Group,” later “Advanced Optical Technologies,” working on mobile laser communication technologies for aeronautic and space applications. Giggenbach has been involved in several national and international projects as team leader and project manager. His special research interest is the optical high speed communication through the atmospheric channel. In 2009, Giggenbach cofounded ViaLight Communications GmbH (now Mynaric AG), a spin-off from DLR's Institute of Communications and Navigation, developing mobile optical free-space communication systems. In 2011, he was a visiting researcher at the University of South Australia. Giggenbach is a delegate to CCSDS, member of the board of VDE-ITG, and regular reviewer for various scientific journals. He has published 100+ scientific articles, chapters, and books and has filed 30+ patents.

Amita Shrestha received the Masters (MSc) degree in Communications, Systems, and Electronics from the Jacobs University in Bremen in 2009. In 2010, she joined Institute of Communications and Navigation in German Aerospace Center (DLR). In DLR, she worked in the design, development, and operation of operation software for optical terminals. Since few years, she is actively involved in the CCSSDS standardization of Optical Communication technology on behalf of DLR. She has also supported and managed different projects related to development of optical transceivers, study of free-space optical channels, variable data rate techniques for such channels, and study of quantum communication technology. Her special research interest is the free-space high speed optical downlink from satellite to the ground.
Open Research
DATA AVAILABILITY STATEMENT
The data supporting the findings of this study were used under license and are available from third party (HITRAN, LIBRADTRAN, HAPI). Data are available from https://hitran.org/ and http://www.libradtran.org/.


