Study on the motion characteristics of bedload sediment particles under different sediment transport intensities
Abstract
Bedload studies at the particle scale may help grasp the essence of the problem. Existing studies suffer from short filming durations, limited data volume, and a narrow range of sediment transport intensity variations. This paper employs the high-speed photography technology and conducts experimental studies on bedload particle motion under 8 different sediment transport intensities. Using the latest image processing technology, over 6 million sediment particle coordinate points and nearly 400,000 particle motion trajectory curves were automatically obtained and used to compare the motion characteristics of bedload particles under different sediment transport intensities. The results show that under low sediment transport intensity, both the number of moving particles and particle motion velocity contribute to the bedload sediment transport rate, while under high-intensity conditions, the transport rate mainly depends on the number of moving particles. The probability density distribution of sediment transport rate is concentrated and varies within a small range under low-intensity conditions, exhibiting a tailing phenomenon. In contrast, under high-intensity conditions, the range of sediment transport rate values increases, and the probability density curve tends to be symmetric, more closely approximating a normal distribution. Additionally, the paper compares the longitudinal and transverse motion velocities of particles and the coefficient of variation of the bedload sediment transport rate.
1 INTRODUCTION
Bedload refers to the mode of sediment motion involving rolling and jumping particles (Gomez, 2022). It is one of the typical problems in sediment research, which is most controversial and under-researched despite a longest history of study (Ancey & Recking, 2023). The estimation of the bedload transport rate is of great significance for river management and reservoir sediment operation management (Cao, 2022). Despite extensive research, significant challenges remain, primarily because the stochastic movement patterns of sediment particles at different scales have not been fully understood. Ancey (2020) noted that existing bedload transport rate estimates deviate by more than one order of magnitude, mainly due to the unclear understanding of the random motion patterns of sediment particles under the influence of water flow.
Flume experiments are a primary technical means for studying bedload motion. In Mayer-Peter's classic experiments, the bedload transport rate over a specific time period, that is, the average transport rate, was measured (García, 2013). Singh et al. (2009) extended bedload transport rate studies to pulsating characteristics by obtaining time-varying transport rates. However, these transport rate values result from the combined effects of numerous sediment particles. The bedload transport rate is an essential parameter linking the microscopic particle motion patterns with the macroscopic group behavior characteristics of the particles. Although there are still some controversies over the definition of bedload transport rate at the particle scale (Ballio et al., 2018), studying bedload transport from the particle scale is a crucial breakthrough for understanding bedload motion mechanisms.
Recently, extensive studies have been conducted on sediment particle motion, which aimed at understanding bedload transport by observing sediment particle motion. Ancey (2010) simplified the bedload problem into a one-dimensional problem, and conducted a detailed study on bedload motion patterns in a narrow flume. In light of particle motion characteristics, they proposed a sediment particle motion model based on birth-death and in-out Markov processes, with a view to enhancing the understanding of bedload motion.
Actual natural rivers have a certain width, and numerous sediment particles can be observed from the top view. As one of the first to study particle motion and identification, Lajeunesse et al. (2010) used partially dyed particles to identify and capture bed particles. However, this method could only capture particles of different colors from the bed, and was unable to directly identify the motions of all bed particles. Furbish et al. (2012) conducted an in-depth study on particle mobility, longitudinal and transverse velocities of moving particles, and hop distance distribution through high-speed photography experiments, and proposed a probabilistic description-based bedload transport model. Wu et al. (2021) proposed a nonlinear transformation model based on velocity variation, which can describe velocity changes during particle hopping. Terwisscha van Scheltinga et al. (2021) studied sediment particle motions under dune conditions. They used the particle image velocimetry (PIV) technology to calculate particle velocity and analyze particle activity and sediment flux. Liu et al. (2019) studied particle waiting time distribution and its impact on anomalous diffusion, and concluded that the heavy-tailed distribution of particle waiting time was a key factor leading to anomalous diffusion.
Existing sediment particle motion studies are still weak due to insufficient measurement time and a limited range of transport rates. Therefore, we conducted flume experiments on bedload transport, and used the high-speed photography technology to capture sediment particle motion under different sediment transport intensities. We attempted to use automatic processing technology to obtain moving sediment particles and trajectories, and obtained instantaneous sediment flux. To our knowledge, the number of particles, coordinates, and observation duration in this study are considerable compared to existing studies, providing more comprehensive data for analyzing bedload transport.
2 FLUME EXPERIMENTS AND DATA PROCESSING
2.1 Experimental equipment and sand
The experiments were conducted at the Daxing Experimental Base of the China Institute of Water Resources and Hydropower Research. The flume used was 50 m long, 1 m wide, and 1.2 m high, with a variable slope design adjustable from 0 to 0.01. It was equipped with a 200 m3 underground reservoir. The flume featured an advanced measurement and control system, with flow rate regulated by a computer-controlled frequency converter using a feedback closed-loop control method. The flow rate was measured with an electromagnetic flowmeter before entering the flume. Water levels were measured with 8 ultrasonic water level meters installed on top of the flume and 12 steel rulers placed along the sides of the flume.
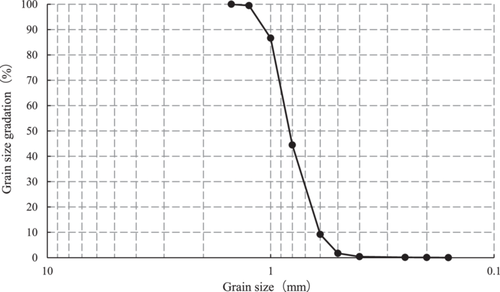
The flume's sides were made of glass, allowing for side observation of sediment particle motion and dune motion characteristics. Approximately 27 m upstream of the flume, 20 mm diameter pebbles were laid as a transition section, as shown in Figure 1. The experimental section was located downstream, with a 1 × 1 m sand-catching funnel spanning the flume set in front of the downstream gate. Sediment entering the funnel during the experiment was considered as bedload, and the sediment transport rate was the amount of bedload collected in the funnel per unit time. The experimental sand used was crushed quartz sand with a median grain diameter of 0.8 mm, as shown in Figure 2.

2.2 Filming of sediment particle motion
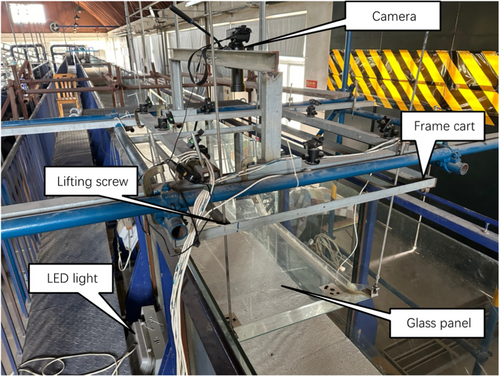
A custom filming device was used to capture sediment particle motion from the top of the flume, as shown in the Figure 3. The device consisted of a frame cart, a glass panel with raised edges on both ends, a lifting screw, and LED light. The entire setup can move along the flume. In the process, the cart can be moved to the desired filming location, and the lifting screw height can be adjusted so that the bottom glass panel just touches the flowing water surface. The camera is mounted directly above the glass panel using an independent stand. The stand and the flume are mutually independent to avoid the impact of flume shaking caused by water flow on the camera's shooting. The camera used had a resolution of 1920 × 1080 pixels and a shooting speed of 240 fps. A telephoto lens was used to clearly capture the motion of sediment particles. The actual filming scale of the bed surface was approximately 78 × 44 mm, with each pixel representing a length of 0.0407 mm, allowing it to fully capture sediment particle motion for this experiment.
2.3 Data extraction of random sediment particle motion
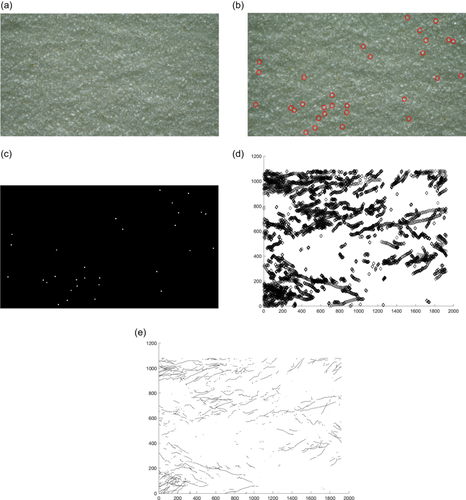
The method of background subtraction was used to identify the particles in motion. Background subtraction is a common technique in computer vison processing, which determines the background and moving objects in a sequence of frames based on their features. The parts remaining unchanged in multiple consecutive frames are considered the background, and each frame is subtracted from the regenerated background image, with the difference representing the moving objects. The background image is generated from multiple recent frames and continuously updated over time, allowing for the elimination of images generated by changes in the overall scenarios. By distinguishing stationary background areas and moving particles, the moving parts that persist in consecutive frames were identified. The OpenCV background subtraction algorithm was used to process the video data to obtain the moving sediment particles on the bed surface. The coordinates of the sediment particles in each frame were used as input data, and a recursive Kalman filter motion tracking and state estimation algorithm was applied to match the same particle across different frames, thus obtaining the sediment particle motion trajectories. Finally, the motion velocity was calculated based on the sediment particle trajectories.
Figure 4 illustrates the particle trajectory identification process described in this paper: Figure 4a shows the original image, Figure 4b displays the moving particles identified using the background subtraction method, Figure 4c presents the moving particles against a black background, Figure 4d depicts the particles identified from multiple consecutive frames, where each marker represents a particle, and Figure 4e shows the particle trajectories, with each line representing the motion path of a particle.
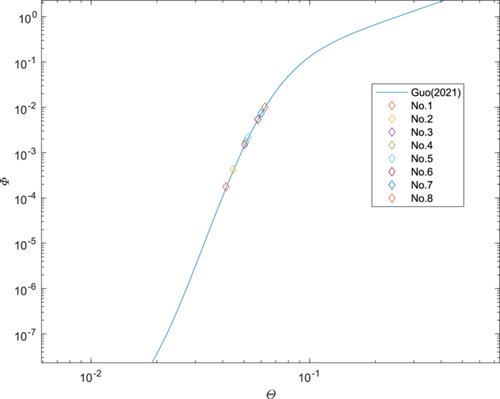
The flow discharge in the experiment ranged from 30 to 50 l/s, and under certain conditions, sand waves may appear on the bed surface. The purpose of this study is to investigate the random motion characteristics under different sediment transport intensities. All filming activities were conducted under relatively flat bed surface conditions. The sediment particle motion was filmed under eight sediment transport intensities, with each group of experiments filmed for 43.9 s. Using the aforementioned methods, sediment particle coordinates and trajectories were obtained based on different flow intensities, as shown in Table 1.
| Group | Duration (s) | Number of frames | Number of coordinate points | Number of trajectories | Average sediment transport rate (g/s) | Average sediment transport intensity Φ | Average shields parameter Θ |
|---|---|---|---|---|---|---|---|
| No.1 | 42.9 | 10,300 | 128,461 | 14,143 | 0.043 | 1.78E-04 | 0.0414 |
| No.2 | 42.9 | 10,300 | 196,003 | 20,720 | 0.101 | 4.20E-04 | 0.0446 |
| No.3 | 42.9 | 10,300 | 322,265 | 19,408 | 0.364 | 1.51E-03 | 0.0504 |
| No.4 | 42.9 | 10,300 | 444,119 | 33,521 | 0.413 | 1.71E-03 | 0.0510 |
| No.5 | 42.9 | 10,300 | 460,774 | 27,871 | 0.529 | 2.19E-03 | 0.0523 |
| No.6 | 42.9 | 10,300 | 1,199,073 | 77,140 | 1.307 | 5.42E-03 | 0.0579 |
| No.7 | 42.9 | 10,300 | 1,416,598 | 80,515 | 1.794 | 7.44E-03 | 0.0600 |
| No.8 | 42.9 | 10,300 | 2,066,318 | 122,775 | 2.438 | 1.01E-02 | 0.0624 |
2.4 Bedload sediment transport rate and flow intensity
3 RESULTS AND DISCUSSION
3.1 Longitudinal particle motion velocity
Based on experimental observations, bedload sediment particles exhibited strong intermittency, frequently transitioning from motion to rest state. In most cases, the motion direction of sediment particles aligned with the water flow direction, resulting in a positive motion velocity, with longitudinal motion velocity greater than transverse motion velocity. Some particles, under the influence of transverse turbulent vortices in the water flow, exhibited relatively high transverse motion velocities.
Overall, the motion velocity of sediment particles increased with the increasing bedload transport intensity. Under the conditions of experimental groups No.1 and No.2, the average particle motion velocity was relatively low, ranging between 0.02 m/s and 0.03 m/s. As the transport intensity increased, the particle motion velocity gradually increased to 0.06 m/s. After experimental group No.5, the particle motion velocity no longer increased, as shown in Figure 6. The changes in particle motion velocity can be fitted using a Logistic function, as shown in Figure 5, with the fitting formula and parameters provided in Equation (2).
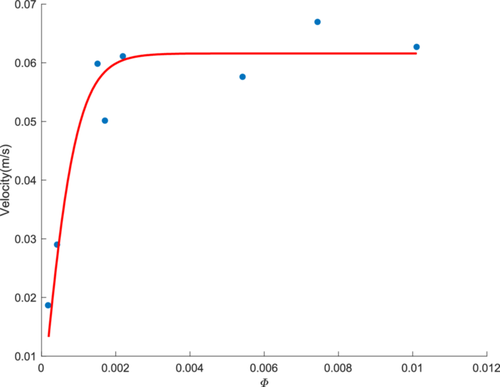
According to the calculation Equation (1) for bedload transport rate, the bedload transport rate was influenced by two factors: the number of particles moving on the bed surface and the motion velocity of the particles. Our experimental results indicated that under low-intensity conditions, the motion velocity of sediment particles was relatively low. When the sediment transport intensity reached a certain level, around a dimensionless transport intensity of 0.002 in this study, the average motion velocity of sediment particles no longer changed with the transport intensity. This implies that the motion velocity of sediment particles is not significantly influenced by changes in water flow intensity. Increasing the bedload transport rate can only be achieved by increasing the number of sediment particles, which is consistent with the view of Lajeunesse et al. (2010).
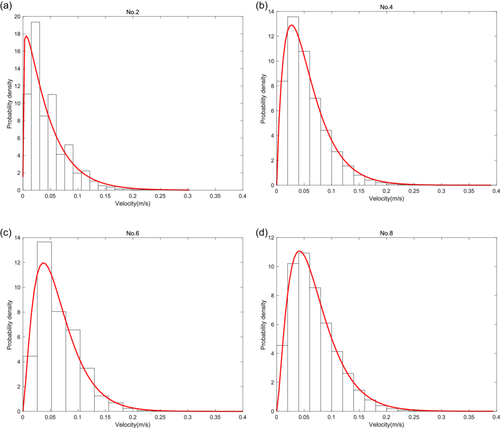
Figure 7a–d show the probability density distribution of particle motion velocities for experimental groups No.2, No.4, No.6, and No.8, respectively. Due to space limitations, the distribution curves for the singular-number groups are not included in the text, but their specific distribution patterns are similar to those of the even-number groups. It can be observed that even under relatively low-intensity conditions, there are sediment particles with relatively high motion velocities, such as in experimental group No.2, where the maximum motion velocity approached 0.3 m/s. Although the maximum motion velocity increases under high-intensity conditions, the range of increase is not significant. In experimental group No.8, the maximum particle motion velocity didn't exceed 0.4 m/s. The most concentrated particle velocity values were located in the middle-left of the density distribution, and the overall probability density distribution exhibited a tailing phenomenon, influenced by the presence of high-velocity particles. The longitudinal particle motion velocity obtained in this study does not match the exponential decay distribution mentioned by Lajeunesse et al. (2010). We attempted to fit the probability density distribution of motion velocities for each group using a Gamma distribution, and obtained good results, as shown in the following figures.
3.2 Transverse particle motion velocity
3.3 Variation in bedload transport rates
Figure 9a,b show the variation in bedload transport rates over time under experimental conditions. To avoid data overlap and improve readability, singular-number groups No.1, No.3, No.5, No.7 and even-number groups were plotted separately. According to the variation curves of bedload transport rates for each group in Figure 8, the instantaneous bedload transport rate exhibited significant pulsation characteristics. The observation frequency of the high-speed camera in this study was 240 Hz, and it can be seen that the bedload transport rate changed every 1/240 s. This was due to the constant changes in particle motion velocity and the continuous exchange between bedload particles and the bed surface.
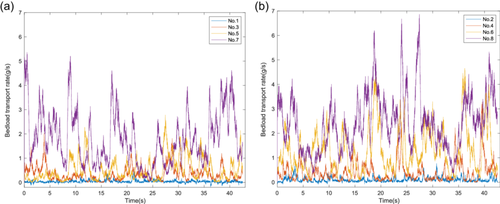
Under low-intensity conditions, the motion directions of sediment particles varied significantly. A considerable number of sediment particles moved in the direction opposite to the water flow, which may be related to large-scale vortices sweeping the bed surface. Some particles were observed to diffuse radially outward from the center under the influence of the water flow. Therefore, under certain conditions, the calculated instantaneous transport rate can even be negative, as the sediment particle transport flux in the flow direction within the observation area was lower than that in the opposite direction.
From Table 1, it can be seen that the maximum average transport intensity (Φ = 0.0101) was approximately 57 times higher than the minimum transport intensity (Φ = 0.0001775). In terms of instantaneous values, the measured maximum transport rate (6.865 g/s) was over 1800 times higher than the minimum transport rate (0.0038 g/s), with the difference exceeding three orders of magnitude. It fully demonstrated the multiscale random motion pattern of bedload transport rate.
It is noteworthy that the cross-order-of-magnitude differences in bedload transport rate mainly occurred under low-intensity conditions, especially when the transport rate approached zero. As observed by Paintal (1971), sediment particles moved only sporadically over long periods, resulting in naturally low calculated transport rates. In this sense, the low-intensity transport rates in this study were also several orders of magnitude higher than those observed by Paintal (1971). In the higher-intensity bedload sediment motion groups in this study, although there were significant fluctuations in transport rate values, the differences between the maximum and minimum values were within one order of magnitude. Moreover, the higher the transport intensity, the smaller the order-of-magnitude differences between the maximum and minimum values within the group.
3.4 Coefficient of variation of bedload transport intensity
Figure 10 illustrates the variation of the coefficient of variation of the mean square deviation of bedload transport intensity with bedload transport intensity. The experimental results show that under low-intensity conditions, the coefficient of variation of the mean square deviation was high, whereas under high-intensity conditions, the coefficient of variation was low. This difference arose from the distinct impact of bedload motion and bed sediment exchange on the transport rate under low and high-intensity conditions.
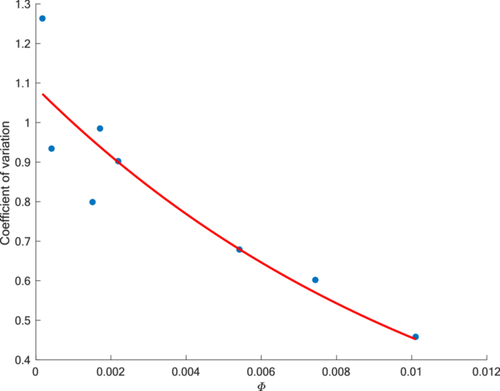
When the bedload transport rate is low and the bed sediment transport intensity is small, the transition of new sediment particles from rest to motion state and their addition to the bedload transport significantly influences the transport rate. This is because the number of particles contributing to the transport rate is relatively small, and any new particles joining or leaving will have a significant impact. This results in a large coefficient of variation of the mean square deviation and significant fluctuations in the bedload transport rate over time. Conversely, as the transport intensity increases, as shown in this study, and reaches 50 times or even 100 times higher, the number of particles contributing to the transport rate increases, making the impact of a single particle joining the transport rate relatively small.
It is important to note that although the coefficient of variation of the mean square deviation was smaller under high-intensity conditions, the absolute value of the transport rate varied greater than that under low-intensity conditions. Under high-intensity conditions, the proportion of particles transitioning from motion to rest state was small, but these transitions still occurred. The relative proportion was small, but the range of change was large, and the number of particles involved in the exchange was also large. Thus, the relative change was small, but the absolute change in bedload transport rate was still greater than that under low-intensity conditions. Under high-intensity conditions, a large number of sediment particles started to move, corresponding to the minimum or background value of transport. This means that under these conditions, there are always sediment particles moving within the observation range, maintaining a certain transport intensity.
3.5 Probability density distribution of bedload transport rates
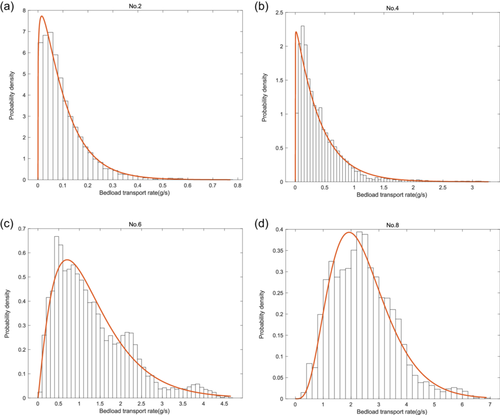
To further analyze the motion patterns of bedload particles under different intensities, we examined the probability density distribution of instantaneous bedload transport rates. The probability density distribution curves for the even-number groups in this experiment are shown in Figure 11a–d.
| Group | Shape factor (α) | Scale factor (β) |
|---|---|---|
| No.1 | 0.847 | 0.054 |
| No.2 | 1.173 | 0.087 |
| No.3 | 1.567 | 0.232 |
| No.4 | 1.031 | 0.400 |
| No.5 | 1.228 | 0.431 |
| No.6 | 2.169 | 0.603 |
| No.7 | 2.759 | 0.650 |
| No.8 | 4.763 | 0.512 |
From Table 2, it can be seen that as the bedload transport intensity increased, both the shape factor (α) and the scale factor (β) of the Gamma distribution exhibited a gradual increase. This indicated that the peak value of the probability density distribution gradually decreased, and the range of values covered by the distribution expanded, increasingly resembling a normal distribution. In other words, under low-intensity conditions, the transport rate distribution had a high peak, with small transport rate events occurring frequently and large transport rate events occurring occasionally. Under high-intensity conditions, the shape of the transport rate distribution resembled a normal distribution but with a right-skewed characteristic. Additionally, the range of small transport rate values was narrow, while that of large transport rate values was wide.
4 CONCLUSIONS
The movement patterns of sediment particles form the foundation for bedload research. In recent years, the random movement of sediment particles has received increasing attention. Due to limitations in experimental techniques and data processing methods, existing studies on particle random motion suffer from problems such as short filming durations and limited particle numbers. Most studies focus on particle random motion characteristics under specific conditions, and there are few studies on the movement patterns of sediment under different transport intensities.
This study employs the high-speed photography technology to capture videos of bedload sediment particle motion under eight different transport intensities. Each experiment lasted 43 s, and the latest image processing technology was used to extract over six million sediment particle coordinate points and nearly 400,000 particle motion trajectories. This provided high time-resolution bedload transport data, with instantaneous transport rates varying by more than three orders of magnitude, laying a solid foundation for detailed analysis of the random motion patterns of sediment particles.
Based on the obtained data, this study mainly focuses on the motion velocity of sediment particles and changes in bedload transport rates under different transport intensities, and provides the following insights:
Longitudinal motion velocity: Under low-intensity conditions, the longitudinal motion velocity of sediment particles varies greatly with transport intensity. As bedload transport intensity increases, the particle motion velocity stabilizes at a certain value and no longer increases continuously. The probability density distribution of longitudinal motion velocity of sediment particles follows a Gamma distribution.
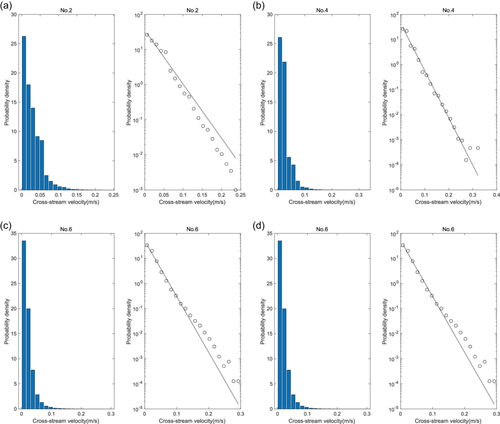
Transverse motion velocity: The transverse motion velocity of sediment particles is generally lower than the longitudinal motion velocity, following an exponential decay trend. Under low-intensity conditions, the transverse motion velocity is relatively large.
Pulsation characteristics of bedload transport rate: The bedload transport rate exhibits significant pulsation characteristics. Under low-intensity conditions, the coefficient of variation of transport intensity is high, but the amplitude is small. Under high-intensity conditions, the coefficient of variation is low, but the relative amplitude is large.
Factors influencing bedload transport rate pulsation: The pulsation of bedload transport rates mainly depends on two factors: particle motion velocity and the number of moving particles per unit area. Under low-intensity conditions, both factors contribute significantly to the transport rate, while under high-intensity conditions, the variation in particle motion velocity is relatively small, and changes in transport rate are mainly influenced by the number of moving particles per unit area.
Probability density distribution of bedload transport rates: Under low-intensity conditions, the transport rate probability distribution is concentrated, with a small range of values and a noticeable tailing phenomenon. Under high-intensity conditions, the distribution approaches a normal distribution, with the maximum probability density value shifting toward the center and an increased range of values.
Additionally, a deep understanding of the random motion characteristics of sediment particles is crucial for accurately estimating bedload transport rates in the future. This study obtains random motion data of sediment particles under different conditions through flume experiments. Due to space limitations, this paper only analyzes transport rates and macroscopic particle motion characteristics. Further analysis of particle random motion, such as single particle motion velocity and distance (Wu et al., 2023), the stop-and-go time of bedload particles and their exchange with bed particles, and the spatial distribution characteristics of sediment particles within the observation range (Rickenmann, 2024) are desirable in future studies.
ACKNOWLEDGMENTS
This work was supported by National Natural Science Foundation of China (12072373, 51679260) and China Institute of Water Resources and Hydropower Research (IWHR) Research & Development Support Programs (SE0145B022021).
ETHICS STATEMENT
None declared.
Open Research
DATA AVAILABILITY STATEMENT
The data involved in this paper can be obtained by contacting the corresponding author.


