Assessing the impacts of urbanization and climate change on urban drainage system
Abstract
Urban flooding is one of the significant issues that many cities are dealing with to ensure sustainable development. Upgrading the drainage systems is a standard measure that engineers have often used to reduce the risk of flooding. Because of climate change and urbanization, stormwater management systems may be inadequate to convey generated overflow in their catchment, which results in severe flooding in many cities worldwide. This research investigates climate change and urbanization's influence on urban flooding by simulating the EPA Stormwater Management Model for drainage systems in an urban catchment in An Ha, Tam Ky, Quang Nam. The results showed that urbanization shortens the initial abstraction ability while climate change increases extreme rainfall and water levels of receiving sources. Additionally, the impacts are even more substantial when the high urbanization rate increases by more than 70%, together with climate change.
1 INTRODUCTION
Urban flooding is one of the complex problems that many cities are dealing with to ensure sustainable development. Upgrading the drainage infrastructure systems is a standard and widely used solution to determine the risk of flooding in many areas (Paule-Mercado et al., 2017). Most drainage systems are built based on underground sewer systems and aim to release the immense amount of stormwater out of the system as expeditiously as possible (Arsov, 2003). Underground sewer systems will ensure urban appealing landscape and land-use savings; nevertheless, it will lead to difficulties and expenses in upgrading and especially maintaining these systems.
Many cities in Vietnam are becoming more vulnerable to urban flooding due to climate change. Vietnam is one of the most climate change-impacted countries worldwide (Raghavan et al., 2017; Schmidt-Thome, 2015; Tran, 2016). By 2100, the average sea level for the entire coastal strip of Vietnam will rise roughly 53 cm (32 ÷ 76 cm) according to RCP4.5 and 73 cm (49 ÷ 103 cm) according to RCP8.5 (Tran, 2016). According to the RCP8.5 scenario, maximum 1-day rainfall (Rx1day) tends to increase across the country by 10%–70%, with a more significant increase accounting in the Northeast, southern Central Highlands, and the Southern region) by mid-century (Tran, 2016; Yazdanfar & Sharma, 2015). Sea level rise is more likely to obstruct the discharging of flow rate and raise water levels in conveying system outlets. In addition, Vietnam's climate change scenario has stated the frequency and intensity increase in extreme rainfall in the central region, which increases the total amount of runoff to the system. Meanwhile, the designed capacity of the stormwater conveying system could be improved. Therefore, these two principal climate change consequences would increase the possibility of flooding in many urban areas in the country.
Under the pressure of urbanization, the total runoff volume that flows into the system also increases. The process of urbanization fundamentally changes the land covers, as permeable surfaces are gradually replaced by impervious ones, reducing the total amount of water recharged into groundwater since the flow changes in the direction of increasing the total runoff volume flow into the drainage system (Lee et al., 2013; Yazdanfar & Sharma, 2015). In addition, replacing infiltration soil layers which often have higher surface roughness than impervious soil layers such as asphalt roads, concrete, and roofs (Boulomytis et al., 2017), results in expeditious flow concentrate. Consequently, high-rate urbanization areas are more likely to be flooded than low-inbuild areas. Several studies have investigated the impacts of urbanization and climate change on urban flooding in Vietnam. These studies have confirmed the increase in the number of floods in both intensity and frequency in many urban areas, such as in the Red River Delta, which represents an increase in occurrences of flooding caused by the combination of climate change and tropical storms (Neumann et al., 2015) or monsoon (Raghavan et al., 2017). In the southern regions, flooding in Ho Chi Minh City (HCMC) occurs more frequently due to a combination of extreme rainfall (Dahm et al., 2013) and the consequences of urbanization (Storch & Downes, 2011). In the Mekong Delta, Huong and Pathirana's study aims to assess the impact of urban flooding due to climate change and urbanization (Huong & Pathirana, 2013) or a combination of sea level rise (Takagi et al., 2016).
Some limitations exist in urban flooding research in the central region of Vietnam. Most of the studies in the region were based on hourly rainfall data for analysis, while many urban flooding happens due to short and intensive precipitation so it may have unclear expressions for reaction of precipitation and urban catchment. Additionally, the rainfall patterns and characteristics are alternative in distinctive regions, so more investigation is necessary to understand urban flooding formation (Công & Long, 2017). In addition, only some studies have been able to investigate the local geographical conditions and their interaction with rainfall distinctive to flooding generation. Therefore, it is necessary to enhance comprehension of the urban flooding mechanism of flooding generation in the central region of Vietnam.
Urban areas in the central region are often affected by two categories of flood, which are fluvial flooding and urban flooding (Yu & Coulthard, 2015). On the one hand, fluvial floods are related to heavy rain in the river catchment and rising river water levels, which affects lower neighboring riverbanks and reduces urban sewer systems' drainage capacity. On the other hand, urban flooding results from overflow generation from extreme rainfall in an urban area. In some circumstances, the most severe floodings in this region w caused by combining these two flooding types, which requires critical understanding for developing adaptation measures.
Therefore, this study aims to investigate the potential effects of climate change and urbanization in the central cities of the central region of Vietnam. In detail, it will focus on clarifying the effects of climate change in terms of the increase in rainfall frequency that may occur in the region. At the same time, it also analyzes the effects of urbanization on flow formation in urban areas, which is essential for identifying the risk of flooding, creating a comprehensive fundament for adaptation to climate change and adjusting and developing planning accordingly.
2 RESEARCH METHODS
To achieve the study's objective, two possible methods could be manipulated for assessing the increase in urban flood risk. The first approach would be empirically evaluating historical measurements of floods, and the second method is simulations of processes in drainage systems on hydrology and hydraulic models (Tobio et al., 2015). The first method using experimental measurements is highly reliable, especially in areas with significant variations in land use and weather (Lee et al., 2007). However, the disadvantage of this process is that it requires a considerable investment of work, equipment, and resources. Therefore, this method is often performed in developed countries and applies to small watersheds with advanced monitoring systems. Another method is applying mathematical models to simulate the hydrological process in the study area. The method's main limitation is uncertainty in setting input parameters and boundary conditions for the model and depending heavily on subjective factors and the model builder's experience (Fontanazza et al., 2011). However, this method is highly effective in large areas which needing more monitoring data, like the central region of Vietnam.
Deficiency in monitoring data is a significant problem for stormwater management in many cities in Vietnam (Duy et al., 2018; Huong & Pathirana, 2013). Most water level monitoring stations are usually in rivers instead of stormwater drainage systems. This limitation may be due to difficulties in determining sewer systems' flow and water level and the need for more professional resources and equipment for monitoring. Therefore, hydrology and hydraulic models are widely used to simulate flow generation and conveying in stormwater systems.
Assessing the difference between simulated results from disparate climate scenarios highlights the impacts of climate change on urban flooding. This approach has been successfully implemented and confirmed in many studies by Huong and Pathirana (2013), Hassan et al. (2017), Ranger et al. (2010), and Willems et al. (2012). These scenarios are more likely to show recent and future climatic conditions, which is essential to highlight differences in flooding occurring over alternative periods in the drainage system. On the other hand, investigating long-term recorded data from hydro-meteorological stations can help obtain historical databases for developing scenarios.
2.1 Hydraulic model
One-dimensional (1D) hydraulic models have been widely used in the simulation of urban drainage systems. First, 1D is appropriate for simulating the physical phenomena of flow in urban drainage systems when the cross-sectional size is much smaller than the length of the system's pipeline (Akan & Houghtalen, 2003). This is because the variation of the vertical flow has little effect on the flow in the sewers. In addition, 1-D in-pipe flow models tend to be “relatively easy to set up, calibrate, and interpret” (Seyoum et al., 2012) than most two-dimensional (2D) and three-dimensional (3D) models for simulating. Establishing 2D and 3D simulation models is a complex procedure, requiring a resource-intensive time for setting. Finally, developing 1D flow simulation software is often seen as more convenient than 2D or 3D models. Therefore, simulation according to 1D flow models such as MOUSE or SWMM is widely applied in calculating and designing drainage systems and urban flooding.
However, some disadvantages exist in urban drainage simulation utilizing 1D modeling. The most important thing about the 1D model is the difficulties in simulating physical interaction between water flowing in the drainage and flow on the surface (Seyoum et al., 2012). In addition, 1D models are more likely to ignore essential impact factors when simulating flows in flooded areas, such as bilateral or lateral diffusion and changes in the soil surface during simulation (Kuiry et al., 2010; Seyoum et al., 2012). Thus, coupling a 1D model to simulate a stream in a sewage system and a 2D flow for surface runoff is a possible solution to identify our flood hazard zones in the interested areas. This application is confirmed in many studies and is widely accepted (Leandro et al., 2016). However, for the scope of this study, 1D models are suitable because they only simulate the impact of flow rate changes in urban stormwater and highlight the difference in the locations prone to flooding.
Among the types of models, the Stormwater Management Model (SWMM) is one of the widely used models to simulate urban drainage problems in academic and engineering communities (Akan & Houghtalen, 2003). SWMM presents competence in dealing with a wide range of technical and management problems in consulting and research. For example, the model is used to assess the impacts of climate (Huong & Pathirana, 2013; Niazi et al., 2017), evaluate the influence of quasi-natural measures in urban flow management (Qin et al., 2013; Tobio et al., 2015) or assess the quality of water generated by rain in urban areas (Akan & Houghtalen, 2003). In addition, SWMM allowing users to evaluate freely from the internet tends to support research institutes and individual users. Moreover, individual users can quickly and easily master the model to support their work.
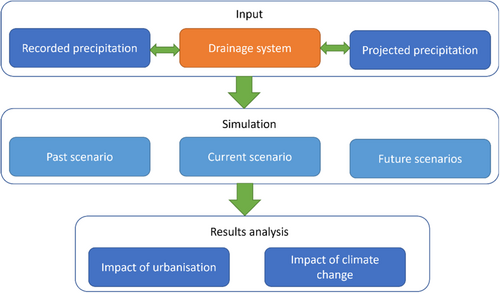
Therefore, this study will employ hydrology and hydraulic processes in drainage systems using SWMM. Key stormwater characteristics, including notes and pipelines, will be simulated for each catchment in the area. In addition, other considerations, such as the basin's penetration, slope, and shape, should also be described reflectively to improve simulation accuracy and reduce the uncertainty of results. The model parameters follow suggestions from national standards and experiences in related processes. Figure 1 represents the process of assessing the impact of urbanization and climate change for Tamki urban area.
2.2 Research area
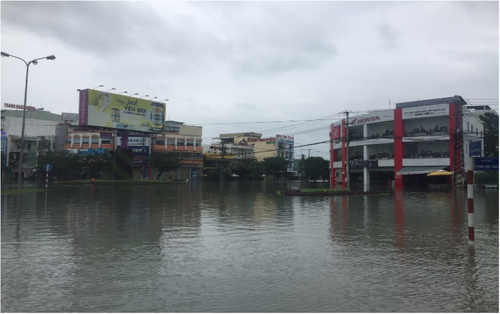
The city of Tamky is the research area for this study. The city has had severe flooding recently, which caused extensive damage to people's lives and socioeconomic production activities. Total estimated damage due to floods in December 2018, October 2020, and October 2021 (Figure 2), caused VND 150 billion, VND 49.5 billion and VND 17.1 billion, respectively. In addition, the city is one of the impacted areas in the central region of Vietnam, and the city urbanization process has recently occurred. As a provincial city, Tam Ky's urbanization process took place rapidly from a town (Type III urban area) in 2006 to a provincial city (Type II city) in 2016 and planned to urban Type I city standard by 2030. According to statistics and satellite images, from 2016 up to now, the inner city of Tam Ky city and its vicinity have been invested in developing vast technical infrastructure, such as traffic routes and bridges, embankment, industrial park, new urban areas along the river with relatively high construction density.
Due to climate change, Tamky is becoming more vulnerable to urban flooding. Flow from the stormwater management system in the city directly discharges to three main rivers, Ban Thach, Tam Ky, and Truong Giang, before reaching East Sea through Cua Lo and An Hoa estuaries, which are predicted to rise due to climate change. Therefore, stormwater flow may be obstructed, reducing discharge capacity throughout the system. In addition, the extreme precipitation in Tamky can increase by over 10% by the end of the century.
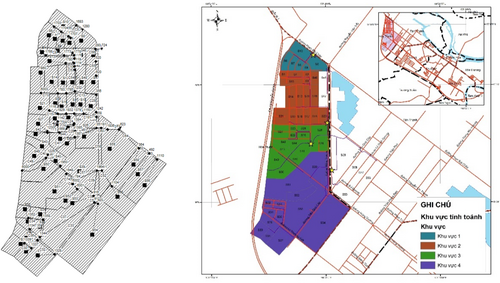
In detail, a model for a drainage system in the An Ha Residential area was established to represent the whole of the city (Figure 3). The area has most characteristics of the urbanization process of Tam Ky. Many floodplain areas mostly changed into residential areas with entire infrastructure, some areas are on the process to entirely becoming urban areas and planned to be converted into urban areas. According to these characteristic, the research area are divided into four subareas (Figure 3 and Table 1) for investigating and assessment potential influences of altering urban surface and precipitation in urban flooding. In the context of climate change, the Urban Area is at risk of severe flooding when it has to cope with a significant increase in extreme rainfall. The region is divided
| Infiltration land cover percentage | |||
|---|---|---|---|
| Catchment | 2011 | 2021 | 2030 |
| Zone 1 | 28.3 | 90.6 | 98 |
| Zone 2 | 40.1 | 88.1 | 98 |
| Zone 3 | 26.4 | 82 | 98 |
| Zone 4 | 28.6 | 80 | 98 |
- 1.
The exit direction from the basin to the west of Phan Boi Chau Street in a residential area 10 flows through the culvert through Phan Boi Chau Street to Tra No field (after the residential area on Nguyen Van Troi Street) to drain naturally into the river.
- 2.
The exit direction of a central part of the residential area flows into Khe Sung Stream (slowly from Nga Ba detention pond through the basin to the west of Nguyen Hoang Street), flowing to Fork Lake through the Khong Mieu culvert into Ban Thach River.
- 3.
Exit direction from Nguyen Hoang Resettlement Area, running along the back of Nguyen Binh Khiem school, through Hung Vuong culvert, entering Khe Sung stream (in the premises of Hien Trang hotel).
2.3 Climate change scenario
2.3.1 Extreme precipitation changes scenarios
Due to climate change in the central region, extreme rainfall may increase considerably. The change statements examined in the IPCC (2013) report predict that rainfall in central the region is projected to increase by 1%–7% by 2050 compared with average historical data from 1986 to 2005 in the RCP4.5 average emissions scenario. Precipitation may increase by 5% by the end of the 21st century (2%–10%). The observations for the Vietnam region also indicate an increase in the number of rainy days in a year and an increase in extreme rainfall for the rest of the century.
In addition, regional climate models developed for the climate change scenarios of Vietnam have shown detailed projections of annual precipitation and rainy season changes for future climate in the interested research area. In the RCP 8.5 scenarios, the rainfall at Tam Ky station in 2048–2065 could rise by 11.8% over the winter of 1984–2005 (Raghavan et al., 2017). Meanwhile, following the average GHG emission scenario, RCP 4.5 is expected to be higher than the forecast RCP 8.5. During the rainy season (winter), precipitation would increase by 12.6% in 2050 and 54% in 2010 compared with the historical baseline.
2.4 Climate change scenarios
Due to climate change in the central region, extreme rainfall may increase considerably. The change statements examined in the IPCC (2013) report predict that rainfall in central the region is projected to increase by 1%–7% by 2050 compared with average historical data from 1986 to 2005 in the RCP4.5 average emissions scenario. Precipitation may increase by 5% by the end of the 21st century (2%–10%). The observations for the Vietnam region also indicate an increase in the number of rainy days in a year and an increase in extreme rainfall for the rest of the century.
In addition, regional climate models developed for the climate change scenarios of Vietnam have shown detailed projections of annual precipitation and rainy season changes for future climate in the interested research area (Table 2). In the RCP 8.5 scenarios, the rainfall at Tam Ky station in 2048–2065 could rise by 11.8% over the winter of 1984–2005 (Raghavan et al., 2017). Meanwhile, following the average GHG emission scenario, RCP 4.5 is expected to be higher than the forecast RCP 8.5. During the rainy season (winter), precipitation would increase by 12.6% in 2050 and 54% in 2010 compared with the historical baseline.
| No. | Scenarios | Urbanization area | Description |
|---|---|---|---|
| 1 | Scenario 1 | 2011 | Urban areas before the time of rapid urbanization |
| 2 | Scenario 2 | 2018 | Shows the current level of urbanization |
| 3 | Scenario 3 | 2030 | The urban area has been completely urbanized |
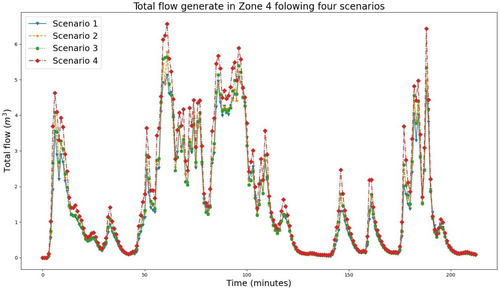
| 4 | Scenario 4 | 2030 | The area has been fully urbanized with precipitation under climate change scenario RCP4.5. |
2.5 Urbanization scenario
Climate change scenarios will combine with the urbanization scenarios, which are built based on the planning of Tam Ky over the period. In addition, images and interpretations from satellite aerial images help determine the period as well as the degree of urbanization of the area (Figure 4). Each scenario is represented in the mathematical model through land cover and topographic change parameters. The urbanization process in Tam Ky has taken place firmly since 2013. Therefore, the city's condition in 2011 is selected to demonstrate before the urbanizing scenario, while 2021 and 2030 account for partly and wholly urbanized, respectively.

2.6 Design rain
In recent years, the An Ha urban area has suffered severe urban floodings, such as in 2013, 2018, and 2021. These events have significantly affected people's lives and socioeconomic populations. The selection of rain to simulate will affect the assessment results of urban drainage capacity and show the interaction process of the basin for different rainfall patterns. This study uses rainfall in 2018 and 2021 to simulate the scenarios (Figure 5). Both rainfall events have a concentrated shower period from 50 to 60 h with approximately the same intensity. The most significant difference is when the two peaks of the rain appear. While in 2018, the two peaks are further apart than in 2021, and the latter is higher than the former. Meanwhile, the rain in 2021 has a higher peak of the previous rain than the latter's peak. The analysis and evaluation of two rainfalls will identify the rain patterns and the process of their influence on the basin.
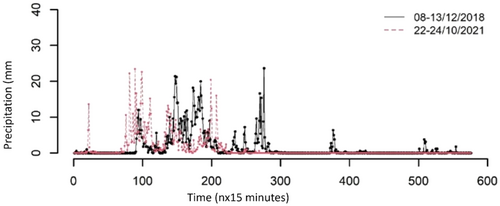
Both rainfall events have a concentrated shower period from 50 to 60 h with approximately the same intensity. The most significant difference is when the two peaks of the rain appear. While in 2018, the two peaks are further apart than in 2021, and the latter is higher than the former. Meanwhile, the rain in 2021 has a higher peak of the previous rain than the latter's peak. The analysis and evaluation of two rainfalls will identify the rain patterns and the process of their influence on the basin.
2.7 Calibrate the model
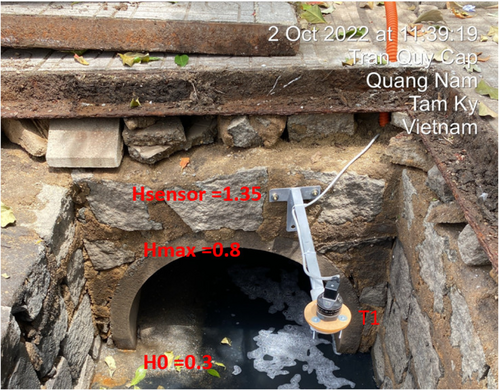
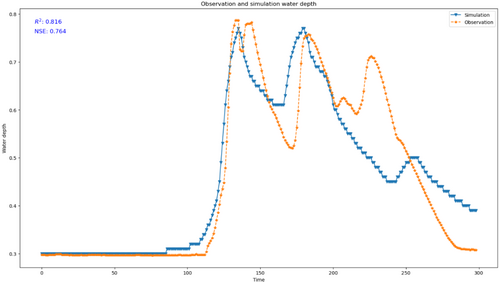
A temporary station is established, measuring water depth to calibrate the simulation model's parameter (Figure 6). This activity will cover limitation in water level monitoring in urban drainage systems in the research area. Therefore, the simulation and observation of water depth at the monitoring maintenance hole for an event happened from 19 to 23 h on October 8, 2022. With R2 and NSE indexes of 0.816 and 0.76, respectively, the simulation result has shown a strong correlation to the observation of water depth (Figure 7). It can lead to the conclusion that the set-up model is suitable for simulating alternative scenarios.
3 RESULT
3.1 Results based on urbanization processes
The simulation results show the influence of urbanization on flow formation in the study area. They are shown by the flood peak appearing later than the urbanization scenarios. In the early stages of runoff formation, when the ground is not saturated with water, the simulation results show that a large amount of discharge has decreased due to allowing precipitation to infiltrate the soil. However, the efficiency of impermeable aquifers decreases rapidly when the soil is saturated with water, and a small amount of runoff is also reduced but not significantly compared to the period before the soil saturation.
Figure 8 shows the effectiveness of permeable surfaces in reducing total flow generated from subcatchments by representing the interaction between simulated catchments in distinctive urbanization rates and flow through flow per area unit. Subcatchments with low urbanization rates fluctuate less than highly dense urban areas, even in high precipitation intensities. Unit flow generated from a unit of area is more significant in Zone 1 and Zone 3, which have higher urbanization rates than the others, with the highest value reaching 0.25 m3/ha. At the same time, the amount for Zone 4 is around 0.15 m3/ha. The consequence results from abstracting a large amount of outflow and latency in flow concentration in pervious land covers. In contrast, it confirms the increased risk of inundation in areas with high urbanization in the research area. In 90 min of time-lapse, the flow produced from catchments in Zone 4 is higher than the other due to latency caused by slow flow rate concentration in flow generation.
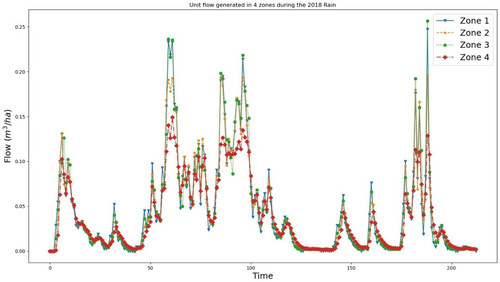
Areas that are not firmly urbanized can reduce the risk of flooding compared with urbanized areas when there are short-term high-intensity rains. When the rains last beyond the soil saturation point, the difference is not significant. However, when embedded in the entire system, reducing the amount of concentrated water simultaneously significantly affects the flow concentration. The peak formation period also shows urbanization's influence on the flow formation process in urban areas. Consequences of urbanization. In an area with a high degree of urbanization, the time when flood peaks and flows appear.
3.1.1 The influence of rain patterns
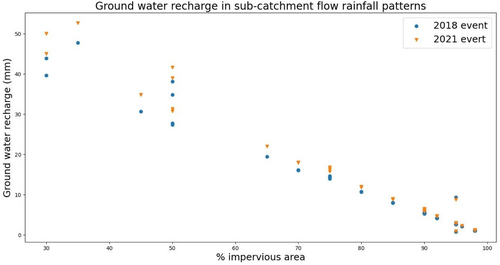
With two different rain patterns, the influence of rain patterns on the process of flow formation in the basin, primarily when urbanization occurs. Figure 9 shows the total amount of recharge seepage losses in subbasins with different percentages of impermeable soil. The graph shows that the less urbanized subbasins will have a large amount of rainwater infiltrating the ground, reducing the rate of runoff concentrated into the system. This ratio decreases as the amount of urbanization increases. The graph also shows that the amount of water infiltrating into the ground according to the pattern of the rain in 2018 is more unfavorable than in 2021, when the amount of infiltration loss is more extensive.
The variation between the amount of water recharged into groundwater between two distinctive rainfall decreases rapidly in areas with urbanization rates over 70%. This phenomenon may refer to effectiveness reduction in flow abstraction that may not depend on rainfall characteristics in highly urbanized areas. Another argument explains the reduction is the exchange of runoff between impervious and pervious areas in the catchment. In a high urbanization rate subcatchment, infiltration areas are more likely to receive potentially enhanced flowrate (Figure 10) from the over and easily reach saturated easy point compared to the low impervious area and lead to a reduction in the effectiveness recharge generated flow.
4 CONCLUSION
The research has investigated the impact of climate change and urbanization in urban areas in Tam Ky, Quang Nam. By simulating the process of rainwater collection and drainage in the An Ha urban area using SWMM software, this research evaluated the impact of urbanization on the formation of runoff in four zones according to four scenarios in the area. The high urbanization density reduces the initial abstraction via infiltration, significantly contributing to urban flooding in the area. When the urbanization rate increases by more than 70%, the efficiency of reducing the flow decreases rapidly. The effect of urbanization is evident when the rains occur over a long period when the occurrence of two rain peaks is just a short distance. By the time the soil reaches saturation, the process of the initial abstraction via infiltration is significantly reduced.
ACKNOWLEDGMENTS
This study was sponsored by the Science and Technology Fund of Quang Nam Province, No. 32/HD-SKHCN, subject title: Assessment of Flooding and Proposed Solutions to Tam Ky City in the Context of Urbanization and Climate Change.
ETHICS STATEMENT
None declared.
Open Research
DATA AVAILABILITY STATEMENT
The data that support the findings of this study are available from the corresponding author upon reasonable request.


