Method on sediment management for restoring the lower reach of the Kelani River, Sri Lanka
Abstract
The present study describes a river channel management method for restoring riverine environments degraded by sand mining in rivers. Specifically, three conditions that must be met for a restored river channel in the lower reach of the Kelani River in Sri Lanka were proposed: (1) flood discharge capacity of the channel for a given flood, (2) prevention of saltwater intrusion, and (3) creation of a diverse physical environment. The allowable mining volume satisfies the three conditions, while continuing to mine sand was discussed based on the sediment budget calculations in the target river reach. In this case, the amount of sediment stored in the target reach and its variation are determined by the amount of sediment supplied to the target reach, the amount of sediment discharged from the target reach to the sea, and the amount of sediment excavated. This means that the dynamic equilibrium channel of the target reach is determined by the amount of sediment supplied and the amount of sediment excavated. The amount of sand mined when the dynamic equilibrium channel meets the three conditions of the restored channel is a candidate for the allowable amount of sand mined. One of these, the most desirable one, is set as the allowable mining volume. As described above, we proposed a method to develop a restoring reach taking the sediment budget and associated hydraulic and hydro morphological conditions in the target reach into consideration.
1 INTRODUCTION
The Kelani River, a major river in Sri Lanka, plays a crucial role in the country's economy, as it flows through Colombo, the capital city. This river is a significant source of drinking water for Greater Colombo and generates hydropower from its upstream location. The aquatic ecosystems and biodiversity of the Kelani River are crucial components of the catchment area. The river has historically been a major supplier of sand in Sri Lanka, with an average annual supply of 600,000 to 800,000 cubic meters. However, extensive sand mining has resulted in a noticeable lowering of the riverbed, which has been lowered by approximately 10 cm per year since the 1990s. During the dry season, the water intake at Ambatale is exposed to saltwater intrusion. Besides, Downstream areas are highly susceptible to flooding due to drainage issues, terrain, and location.
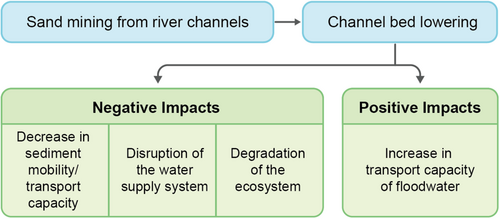
Figure 1 depicts the impact of sand mining on the Kelani River's environment. Sand mining can reduce the risk of flooding by increasing the channel's transport capacity for floodwater due to the riverbed's lowering. However, sand mining adversely affects the sediment transport processes with changing of the hydraulic responses (Bhattacharya, Dolui, et al., 2019; Molenda et al., 2021; Sadeghi & Kheirfam, 2015). Additionally, sand mining can lead to degraded water quality, including high total suspended solids, low pH, high electrical conductivity, low dissolved oxygen, high biochemical oxygen demand, and high concentrations of Magnesium, Sulfate, Phosphate, and Iron (Lekomo et al., 2021; Pillay et al., 2014). The impact of riverine sand mining is crucial for salinity intrusion in rivers where riverbed lowering is significant (Pillay et al., 2014). The degradation of water quality parameters poses a great threat to aquatic ecosystems (R. K. Bhattacharya, Dolui, et al., 2019).
A sediment budget is a concept for studying the sediment dynamics of a basin (Notebaert et al., 2009) and was proposed many years ago (Rapp, 2017). However, it is still broadly utilized as the most preferable unit for characterizing and managing sediment issues in catchments because it is simply applicable at the basin scale (Walling & Collins, 2008). This concept is based on the mass conservation principle, which considers mass balance in a target region. The study of temporal channel changes is also essential for understanding the underlying processes of the present geomorphology (Chen et al., 2007; Mathias Kondolf, 1994). Appropriate measures should be implemented to mitigate the adverse effects of sand mining. However, special attention is mandatory when implementing in countries that practice extensive legal and illegal sand mining with low control. All parties engaged in sand mining activities are responsible for implementing measures to prevent and mitigate the adverse impacts of sand mining. The government and local authorities must establish strict regulations, grant permits for sand mining in a controlled manner, oversee and inspect sand mining operations to ensure compliance with all requirements, and share information on sand mining technologies (Gavriletea, 2017). Furthermore, process-based river restoration should be implemented to re-establish the standard rates and magnitudes of physical, chemical, and biological processes that create the sustainability of the river system (Katia & Paola, 2017). River restoration techniques are related to watershed assessment, objectives, and problems. Therefore, it is important to assess the impacts, understand the current conditions, and determine suitable bed morphology and mining amount to re-establish physical, chemical, and biological processes, including the capability of transporting floodwater, water quality improvement, and formation of diverse ecosystems.
This study focuses on the physical and environmental conditions in the lower reaches of the Kelani River, where worsening effects of sand mining are evident, and aims to determine how sand mining should be conducted to maintain a suitable river channel for flood control, water use, and the river channel environment. To this end, the physical environment of the river channel, including the actual state of riverbed degradation and channel morphology, will be discussed using data on longitudinal riverbed profiles, ground photographs taken in the 19th and 20th centuries, current photographs, and field survey results. Second, the actual sediment budget in the lower reach is discussed using the computed results of the sediment transport rates at the reach scale. Here, a reach (also known as a unit channel) is defined as a river segment between two tributary junctions, featuring two inflow points and one outlet point (Egashira & Matsuki, 2000; Harada & Egashira, 2024). Finally, a method to identify the allowable amount of sand mining in the downstream reach is discussed based on sediment budgets, floodwater transport capacity, intrusion length of the salt wedge, analysis of sediment mobility, and riverbed morphology.
2 HYDROLOGICAL AND ENVIRONMENTAL CHARACTERISTICS OF THE STUDY AREA
2.1 Hydrological and physical conditions
The Kelani River Basin is bounded by latitudes 6° 47′ and 7° 05′ and eastern longitudes 79° 52′ and 80° 13′ and is completely located in the wet zone of the country, as illustrated in Figure 2. The catchment covers an area of 2230 km2 (Dissanayaka & Rajapakse, 2019). The upstream area is steep, whereas the downstream area is flat below Hanwella (De Silva et al., 2012). The catchment receives an average annual rainfall of 3718 mm. Southwest monsoon rains contribute mostly to the annual rainfall; however, the contribution of the northeast monsoon and inter-monsoon rains is also considerably high (Hettiarachchi, 2018). Streamflow fluctuated in the range of 600 and 1800 m3/s during the monsoonal season (Dissanayaka & Rajapakse, 2019).
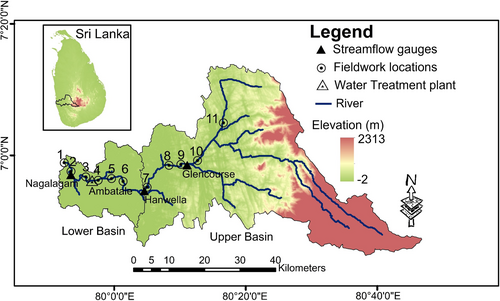
Figure 3 illustrates the annual maximum discharges recorded from 1995 to 2018 at Hanwella (downstream) and Glencourse (upstream). The annual maximum discharge at Hanwella ranged from 500 to 1600 m3/s, and at Glencourse ranged from 300 to 1800 m3/s. Furthermore, the average annual maximum discharge at Hanwella and Glencourse was approximately 950 and 800 m3/s, respectively.
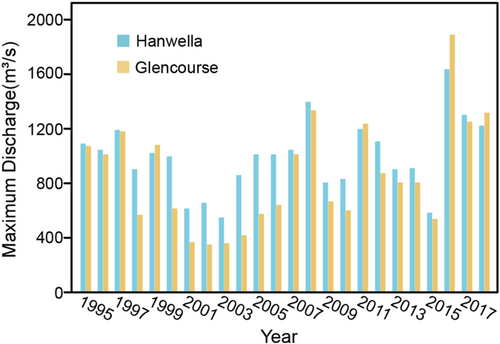
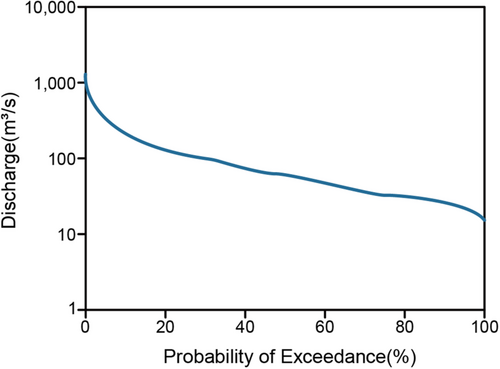
Figure 4 illustrates the cumulative frequency of the daily streamflow at Hanwella from 1995 to 2018, which provides the percentage of time that a particular discharge was equal to or exceeded. The flow duration curve is useful for identifying river flow thresholds. Discharges at 95%–90% and 5%–10% exceedance were classified as low and high flows, respectively. Accordingly, the low and high flows were approximately 30–35 m3/s and 400–255 m3/s, respectively.
The lower basin experiences recurring flooding, with the most recent severe instance occurring in 2016. Figure 5 illustrates the historical flood levels at Nagalagam Street recorded from 1837 to 2018, along with the corresponding flood discharges at Hanwella. According to Figure 5, the magnitude of floods has significantly decreased after the year 2000 when compared to the past. This may be attributed to the current riverbed lowering and changes in the climate. Although the magnitude of floods has decreased in the present, the cost of flood damage has increased due to the prolonged duration of flooding and urbanization in the floodplain.
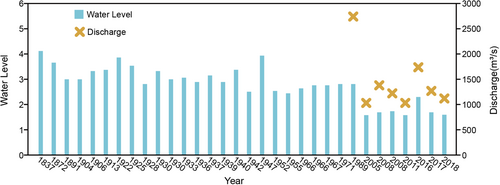
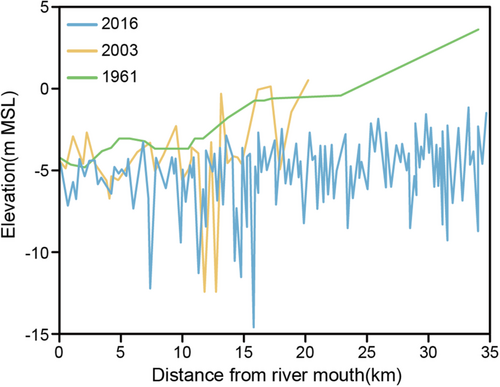
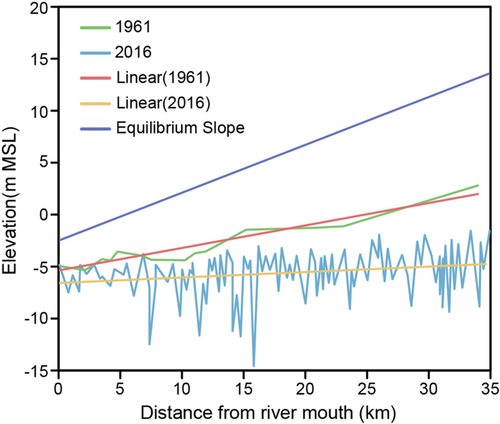
Figure 6 shows the longitudinal profile of bed elevation measured in 2016. As shown herein, the riverbed profile varies randomly, which may be caused by sand mining, channel meanders, sand bars, and bedrock hindrance. Therefore, the channel bed elevation varies about −2 and −15 m from the mean sea level (MSL) in the downstream reach and changes to a steep stream in the upstream section starting from 40 km. The bed slope of the reach is an important factor that controls sediment transportation. It is estimated to be 5.5 × 10⁻⁵ in the downstream and 5 × 10⁻⁴ in the upstream. The riverbed elevation also varies approximately in the range of −3 to 7 m MSL from 40 to 60 km upstream of the river mouth, which is nine times steeper than the downstream riverbed.
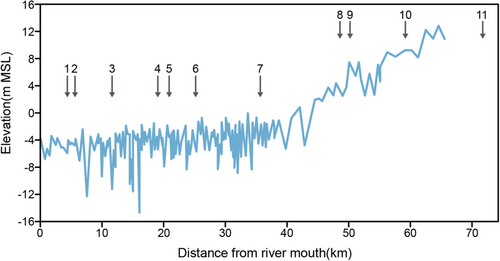
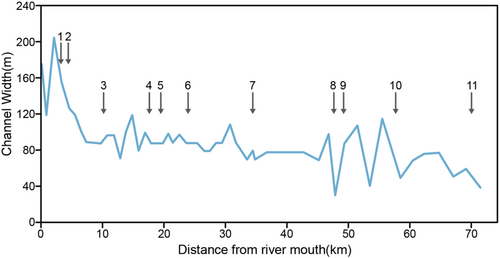
Figure 7 illustrates the channel widths. Although it widens at the proximity of the river mouth by about 160–200 m, it can be estimated on average to be 80 m for the downstream section and 60 m for the upstream section. At some upstream locations, the channel width narrows unexpectedly by 40–20 m due to hindrance by bedrock and meanders.
2.2 Impacts of sand mining on the physical environment
River morphological characteristics reflect the flow and sediment transport processes in the river (Church, 2006; Joshi et al., 2019). Figure 8 shows photographs taken in January and February 2023 to introduce the present morphological characteristics in the downstream and upstream reaches. Photos (a) and (b) show that the downstream reach with an erodible bank is filled deeply by water due to bed lowering and the backwater effect. Photos (c) and (d), which were taken in the upstream reach, suggest that the upstream reach is characterized by mountain streams, gravel beds, and rocky banks and is very steep in comparison to the bed slope in the downstream reach.
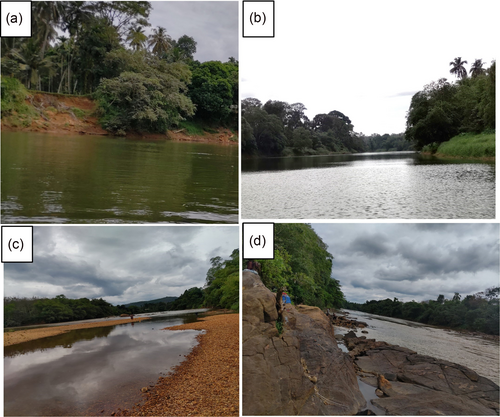
Figure 9a,b shows the features of the downstream reach, which was located 4 km from the river mouth in 1825 and 1906, respectively. The two photographs suggest that the flow depth was shallower than half the height of a mature person, and the channel bed was covered thickly by sediment, considering recent degradation. In addition, the impact of sand mining on the physical channel environment can be recognized.

Cross-sectional shapes of the river channels were measured in 2003 and 2016. Figure 10 shows the longitudinal profiles of their channel beds together with the channel bed elevation measured in 1961. The observed riverbed lowering and uneven changes in longitudinal riverbed profiles in the 2003 and 2016 profiles, compared to the approximate natural riverbed in 1961, are primarily attributed to riverbed erosion resulting from excessive sand mining. Using these data, the lowered volume was estimated to be 1,618,000 m3 for 42 years from 1961 to 2003, and 2,834,000 m3 for 13 years from 2003 to 2016, respectively, in the channel reach from 0.7 to 20.4 km. The mean annual riverbed lowering volumes were 1.95 and 11.1 m3/m for each period, implying that the latest annual sediment loss was 5.7 times larger than the annual average loss for 42 years until 2016.
2.3 Temporal changes in water quality, and impacts on the freshwater ecosystem
Excessive sand mining activities tend to cause sediment supply deficiency, enlargement of channel cross-sections, and increase river channel flood water transport capacity. Besides, such physical changes cause declining water levels, resulting in shallow water levels during the dry season and also affect badly the water supply, water quality, and aquatic habitats (Lai et al., 2014).
Figure 11 illustrates the monthly conductivity measurements from 2015 to 2019 taken at Victoria Bridge, which is located at a distance of 4 km from the river mouth, along with the daily observed discharge at Hanwella on the conductivity measurement day and the maximum marginal standard value of 700 µS/cm set by the Central Environmental Authority (Central Environmental Authority CEA, 1992). As shown in Figure 11, the majority of the observed conductivity values surpassed the marginal maximum value and reached unacceptably high conductivity ranges that exceeded 10,000 µS/cm, indicating the occurrence of salt intrusion.
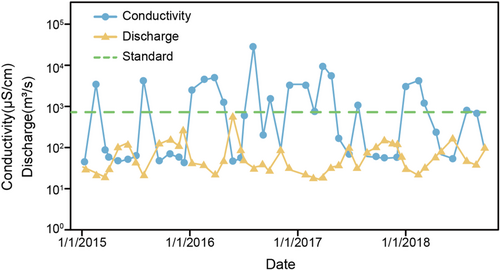
The conductivity in water routinely exceeds the acceptable marginal maximum value when the flow rate is less than 50 m3/s, which corresponds to 66% flow exceedance in Figure 4.
Physical changes in habitat, hydro morphology, groundwater level, and water quality caused by sand mining affect freshwater fish species (Koehnken et al., 2020). The Kelani River Basin exhibits a vital ecosystem, as it comprises 63% of the freshwater fish species in Sri Lanka and is home to a total of 60 fish species, including 30 endemic and 22 threatened species (Surasinghe et al., 2019). Fish species such as Garra ceylonesis, Systomus pleurotaenia, Schistura notostigma, and Puntius titteya, which are specific to certain environmental conditions, are mostly affected by sand mining and are rare in the Lower Basin because of habitat loss, changes in the physical environment, and water quality (Kotalawala, 1994; Sudasinghe et al., 2014; Surasinghe et al., 2019). Such degradation of fish species is correlated to the decrease in sediment mobility and variability of bedforms. A stable riverbed provides an optimal environment that ensures the existence of many species (Rentier & Cammeraat, 2022).
3 SEDIMENT BUDGET
3.1 Sediment size distribution
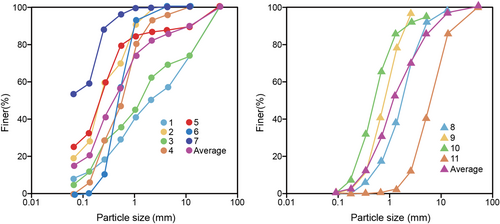
As mentioned in the previous section, riverbed materials were investigated to evaluate sediment transport processes in the basin. Three samples of riverbed material in the mainstream at the middle of the river, and closer to riverbanks from each cross-section were collected at seven downstream locations as well as four upstream locations, as illustrated in Figure 2, between January 15, 2023, and February 13, 2023, using a scraper bucket sampler. Wet and dry sieve tests were conducted to determine sediment grain size distribution curves. Figure 12 illustrates the accumulated size distribution curves of the bed material samples at locations 1–11 in Figure 2. In addition, a reference curve of sediment particle size, which is averaged, is illustrated in the downstream and upstream regions. Table 1 lists the sediment size fractions and finer percentages of each sediment size class of the accumulated upstream and downstream sediment distribution curves that were employed to estimate the downstream and upstream sediment transport rates. As shown in Table 1, the average diameter of the sediments in the upstream and downstream regions was approximately 1 mm. Additionally, according to ASTMD-2487, the soil type of the riverbed material at all locations except for location 7 was sand. At locations 4, 6, 8, 9, and 10, the riverbed material is classified as clean sand. The mean grain size of sediments at locations 3, 4, 6, 8, 9, and 10 was in the range of 0.5 and 2 mm, which is the best for fine aggregates (Amalan et al., 2014).
| Sieve size (mm) | 50 | 12.7 | 4.75 | 2.36 | 1.18 | 0.6 | 0.3 | 0.15 | 0.075 |
|---|---|---|---|---|---|---|---|---|---|
| Upstream sediment size fraction | 0 | 3 | 12 | 14 | 18 | 21 | 19 | 10 | 2 |
| Upstream percentage of finer | 100 | 97 | 85 | 71 | 53 | 32 | 13 | 3 | 1 |
| Downstream sediment size fraction | 0 | 10 | 4 | 3 | 9 | 17 | 16 | 20 | 6 |
| Downstream percentage of finer | 100 | 90 | 86 | 83 | 74 | 57 | 41 | 21 | 15 |
3.2 Estimations of bedload and suspended load
To manage sediment transport processes properly in a drainage basin, including sand mining in river channels, we need to estimate the amount of sediment supplied from upstream to downstream reach and the amount of sediment discharged from the downstream reach to the sea during floods. Herein, the target reach is downstream of the Kelani River. The amount of sediment supplied to the target reach and the amount of sediment discharged to the sea during floods were estimated using bedload formulas and suspended sediment concentration formula, where we employed Egashira et al.'s formula (1997), Egashira & Itoh's formula (2006) and Ashida & Michiue's formula (1972) for evaluating bedload rates, and Harada et al.'s method (2022) for evaluating equilibrium concentration of the suspended sediment.
The validity of the derived bedload formula was evaluated using experimental data (Egashira et al., 1997) and through its application to analyses of channel changes with active sediment transportation in river basins (Nagumo et al., 2024; Rahman et al., 2024; Subedi et al., 2024). Furthermore, this bedload formula is consistent with the functional form of the well-known Brown's empirical formula (1950), and provides almost the same results that are computed by empirical formulas proposed by Shinohara and Tsubaki (1959), and Graf and Suszka (1987).
The method based on a convection–diffusion equation and the equilibrium profile of sediment concentration has been widely employed. However, there remain unresolved issues regarding the reference level and the specification of reference sediment concentration. Consequently, we utilize a novel approach proposed by Harada et al. (2022) to evaluate the entrainment rate from the bedload layer.
As described in Equation (6), an entrainment coefficient, which is defined as the entrainment velocity divided by the mean velocity in the upper layer, depends on the inverse of the Richardson number (the square of the internal Froude number). Recently, we found that the same parameters were used by (Guo et al., 2008) in evaluating the suspended sediment concentration in the lower reaches of the Yellow River. According to their study, observed data on sediment concentration illustrated in Figure 2 of their article from 0.0566 × 10⁻³ to 0.943 × 10⁻³ at (, and range from 0.151 × 10⁻³ to 7.55 × 10⁻³ at (0, where these values are recomputed by volume concentration. While Equation (9) of our manuscript gives 0.91 × 10⁻³ to 9.1 × 10⁻³, respectively, assuming that the sediment particle size of the bed material is the same as that of the suspended sediment one. Given that Equation (9) represents the equilibrium sediment concentration and there exists a discrepancy between the bed sediment and suspended sediment computed concentrations, the computed sediment concentration may be deemed acceptable.
Both of the bedload formula and the formula of suspended sediment concentration employed in our research applied to evaluating inundation processes with active sediment transportation on the flood plain, and their applicability is confirmed (Rahman et al., 2024; Subedi et al., 2024).
The computation of bedload rate and suspended load rates was determined at the reach scale. A reach, also referred to as a unit channel, is a section of a stream or river extending from the point where a tributary joins a river to the subsequent confluence, characterized by two inflow points and one outflow point, exhibiting consistent hydrologic parameters, including discharge, depth, area, and slope (Egashira & Matsuki, 2000; Harada & Egashira, 2024). Figure 13 presents a schematic representation of a unit channel, illustrating its planform and longitudinal bed profile.
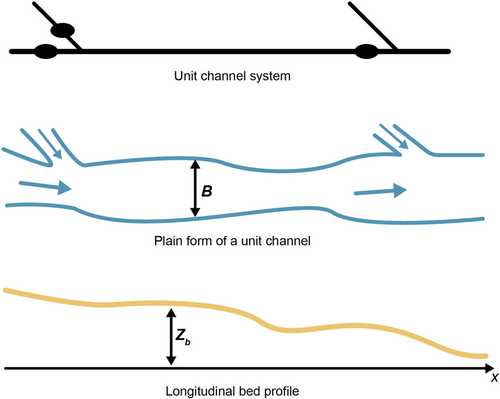
Equation (2) is applied to Equation (10) to evaluate the bed load transport rates, where Equation (2) was reformed to compute bedload transport rates for nonuniform sediment, and Equation (9) is applied to Equation (11) to evaluate the suspended sediment transport rates.
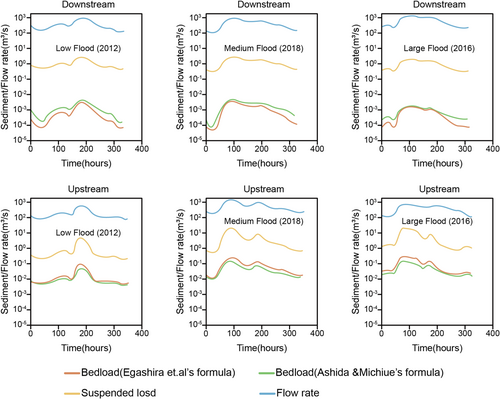
The sediment hydrographs for bedload and suspended load corresponding to different typical floods that occurred between 2012 and 2018 were computed using Equations (2), (3), (9), (10), and (11). In these computations, reference cross-sections are specified as follows: The bed slope and the channel width are = 5 × 10⁻⁴ and = 60 m in the upstream reach (unit channel) and = 5.5 × 10⁻⁵ and = 80 m in the downstream reach (unit channel). Besides, size fractions of bed material don't change in these estimations to obtain stable, prospective results on sediment hydrographs. Figure 14 shows the results together with the flood hydrographs. Both bedload and suspended load were larger in the upstream region than in the downstream region, where the sediment hydrographs changed in accordance with the flood hydrograph. Suspended load dominates both the upstream and downstream reaches, and the bedload transport rates are negligibly small.
3.3 Sediment budgets at the downstream reach
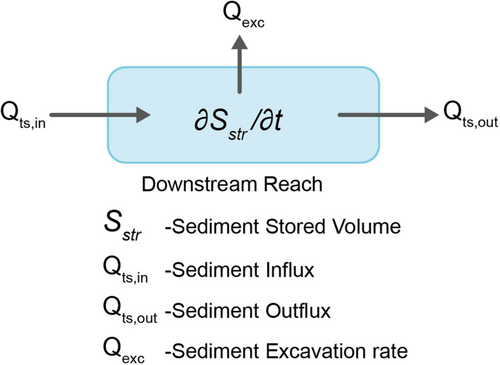
To compute the sediment discharge simply and stably, we assumed that the bed slopes and bed material did not change in the upstream and downstream reaches, allowing parallel bed aggradation and degradation. Figure 15 illustrates the sediment budget for the downstream reach, where is the influx to the downstream reach and is the outflux from the reach to the sea.
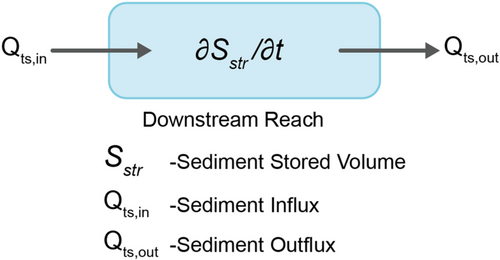
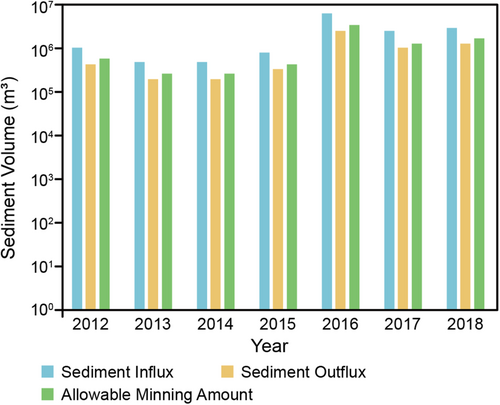
Figure 16 shows the sediment fluxes, such as the annual amounts of bedload and suspended load transported from upstream and towards the sea, together with the approved mining amount. Annual bedload was estimated using the formula proposed by Egashira et al. According to Figure 16, it is apparent that the annual bedload and suspended load, except in 2012, which entered the downstream reach, were higher than the outflux from the reach. Outflow-suspended loads are dominated mostly by sediments finer than 0.075 mm (clay and silt), which can be transported toward the sea. Therefore, there are no silt or clay deposition issues in the downstream reaches. The approved mining amount is 14 times larger than the estimated upstream bedload for low- or non-flooded years, although the approved mining amount is 0.6 times the bedload supply during large floods and 0.9 times the bedload supply for years with medium floods. However, the actual amount of mining cannot be estimated (Global Water Partnership, 2018).
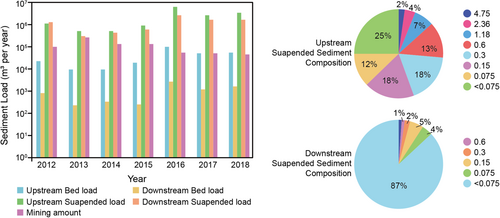
Figure 17 shows the annual sediment stored volume in the downstream reach and the approved mining amount by the Geological Survey and Mines Bureau from 2012 to 2018, where it was evaluated assuming that there was no sand mining.
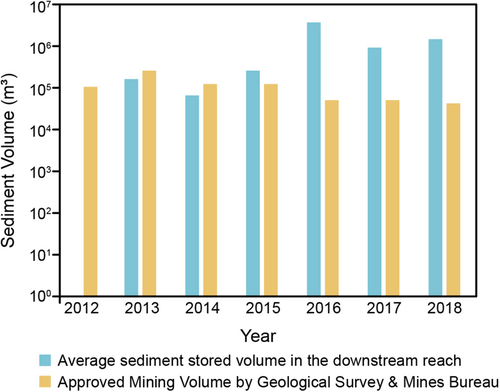
Referring to the flood discharge data illustrated in Figure 3, the bar graph suggests that the annual sediment volume stored in the downstream reach was significantly influenced by the magnitude and occurrence frequency of the flood. For example, in 2012, fine sediment was only transported to the sea without significant upstream sediment supply because no flood occurred. In 2013, 2014, and 2015, the stored sediment volumes ranged from 80,000 to 308,000 m3/year. Floods ranging from middle to large sizes took place in 2016, 2017, and 2018; thus, these floods resulted in the accumulation of substantial amounts of sediment in the downstream reach, which amounted to 4,679,000, 1,126,000, and 1,924,000 m3, respectively.
4 SUITABLE CHANNEL GEOMORPHOLOGY
4.1 Restoring channel condition
- (1)
It has a transport capacity of floodwater,
- (2)
It is unlikely to cause water use problems resulting from saltwater intrusion,
- (3)
It is a physical environment in which diverse ecological systems can be formed.
Equation (13) shows that the sediment supply rate from the upstream balances the elimination rates due to sediment mining and the flushing rate to the sea. This condition illustrated by Equation (14) shows that the sediment stored volume in the downstream reach should be larger than the critical sediment volume causing saline water issues and less than the critical volume causing floodwater inundation.
Sediment mobility is a critical aspect of river dynamics, as it is responsible for the erosion and formation of bedforms, as well as lateral and vertical changes in the channel that are essential for the diversity of riparian landscapes and the conservation of pioneer species. To fulfill condition (3), the river restoration channel must be capable of creating at least alternate bars, and sediment mobility must increase to a level that ensures significant sediment transportation.
4.2 Conditions of the 1961 channel
4.2.1 Equilibrium bed slope of the downstream
Equations (17) and (18) show that the equilibrium bed slopes for the bedload and suspended load were 0.00046 and 0.00045, respectively. As shown in Figure 16, suspended sediment transportation significantly dominated in both the upstream and downstream reaches. The equilibrium bed slope described by Equation (18) is shown in Figure 18. The equilibrium bed slope was steeper than the bed slope formed in 1961, which means that we were able to restore the 1961 river reach while performing sand mining in the downstream reach.
4.2.2 Transport capacity of floodwater
The transport capacity of the floodwater was investigated for the channel formed in 1961, the restoring channel, by comparing the water surface profiles and levee heights along the reach. The water surface profiles along the reach were computed using the continuity and energy conservation equations for a one-dimensional steady flow. Figure 19 shows the water surface profiles for the restoring channel, where Manning's roughness of 0.03 was employed, and the discharges corresponding to the peak flow discharges for several flood magnitudes.
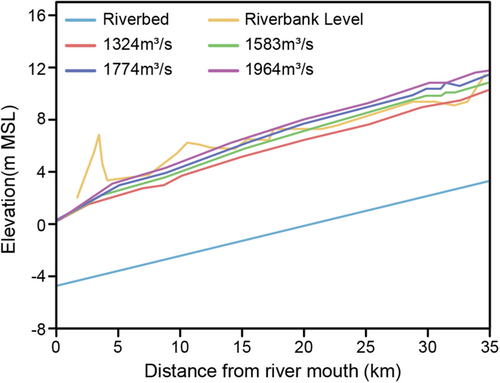
According to the comparisons of the levee/ground level heights and water surface elevations for each flood, overtopping of floodwater may occur in the regions listed in Table 2.
| Flood discharge (m3/s) | Affected channel cross sections from the river mouth where overtopping occurs for the flood with a 100-year return period (km) |
|---|---|
| 1964 | 6–8 |
| 1583 | 13.4–20 |
| 1324 | 20–26 |
| 1583 | 26–28.8 |
| 1324 | 28.8–31.5 |
| 1200 | 31.5–33.2 |
| 1324 | 33.2–34 |
Countermeasures must be implemented to reduce flood damage. However, it should be noted that computations of the water surface profile were performed to demonstrate the process for setting the allowable sediment mining volume and not for designing the channel for flood control purposes.
4.2.3 Saltwater intrusion
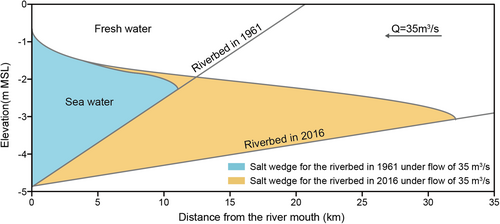
It is important to note that the saltwater intrusion issues were not present 25 years ago at the Ambatale water intake. However, it now occurs when the flow is less than 90 m3/s (EIA for Alterations to the Salinity Barrier at Ambatale in Kelani River, 2022). To investigate the effect of the restoring channel on water quality, the intrusion lengths of the salt wedge were calculated using the frictional two-layer hydraulic model of the salt wedge (Krvavica & Ružić, 2020) based on the method of (Schijf & Schönfled, 1953), considering an estuary width of 120 m, a quadratic interfacial drag coefficient () of 6 × 10⁻⁴, and an ocean basin salinity difference of 35 psu. Figure 20 illustrates the extent of salt wedges for the 1961 and 2016 channels at a flow discharge rate of 35 m3/s, which corresponds to a 90% probability of occurrence in Figure 4. The findings indicate that the salt wedge intrusion lengths for the 1961 and 2016 channels were approximately 11 and 32 km, respectively, under the flow rate of 35 m3/s. This suggests that the 1961 channel was not subject to salt intrusion up to the Ambatale water treatment plant for 90% of the flow discharges. Therefore, the sediment stored volume corresponding to the 1961 river slope is larger than the critical volume, causing saline water issues .
4.2.4 Diversity in the physical environment
Bed-lowering often influences bedforms, resulting in morphological changes that may affect the ecological system. Figure 21 shows regions of mesoscale bedforms that were investigated using (Kuroki & Kishi, 1984) for flow discharges ranging from 30 to 400 m3/s, which correspond to 5% to 95% exceedance for the cumulative frequency of the daily streamflow illustrated in Figure 4, where the channel bed conditions observed in 1961 and 2016 are employed. Data points for the 1961 and 2016 riverbed correspond to flows of 30 to 100 m3/s in 10 m3/s intervals and 100 to 400 m3/s in 100 m3/s intervals. Here, is the nondimensional bed shear stress (see Equation (1) in Section 3), is the channel width, is the channel bed slope, and is the flow depth.
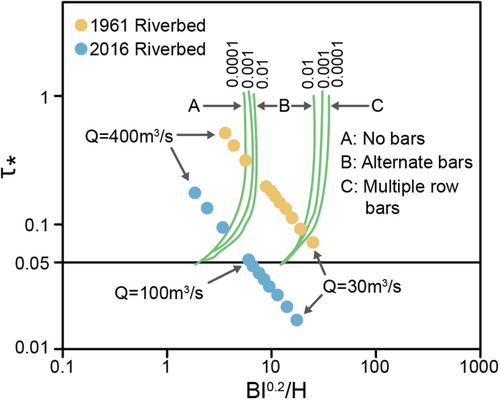
Sediment mobility is usually evaluated using nondimensional bed shear stress, where sediment transportation is initiated when increases above a critical value (e.g., 0.05). Consequently, for the 2016 riverbed, points below τ∗ of 0.05 pertaining to flows of 30–100 m3/s indicate that sediment transport does not occur. The results suggest that alternate bars can be formed in the 1961 riverbed for a wide range of flow discharges and cannot be produced in the 2016 riverbed, and that the sediment mobility is much higher in the 1961 channel bed than in the 2016 channel bed. These results indicate that the channel bed morphology in 1961 had diversities in the physical environment, which is expected to be suitable for ecological systems.
4.3 Allowable mining amount
We propose a river channel formed in 1961 as the restoring channel, focusing on flood management, water quality (water use), and diversity of the physical environment. The bed slope of the restoring channel was approximately 2.31 × 10⁻⁴. Therefore, the sediment volume, which is the volume of the sandwiched region between the 2016-channel bed and the 1961-channel bed, was estimated to be 10.8 million cubic meters. To fill this volume with sediment, we can employ several methods such as prohibiting excavation until the filling up of sediment or allowing a small amount of excavation until developing the restoring channel.
The 1961 river channel was set as the restoring target in consideration of the river's environmental aspects; however, if the channel is not acceptable as a flood control measure, the requirements for the river channel to be reclaimed should be re-established. To specify the appropriate amount of sand mining, flood control, water utilization, and river environment issues, including sand mining related to the newly established reclaimed river channel, were evaluated, and the restoring river channel was defined based on these evaluations. The appropriate amount of sand mining should be determined during this process.
5 CONCLUSIONS
- 1.
The riverbed continues to degrade, resulting in reduced sediment mobility and loss of diversity in the physical environment in the downstream reach.
- 2.
If the longitudinal profile of the riverbed in 1961 is used as the target of riverbed rehabilitation, it is expected that the mobility of sediment will increase dramatically, sandbars will be formed, and the physical environment of the river reach will become more diverse.
- 3.
The 1961 riverbed will inhibit the intrusion of saltwater wedges, and current water quality problems will be significantly reduced. However, the rehabilitation of the 1961 riverbed is expected to reduce the transport capacity of flood water owing to riverbed aggradation; however, this problem will not occur except in locally specified areas.
- 4.
The amount of sand mining required to maintain the 1961 riverbed configuration depends on the flood characteristics of the year; however, according to the results of sediment budget estimations based on floods from 2012 to 2018, maintaining an annual average sand mining volume of approximately 468,000 m3 would preserve a favorable physical environment for the reach.
AUTHOR CONTRIBUTIONS
Dissanayaka Mudiyanselage Pavithra Sudeshika: Conceptualization; investigation; research performance; writing—original draft. Yoshiyuki Imamura: Conceptualization; supervision; writing—review & editing. Daisuke Harada: Methodology; supervision; writing—review & editing. Shinji Egashira: Methodology; supervision, writing—original draft.
ACKNOWLEDGMENTS
The authors would like to thank the Irrigation Department, National Water Supply and Drainage Board, Geological Survey and Mines Bureau, Sri Lanka, and Lanka Hydraulic Institute Ltd. for the data, the Department of Civil Engineering of the University of Moratuwa for the laboratory facilities, Dr. Toru Konishi for feedback, Prof. Mohamed Rasmy for providing information about the occurrences of inundation in Kelani River, and Prof. Hideo Amaguchi for software assistance. This study was supported by the Tokyo Metropolitan Government Advanced Research Grant (R4-2).
ETHICS STATEMENT
None declared.
Open Research
DATA AVAILABILITY STATEMENT
Data for this manuscript may be obtained from the corresponding author upon reasonable request.


